引用本文
Petrov D V, Zhuzhulina E A. Ambiguity of Polystyrene Aerosol Beads Properties Found with Mie Spectra Analysis[J]. Spectroscopy and Spectral Analysis, 2020,40(1): 324-327.
Doi:10.3964/j.issn.1000-0593(2020)01-0324-04
Permissions
Doi:10.3964/j.issn.1000-0593(2020)01-0324-04
Copyright©2020, 《光谱学与光谱分析》期刊社
《光谱学与光谱分析》期刊社 所有
Ambiguity of Polystyrene Aerosol Beads Properties Found with Mie Spectra Analysis

Abstract
Broadband Mie scattering is used to determine the parameters of polystyrene aerosol beads in air, such as size and wavelength dependence of refractive index. This method consists in the selection of such parameters of the scattering object, which reproduce observed spectrum properties. That is why it is very sensitive and hence very precise. We found that there is an ambiguity of polystyrene aerosol beads properties, determined with this method. Different combinations of polystyrene particle size and its refractive index can give the same position of Mie resonances. This ambiguity leads to an increase in the error in determining the size and refractive index of the particle. The refined errors are calculated and the way of their reduction is indicated.
Keyword:
Nanomaterials; Mie theory; Polystyrene beads; Size; Refractive index
中图分类号:O433
文献标志码:A


Introduction
Aerosol is defined as a suspension of small solid or liquid particles in a gaseous medium. These particles in the Earth’ s atmosphere have a significant influence on many areas of human existence, ranging from astronomical observations to the Earth’ s energy balance and climate change[1, 2]. The main influence of these particles is through the absorption and scattering of the incident electromagnetic radiation. Particles contained in the air scatter light in different ways, depending on their size and chemical composition. That is why the study of such parameters of atmospheric aerosols, as the size and spectral dependence of therefractive index, is a rather important and highly relevant task.
A prominent role among atmospheric aerosols is played by polystyrene beads. Polystyrene is widely used as food containers and packaging and is generated from both industrial and municipal polymers sources. It has becoming a major environmental concern due to large quantities disposed to landfills and its non-biodegradable in nature[3]. Polystyrene beads, due to their features, such as the spherical shape, are often used by researchers as a test aerosol. Polystyrene beads are commonly used for characterization and calibration of instruments, which remotely sensing the atmosphere aerosol’ s particles[4]. These challenges require a careful characterization of test aerosol particles.
1 Polystyrene beads parameters
There are a lot of methods to study the polystyrene beads particles. One of them is the measurements of scattering spectra of small spherical particles and their interpretation with the help of Mie theory[5, 6, 7]. The same approach was used to polystyrene beads study[8, 9]. This way allows determining the radius and wavelength dependence of refractive index. Details for application of Mie theory are given in[10] and references therein.
Most precise measurements of polystyrene beads spectra were carried out by Jones and colleagues[9]. They measured the scattering spectra of polystyrene beads samples in the range 480~700 nm with a resolution of 0.028 nm. They used a fitting procedure to select the values of radius and refractive indices, which provide best coincidence between measurements and theoretical calculations of Mie resonances positions. It was found, that polystyrene beads have size r=1 227 nm and the dispersion of refractive index is described by equation:
where n is complex refractive index and λ is the wavelength of incidentlight. Eqn. (1) is valid for λ expressed in nanometers and in spectral range 480~700 nm. From fitting process the single polystyrene bead radius was determined with an uncertainty of ± 0.4 nm and refractive index dispersion with an uncertainty of ± 0.000 5.
Figure 1 shows the Mie spectra, calculated for spherical polystyrene bead with size r=1 227 nm and refractive index, described by Eqn. (1). Solid line corresponds to exact calculation and gray shadow shows the area of uncertainty obtained by both radius variation ± 0.4 nm and refractive index variation ± 0.000 5. Dotted vertical lines show the positions of Mie resonances, which was used to fitting process.
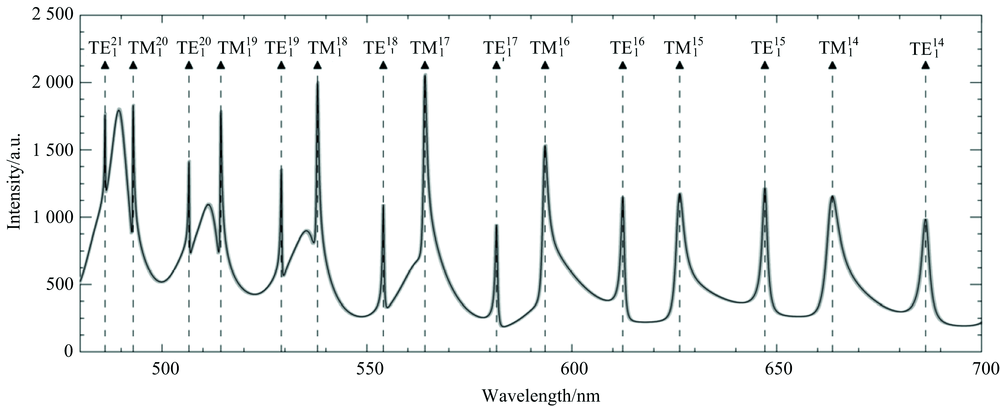 | Fig.1 Mie spectra, calculated for spherical polystyrene bead with size r=1 227 nm and refractive index, described by Eqn. (1) Solid line corresponds to exact calculation and gray shadow shows the area of uncertainty obtained by both radius variation ± 0.4 nm and refractive index variation ± 0.000 5. Dotted vertical lines show the positions of Mie resonances |
2 Mie spectra calculations
The fundamental theory of electromagnetic scattering by a sphere developed by Gustav Mie has been used in great number of publications (see, e.g., [11-20] and references therein). There are numerous codes available to calculate Mie scattering. We developed our own code, which allow making enough precise calculations of intensity and polarization of spherical particles, and using it to studying the polarization behavior with size and refractive index changing.
The interesting question arises— are the particle parameters determined by fitting the Mie resonances uniquely determined?
To answer on this question, we change the size of polystyrene bead Δ r and looking for the corresponding change of refractive index Δ n, which makes minimal the difference between Mie resonances positions in changed and initial cases. Following[9], to determine the best fit for particle size, we minimize the average difference per resonance χ r
where N is the resonances quantity (in this case N=15),
Figure 2 shows the part of polystyrene bead spectra in the range 480~500 nm, containing two resonances. Solid curve and gray shadow is the same, as on Fig.1. Dotted curve corresponds to variation of radius value Δ r=1 nm (so the radius become r=1 228 nm) and corresponding change of refractive index Δ n=-0.001 47. Note, that although this figure show only narrow spectral part, value Δ n=-0.001 47 found for all 15 Mie resonances in spectral range 480~700 nm. Negative value of Δ n means that increasing of radius can be compensated by decreasing of refractive index.
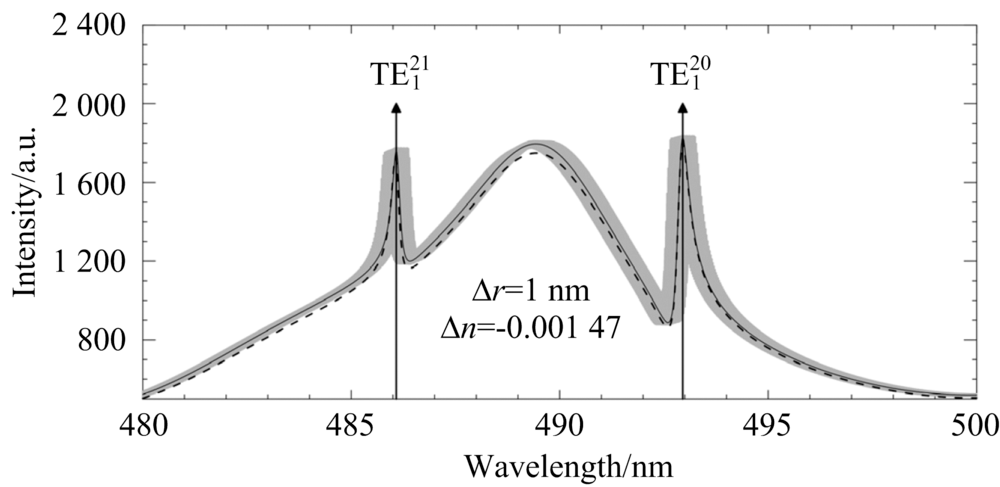 | Fig.2 Polystyrene bead spectra in the range 480~500 nm. Solid curvecorresponds to particle radius r=1 227 nm and refractive index n(λ ), described by Eqn. (1) Gray shadow corresponds to area, obtained by radius variation ± 0.4 nm and refractive index variation ± 0.000 5. Dotted curve corresponds to the radius r=1 228 nm and refractive index n(λ ) -0.001 47 |
You can see, that despite the fact that solid and dotted curves quite different and in some spectral ranges is out of the gray area of uncertainty, difference between resonances position is rather small. Wherein average difference per resonance χ r=0.019 nm in this case, that is smaller than not only typical values of χ r, determined in [9], but also smaller than spectral resolution of measured spectra (0.028 nm).
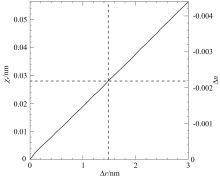
After that, we began to change the Δ r and calculate the corresponding values of Δ n and χ r. This dependence is shown on Figure 3 and due to small changes of values is approximately linear. Values of Δ r plotted on the axis X, χ r-left axis Y and Δ n-right axis Y. Horizontal dotted line corresponds to spectral resolution of measurements 0.028 nm. Because it is impossible to determine resonances position precisely that spectral resolution, this line defines the uncertainty of polystyrene bead refractive index ± 0.002 2. Vertical dotted line passes through the intersection of solid curve and horizontal dotted line, and defines the uncertainty of polystyrene bead size ± 1.48 nm.
 | Fig.3 Average difference of resonances positions χ r and variation of refractive index Δ n as a functions of radius variation Δ r Horizontal dotted line corresponds to spectral resolution of measurements 0.028 nm and defined real uncertainty of polystyrene bead refractive index ± 0.002 2. Vertical dotted line passes through the intersection of solid curve and horizontal dotted line, and defines the uncertainty of polystyrene bead size ± 1.48 nm |
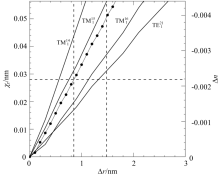
So, the uncertainties turn out to be much larger, than thinking before. Is there a way to reduce them? To investigate this, we calculated not only average difference per resonance, but also the position differences for each resonance separately. It turned out that different resonances have different sensitivity to changes of Δ r and Δ n. We chose four resonances for which the change in position with changes in the radius and the refractive index seems to be maximal.
Figure 4 shows the average difference per resonance of most sensitive Mie resonances-T
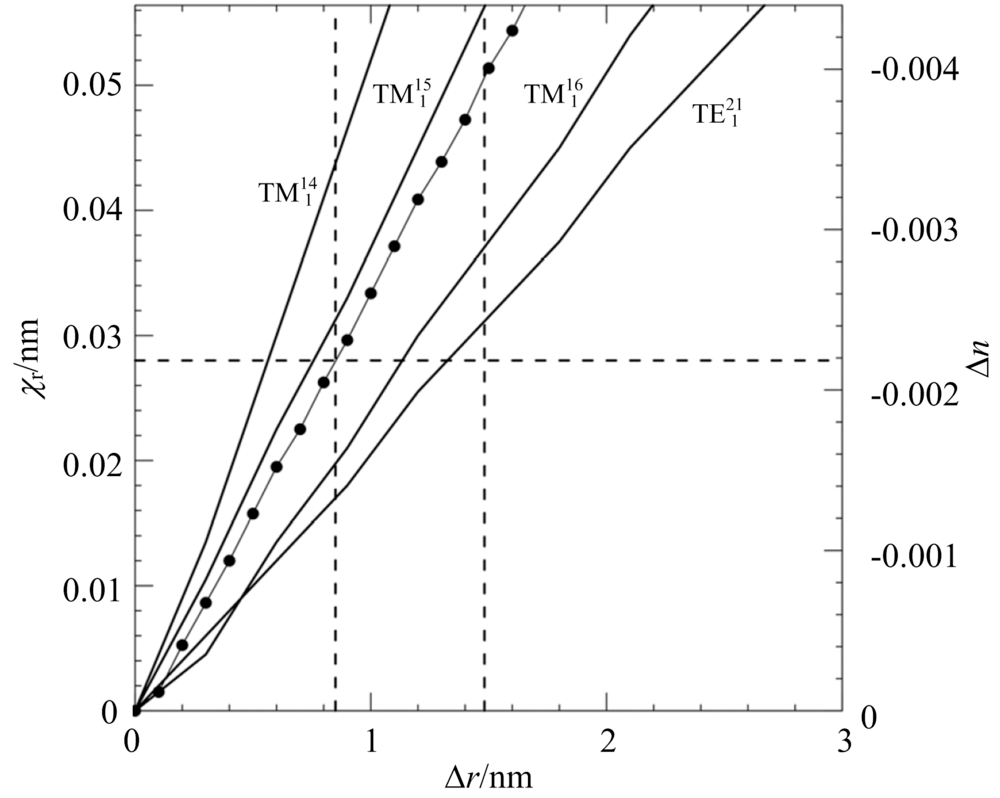 | Fig.4 Average difference of resonances positions χ r and variation of refractive index Δ n as a functions of radius variation Δ r for most sensitive Mie resonances-T Line with points corresponds to calculations of average difference per resonance χ r only for the sefour resonances. Horizontal dotted line and gight vertical dotted line are the same as on figure 3. Left vertical dotted line defines the uncertainty of polystyrene bead size ± 0.85 nm |
3 Conclusion
We investigated the determination of the size and spectral dependence of the refractive index of polystyrene beads by interpreting their spectrum. It has been established that different combinations of the refractive index can lead to almost identical positions of Mie resonances differing less than the spectral sensitivity of the instrument. This ambiguity leads to an increase in the uncertainties in determining the size and refractive index compared to the previously defined ones. It has been established that Mie resonances have different sensitivity to variations of size and refractive index. We suggest to use the four most sensitive resonances T
参考文献
| [1] |
|
| [2] |
|
| [3] |
|
| [4] |
|
| [5] |
|
| [6] |
|
| [7] |
|
| [8] |
|
| [9] |
|
| [10] |
|
| [11] |
|
| [12] |
|
| [13] |
|
| [14] |
|
| [15] |
|
| [16] |
|
| [17] |
|
| [18] |
|
| [19] |
|
| [20] |
|