
基于迭代逼近算法的土壤中机油和柴油混合物荧光信号重叠特性研究
[左兆陆1, 2, 3  , 赵南京
, 赵南京1, 3, * , 孟德硕1, 3 , 黄尧1, 2, 3 , 殷高方1, 3 , 刘建国1, 3 ]
, 赵南京, 孟德硕|
|


随着我国经济的迅速发展, 石油制品需求量与日俱增, 伴随着工农业生产活动, 大量石油制品进入土壤, 造成严重的土壤石油污染。 土壤中的石油污染物会对植物生长产生危害, 并通过食物链威胁人类健康,因此需对土壤中的石油污染物进行现场、 快速检测。 激光诱导荧光技术(Laser-Induced fluorescence, LIF)具有检测速度快、 灵敏度高、 可现场检测等优点, 但在检测土壤中有机污染物时, 面临着荧光光谱重叠严重等问题。 为了研究土壤中机油和柴油混合物荧光信号的重叠特性, 制备了10种含有不同浓度机油、 柴油混合物的土壤样品。 通过搭建LIF实验系统, 获取不同混合浓度的机油和柴油的荧光光谱, 对油类荧光光谱进行了最大值归一化处理, 建立土壤中机油、 柴油混合光谱的反演关系, 以最小残差平方和为指标, 使用迭代逼近算法计算出土壤荧光光谱中柴油和机油样品的荧光贡献率。 分别使用了全谱法和截取特征光谱两种方法计算机油和柴油的荧光贡献率。 全谱法是在混合油样的全波段光谱(200~600 nm)范围进行迭代逼近, 截取特征光谱方法是在截取油样光谱(330~460 nm)段进行迭代逼近。 (330~460 nm)范围内包含了混合油样的所有光谱特征。 用计算出的机油的荧光贡献率与机油样品浓度做线性拟合时发现, 截取特征光谱法的拟合系数 R为0.989, 优于全谱法的0.923。 分别用全谱法、 截取特征光谱法计算出的荧光贡献率以及归一化机油、 柴油光谱合成混合油归一化光谱, 与实际归一化混合光谱比较, 截取特征光谱法计算的平均相对误差为3.38%, 优于全谱的8.79%, 其原因是全谱法比截取特征光谱法引入了更多的噪声信号, 所以在计算油类荧光贡献率时产生了较大的误差。 选取机油和柴油归一化光谱上300, 350, 400, 450和500 nm等 5个位置的荧光强度与归一化混合油光谱做多元线性回归拟合, 计算出平均相对误差为10.31%。 结果表明截取特征光谱方法优于多元线性回归方法; 土壤中机油和柴油的荧光贡献率与自身的浓度之间成良好的线性关系, 说明在土壤中机油和柴油混合后各自的化学性质保持稳定, 在土壤中的荧光信号重叠特性是线性叠加的。 这种这种方法同样可以用于其他石油类混合物的解离。 通过该研究提高了LIF技术在土壤中石油烃类污染物定性与定量检测的准确性。 为土壤中石油烃现场快速检测提供了方法支撑。
, ZHAO Nan-jing, MENG De-shuoBiography: ZUO Zhao-lu, (1984—), Pursuing Doctor’s Degree in Key Laboratory of Environmental Optics & Technology, Anhui Institute of Optics and Fine Mechanics, Chinese Academy of Sciences e-mail: zuozhaolu@aiofm.ac.cn
Petroleum hydrocarbons such as machine oil and diesel are important components of soil pollution, and are of great significance for rapid and accurate detection of organic pollutants such as machine oil and diesel in soil. Laser-induced fluorescence (LIF) technology has the advantages of fast detection speed, high sensitivity and on-site detection. However, when detecting organic pollutants in soil, it faces serious problems such as overlapping fluorescence spectra. In order to study the overlapping characteristic of the fluorescence signals of the machine oil and diesel mixture in the soil, 10 soil samples containing different concentrations of machine oil and diesel mixture were prepared. By establishing the LIF experimental system, the fluorescence signals of different mixing concentrations of machine oil and diesel were obtained, and the inversion relationship between the mixed spectra of machine oil and diesel was established. The iterative approximation algorithm was used to calculate the fluorescence contribution rate of diesel and machine oil samples in soil fluorescence spectra. In the process of calculating the fluorescence contribution rate, the two methods of full spectrum and intercepted characteristic spectrum were compared. When linearly fitting with the machine oil sample concentration, the fitting coefficient R of the intercepted characteristic spectrum method was 0.989, and the average relative error was 3.38%, which was better than the full spectrum of 0.923, 8.79%. At the time of verification, the average relative error of multiple linear regressions was 10.11% compared with the multiple linear regression method, which prove that the intercepted characteristic spectroscopy method is still excellent. There was a good linear relationship between the fluorescence contribution rate of machine oil and diesel in soil and its own concentration, indicating that there is no chemical reaction after mixing machine oil and diesel in soil, and the overlapping characteristic of fluorescence signals in soil are linearly superimposed. The method is equally applicable to the separation of fluorescence spectra of other petroleum hydrocarbon mixtures in the soil. Through the research in this paper, the accuracy of qualitative and quantitative detection of petroleum hydrocarbon pollutants in soil by LIF technology was improved. It provided method support for rapid detection of petroleum hydrocarbons in the soil.
With the rapid growth of economy, the soil environment has suffered from serious pollution of oil pollutant[1, 2]. Leakage of oil always happened, when petroleum products were in use, transit or storage. That caused a lot of oil going into the soil, leading to an environmental pollution[3, 4]. The pollution is getting worse nowadays, so more and more countries in the world have paid a great attention to studying on how to detect and hold down the oil pollution. The machine oil and the diesel are common petroleum products, which are widely used in the automobile industry and manufacturing industry[5, 6, 7]. Both of them are the important components of petroleum pollutants. At present, there are many methods for detecting and analyzing variety oils in soil, such as extraction, ultrasonic extraction, gravimetric, turbidimetry, UV-spectrophotometry, infrared-spectrophotometry, gas chromatography and pyrolysis[8, 9, 10, 11]. All of them often waste time cost a lot and even cannot guarantee the precision.Laser-induced fluorescence (LIF) spectroscopy is excellently suited for the in-situ analysis of fluorescent organic compounds in the solid environment. Its theory is that when the surface of the soil sample which is mixed with oils is irradiated by using the laser as a light source, electron transition is excited, then the fluorescence is produced. Because of the high sensitivity, signal-to-noise ratio and the samples for which there are no need to be pretreated complicately, LIF is utilized to detect petroleum products concentrations in water or mass fraction in soils[12, 13, 14, 15] e.g. Mbaye OMA et al.[15] and WANG Yu-tian et al.[16] have studied the change in the fluorescence spectra according to the surface loading of PAH on various soil media. The fluorescence spectra revealed that the increasing surface which was loaded of PAH induced excimer emission. They used fluorescence intensity to analyze the mass fraction of PAH, because a good linear relationship exists between the mass fraction and the fluorescence intensity. The concentrations of machine oil, diesel, and lubricating oil were determined by this method, e.g. Feng Wei-wei et al.[17] He also used fluorescence intensity as a characteristic parameter to calculate the concentrations of oils in samples. Although LIF is widely used, it still faces problems like the fluorescence overlap and the difficulty of component identification when people detect the petroleum pollutants in soil. Petroleum hydrocarbon organics like machine oil and diesel are important components of the petroleum pollutants in soils. It’ s significant for environmental monitoring to detect their contents in the soils fast and exactly. Laser-induced fluorescence (LIF) technology has the advantages of fast detection speed, high sensitivity and in situ detection, but it still faces the problems such as the overlap of fluorescence and the difficulty of component identification. So, the study on relation of the overlap of fluorescence is urgent.
Similar to all of the petroleum products, the main fluorescent substances in machine oil and diesel oil are polycyclic aromatic hydrocarbons, naphthene, alkane hydrocarbon and non-hydrocarbon[17]. Different kinds of petroleum products have different kinds of fluorescent substances, and each one emit a specific fluorescence spectrum. Each kind of oil in soil offers different fluorescence contribution rate. All of that can be considered as the basis for fluorescence detection of the two oils.
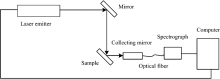
According to the experimental purpose and theory, an experimental system was constructed as shown in Fig.1. which contained a laser emitter, a refracting mirror, a collecting mirror, an optical fiber, a spectrograph, and a computer. The laser emitter (Qsmart-850, Quantel)was used as a light source whose fundamental wavelength was 266 nm. After the light was reflected by mirror, the surface of soil samples which were mixed with different mass fractions of the two oils were irradiated by the UV-light, then the fluoresce was excited. Through the collecting mirror and the optical fiber, the fluorescent signal was collected by the spectrograph (AvaSpec-ULS2048L, Avantes), whose scanning wavelength coverage was 200~600 nm. The computer was the control center of the system, which was used for data storage and display of the fluorescence spectrums.
 | Fig.1 Experimental system |
When the experimental samples were prepared, Shell-XH3 machine oil and 0# diesel were selected as oil pollutant in soil. The two kinds were mixed in proportion, and then they were mixed with the soil. The concentrations of the mixed two oils were shown in Table 1.
| Table 1 The concentrations of the two mixed oils in the soil |
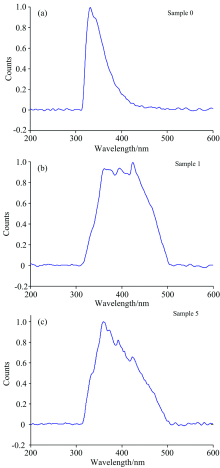
All of the spectrums of 10 samples were collected by the system. Each spectrum was removed soil background spectrum. For example three original spectrums were chosen, such as the pure diesel’ s spectrum (Sample 0), the pure machine oil’ s spectrum (Sample 1) and the mixture spectrum (Sample 5).And by the way the background fluorescence, which was the same to the pure soil fluorescence in the system. The original spectrums were effect from the fluorescence intensity T, which often caused a spectrum fluctuation in experiment. In order to increase the stability of fluorescence intensity of the samples, all the spectrums were normalized. The way was that each spectrum was divided by its corresponding maximum peak, the calculation as equation(1).
Where A was a fluorescence spectrum, max(A) was the max peak value of A, and A' was the normalized spectrum.
After normalizing, the normalized spectrums were shown as Fig.3. Every maximum peak of the spectrums was 1. Every point in each spectrum was scaled down by the corresponding maximum peak of each spectrum, while the wave shape of each spectrum was the same to the original one. Then A' was used to instead A hereinafter.
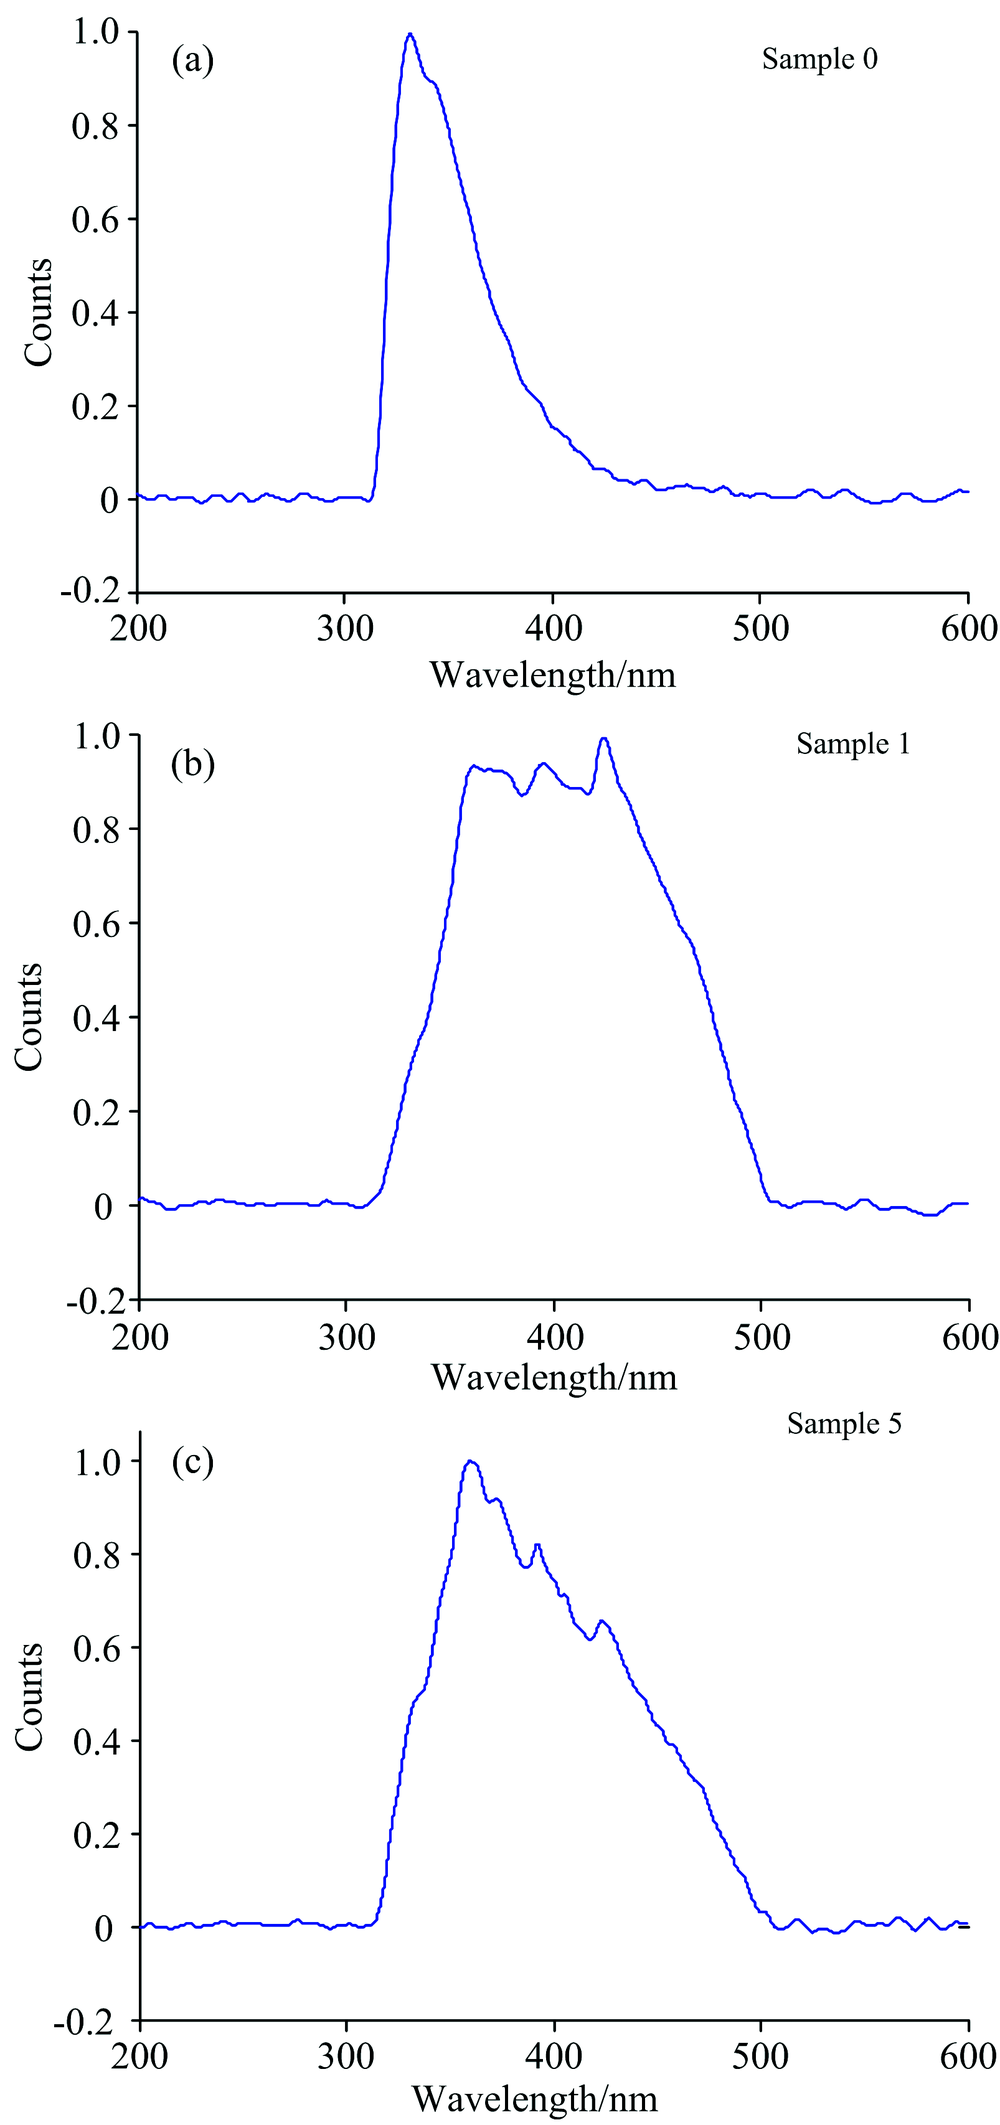 | Fig.2 The normalized spectrums |
'> | Fig.3 The quadratic curve of q and E' of the full spectrum method |
In fact each oil fluorescence spectrum A contained two components: machine oil fluorescence spectrum B and diesel fluorescence spectrum C. So we can get equation(2)
Where q was the fluorescence contribution rate of machine oil, p was the fluorescence contribution rate of diesel, and A0 was the spectrum of pure diesel, A1 was the spectrum of pure machine. The values of p and q were unknown. In order to calculate them, we intended to use iterative approximation. As the values of p and q changing, the composition spectrum Z was composted. And then the equation (3) and equation (4) could be got.
Where E was the value of E (residual error, RE) between A and Z. Where E' was the value of SSE (sum of squares for residuals) between A and Z. When the value of E' was minimum, the corresponding values of p and q was optimal, for the composition spectrum Z was closest to A. We the value of E could be calculated as equation(3), and the value of E' was calculated as equation(4). According equation(4), the minimum value of E' and the corresponding p as the optimal solution (q, E').
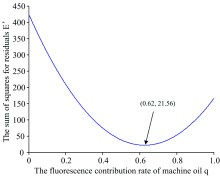
Here two calculation methods were considered to be used to calculate q. The first one was the full spectrum method, which meant the full wavelength coverage 200~600 nm was used to calculate q!according to the steps above and every data in each spectrum should be considered. The second one was intercepted characteristic spectrum method. Its wavelength coverage was 330~460 nm. The intercepted spectrum was including all the characteristic peaks of the spectrums. First, according to approaching the full spectrum algorithm, the method was carried out. The value of q was increasing with a step of 0.01 from 0 to 1. And the soil sample 5 was taken for an example. As equation (4), the sum of squares for residuals E' was the quadratic curve about the fluorescence contribution rate of machine oil q. When q was plotted into the equation(4), the curve was shown as Fig.3.
In Fig.3 the curve was a section of a quadratic curve. Obviously, there was a minimum point in the curve, and it was the optimal solution (0.62, 21.56). It meant that when q was 0.62, E' was 21.56, and at this time the composition spectrum was the closest to the normalized spectrum. Fitted linearity of ω 1 and q, so the fitting equation (5) was acquired.
Where ω 1 was the concentration of machine oil, the fitting coefficient R=0.923. Then we found that the variation tendency of q was consistent with ω 1. The fitting line was shown as Fig.4.
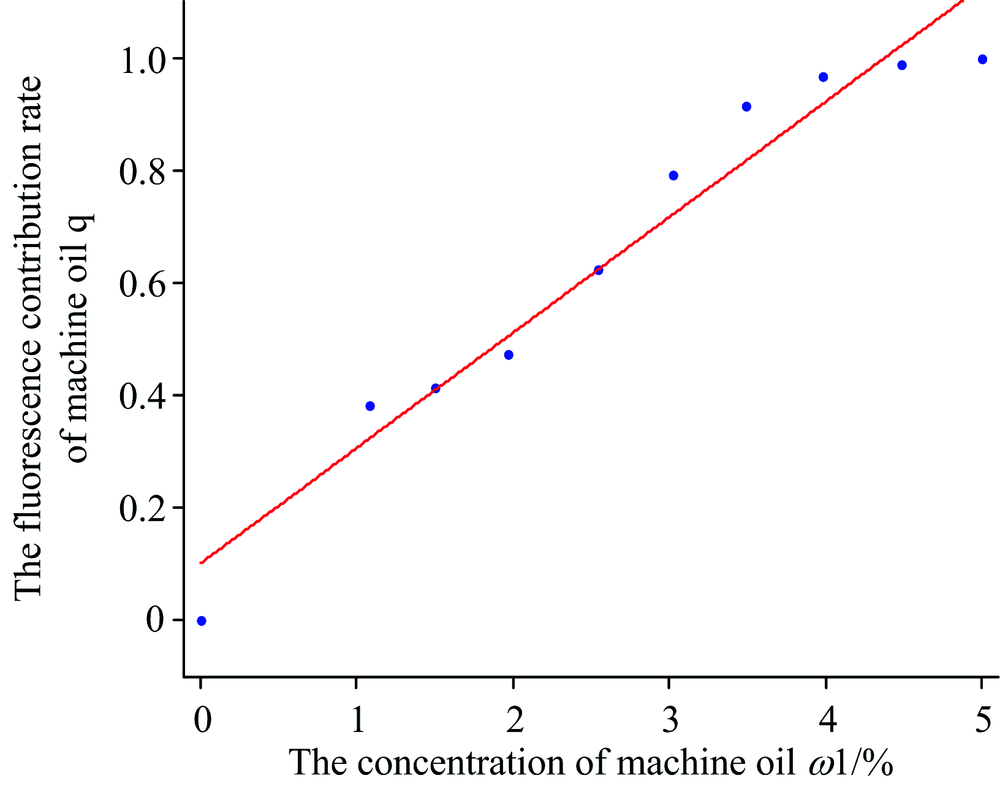 | Fig.4 The fitting line of ω 1 and q of first method |
In Fig.4 the value of q gradually increased synchronously with ω 1 on the line. The 10 points were all near by the fitting line. Generally, q and ω 1 was a linear relation. The discrete distribution of 10 points was not very uniform on both sides of the calibration curve, especially point (0, 0) was away from the other 9 points. Fluorescence contribution rate of the last three points at high concentration was not significantly changed.
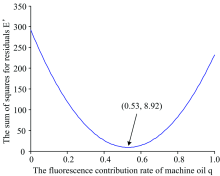
Then the second method was carried out. The wavelength coverage of A 330~460 nm was intercepted, which was contained in all of the characteristic peaks and we repeated the same calculation steps. The quadratic curve of E' and q of second method was shown as Fig.5.
 | Fig.5 The quadratic curve of E' and q of intercepted characteristic spectrum method method |
In Fig.5 the minimum point in the curve also existed, the value of the point was (0.53, 8.92). So the corresponding q was 0.53, E' was 8.92. According to equation (2) the spectrum of the sample 5 could be dissociated to two parts by this method.
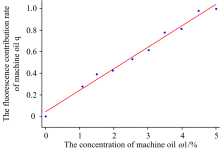
Then we also fitted linearity of ω 1 and q and acquired the fitting equation(6), R=0.989. The fitting line was plotted as Fig.6.
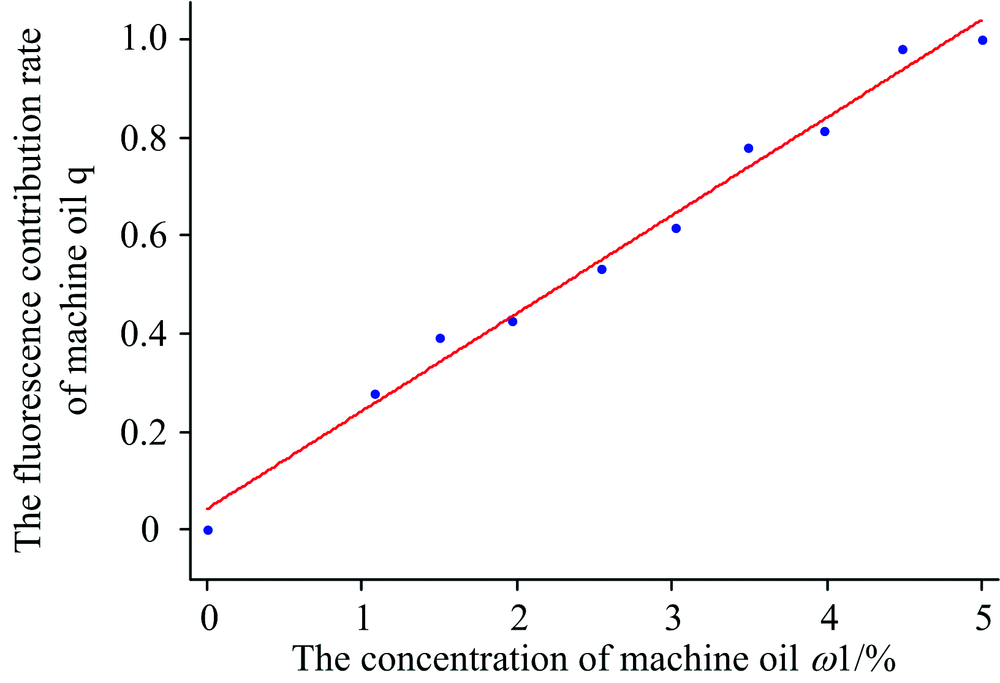 | Fig.6 The fitting line of ω 1 and q of second method |
In Fig.6 the value of q also gradually increased synchronously with ω 1. The intercept of the line was 0.039. There were 10 points which are evenly distributed on both sides of the calibration curve. The values of q and p were both different from the ones of first method. But the value of E' 7.66 was less than the one 21.56 of first method. Furthermore compared equation (5) to equation (6), R=0.989> 0.923. That meant the linearity of equation (6) was better than the linearity of equation (5). ω 1 and q formed a good linear relationship. That meant as the increase of machine oil concentration in the mixed oil, its fluorescence contribution rate in the soil was also increasing. In the mixed oil, the higher concentration of oil, the more similar the fluorescence spectrum of the mixture is to that of the oil. The theory was the same. After mixing soil and oils, their respective chemical properties are stable. Different two petroleum organics also maintained their stable chemical components, for they are all petroleum extracts.
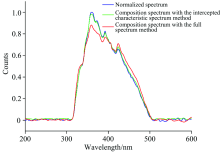
In order to observe the result more directly, the sample 5 was taken as example, and the two composition spectrums were composed according to equation (2), as shown in Fig.7.
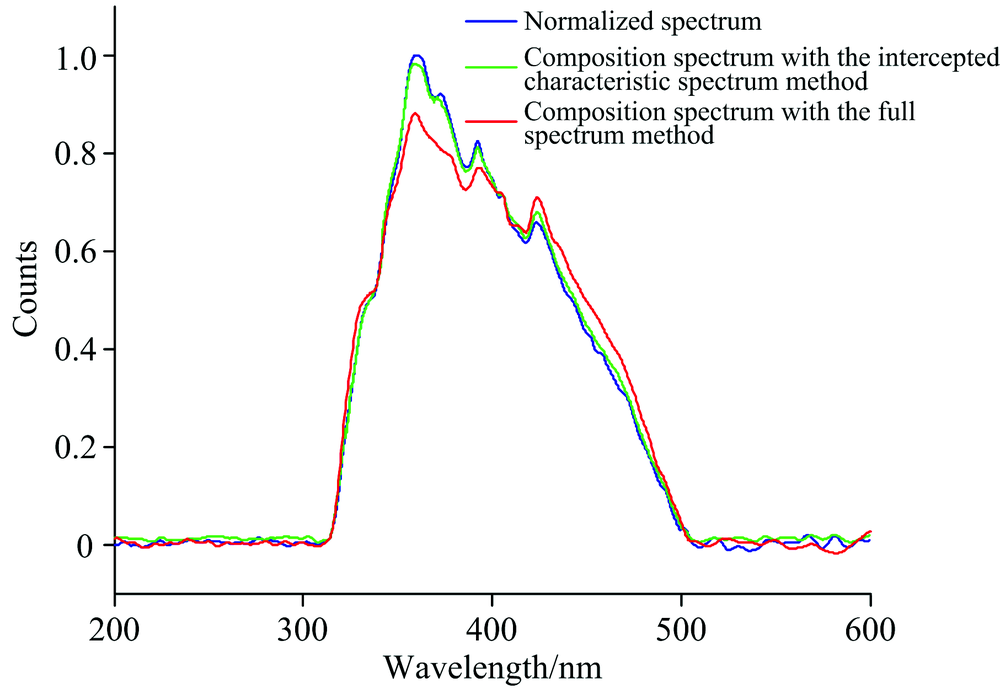 | Fig.7 Comparison of composition spectra with original normalized spectrum |
In Fig.7 we found that the shape of the composition spectrum of second method was closer to the normalized spectrum than the composition spectrum of first method. In especial, it was obvious that the errors in the wavelength coverage 320~460 nm were higher in the composition spectrum of first method. The maximum residual error was 0.11 at 358 nm which was the position of the maximum peak of the spectrum. That caused a great distortion. While the maximum residual error of second method was 0.03. There was a difference of one-tenth between the two methods. That meant the intercepted characteristic spectrum method was better. The average relative error of the 10 samples was calculated was 3.38% in the way of the intercepted characteristic spectrum method, while the one was 8.79% in the way of the full spectrum method.
The third method MLR(Multiple linear regression)was carried out. Fluorescence intensities at 5 positions 300, 350, 400, 450 and 500 nm were chosen for fitting by MATLAB. For sample 5, its relative error was 9.58%. Other samples were used this method to calculate their relative errors too. In this way, the average relative error of the 10 samples was 10.31%. So according to the value of relative error, the results showed that the intercepted characteristic spectrum method was the most accurate algorithm.
We analyzed the reason that the internal signal noise of the instruments still existed and the soil was not fully same or uniform enough in different samples. They all lead to a reduction of SNR (Signal to Noise Ratio). Furthermore the longer wavelength coverage of the spectrum led to more errors, because the proportion of the errors in the wavelength coverage without characteristic peaks was more outstanding. Because the second method included all the peaks of the spectrums, the fluorescence intensities of second method were more higher than the intensities of noises and that led to an enhancement of SNR. The measurement method and results of the diesel were in a similar way. All above proved that the intercepted characteristic spectrum method was better to calculate the fluorescence contribution rate of the two oils in soil based the iterative approximation. And the concentration of oil and its fluorescence contribution rate formed a good linear relationship.
In this paper, we were going to find the overlap relationship of a soil sample mixed with machine oil and diesel. In order to study that, the concentration of each oil and its fluorescence contribution rate were intended to make a linear fitting. When we calculated the fluorescence contribution rate of each oil, two methods as the full spectrum method and the intercepted characteristic spectrum method were carried out respectively. The two methods were both based on iterative approximation. Through comparing, the latter one was better. The results showed that the concentration of each oil and its fluorescence contribution rate formed a good linear relationship in soil. This meant that the fluorescence overlaps characteristics of the machine oil and diesel in the soil were linearly superimposed. This method can also be used for the dissociation of other oil mixtures in soil.
| [1] |
|
| [2] |
|
| [3] |
|
| [4] |
|
| [5] |
|
| [6] |
|
| [7] |
|
| [8] |
|
| [9] |
|
| [10] |
|
| [11] |
|
| [12] |
|
| [13] |
|
| [14] |
|
| [15] |
|
| [16] |
|
| [17] |
|