
氟虫氰表面增强拉曼光谱的密度泛函理论研究
[裔振飞1  , 刘春宇
, 刘春宇1, 2, * , 辛敏思1 , 匡尚奇1 , 周成城1 , 姚治海1, 2 , 蔡红星1 ]
, 刘春宇, 辛敏思|
|


2017年8月初, 荷兰发现大范围鸡蛋受杀虫剂氟虫腈污染。 用拉曼光谱检测的方法对解决氟虫腈检测问题做了一定的探索。 为了获得氟虫腈分子的分子结构振动信息, 根据密度泛函理论中的B3LYP 杂化泛函和6-311G++(d, p)基组, 对氟虫腈分子进行了几何结构优化和频率计算, 得到了该分子的稳定构型和全部振动模式, 计算了氟虫腈分子稳定构型的拉曼散射光谱。 利用HORIBA公司的T64000型光栅共聚焦显微拉曼光谱仪采集了FP的拉曼光谱并配合使用Ag/Cu纳米基底采集了表面增强拉曼光谱, 较强峰出现在211, 308, 350, 867, 1 323和1 432 cm-1处, 次强峰出现在254, 407, 443, 463, 511, 607, 646, 712, 800, 1 065和1 639 cm-1处。 结果表明, 理论计算得到的振动频率与实验测量值在全部较强峰处和部分次强峰处吻合的较好。 并对FP分子200~2 000 cm-1区间内各频率谱线对应的振动模式进行了归属指认, 6个较强峰依由小到大的次序分别指认为21H-22H蜷曲振动, 10F-11F变形振动和21H-22H面外摇摆振动, 15N-22H蜷曲振动, 6C伸缩振动和21H面内弯曲振动, 苯环呼吸振动和9C伸缩振动, 7H-8H面内弯曲振动。 发现表面增强拉曼光谱相对于拉曼光谱整体有微小的频移, 两者整体吻合较好, 表面增强拉曼光谱中211, 867, 1 400和1 432 cm-1处的峰得到了选择性增强, 根据表面增强拉曼光谱的选择定则, 解释为相关振动峰的原子与银衬底表面或许为接近垂直的状态, 并可能与银表面吸附。 下一步计划将氟虫腈混入鸡蛋中, 对氟虫腈在鸡蛋中不同浓度情况下进行指认研究。 研究结果可为氟虫腈的拉曼光谱分析提供理论依据, 将促进食品和农产品中氟虫腈残留的快速检测和在线检测研究。 将拉曼光谱作为对传统化学检测方法的补充。
, LIU Chun-yu, XIN Min-siBiography: YI Zhen-fei, (1998—), Bachelor, Changchun University of Science and Technology e-mail: 2972703886@qq.com
At the beginning of August 2017, Netherlands reported that a wide range of eggs were contaminated with the insecticide fipronil. In this study, the Raman spectroscopy was used to solve the problem of fipronil detection. The stable configuration and all vibration modes of the molecule were obtained after the geometrical structure optimization and frequency calculation, and the theoretical Raman Scattering spectroscopy of the stable configuration of fipronil was also calculated. Normal Raman spectroscopy and surface enhanced Raman spectroscopy of fipronil were collected by HORIBA’s T64000 grating confocal micro-Raman spectroscopy and Ag/Cu nano-substrate. The strong peaks appeared at 211, 308, 350, 867, 1 323, 1 432 cm-1, and the sub-strong peak appeared at 254, 407, 443, 463, 511, 607, 646, 712, 800, 1 065, 1 639 cm-1. The results show that the theoretically calculated vibration frequency agrees well with the experimental measurements at all strong peaks and most sub-strong peaks. The vibration modes corresponding to the frequencies of the fipronil molecule in the range of 200~2 000 cm-1 were assigned. The six strong peaks arranged from small to large were judged to be 21H-22H torsional vibration, 10F-11F deformation vibration, 21H-22H out-of-plane torsional vibration, 15N-22H twisting vibration, 6C stretching vibration and 21H in-plane torsional vibration, benzene ring breathing vibration and stretching vibration of 9C, 7H-8H in-plane torsional vibration. It was found that the surface-enhanced Raman spectrum has a slight frequency shift with respect to the Raman spectrum. The peaks at 211, 867, 1400, and 1 432 cm-1 in the surface-enhanced Raman spectroscopy were selectively enhanced. According to the selection rule of surface-enhanced Raman spectroscopy, it is interpreted as the atom corresponding to the relevant vibration peak and the surface of the silver substrate may be in a nearly vertical state and may be stick to the silver surface. In the next step, fipronil will be planned to be mixed into eggs, and the identification of fipronil in different concentrations in eggs will be carried out. The results of the study can provide a theoretical basis for the Raman spectroscopy of fipronil, which will promote the rapid detection and on-line detection of fipronil residues in food and agricultural products. Raman spectroscopy will be used as a supplement to conventional chemical detection methods.
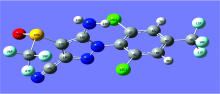
Fipronil has a molecular formula of C12H4Cl2F6N4OS and a molecular weight of 437.2. The molecular structure was shown in Figure 1. Fipronil is an insecticide belonging to the phenylpyrazole family. Fipronil destroys the insect central nervous system by blocking GABA-gated chloride channels and glutamate-gated chloride (GluCl) channels[1]. WHO has classed fipronil as a Class II moderately hazardous pesticide, and it is also a Group C (possibly human) carcinogen prescribed by the US Environmental Protection Agency (U.S. EPA). The 2017 fipronil-poisoned egg incident involved 16 EU countries and Hong Kong.
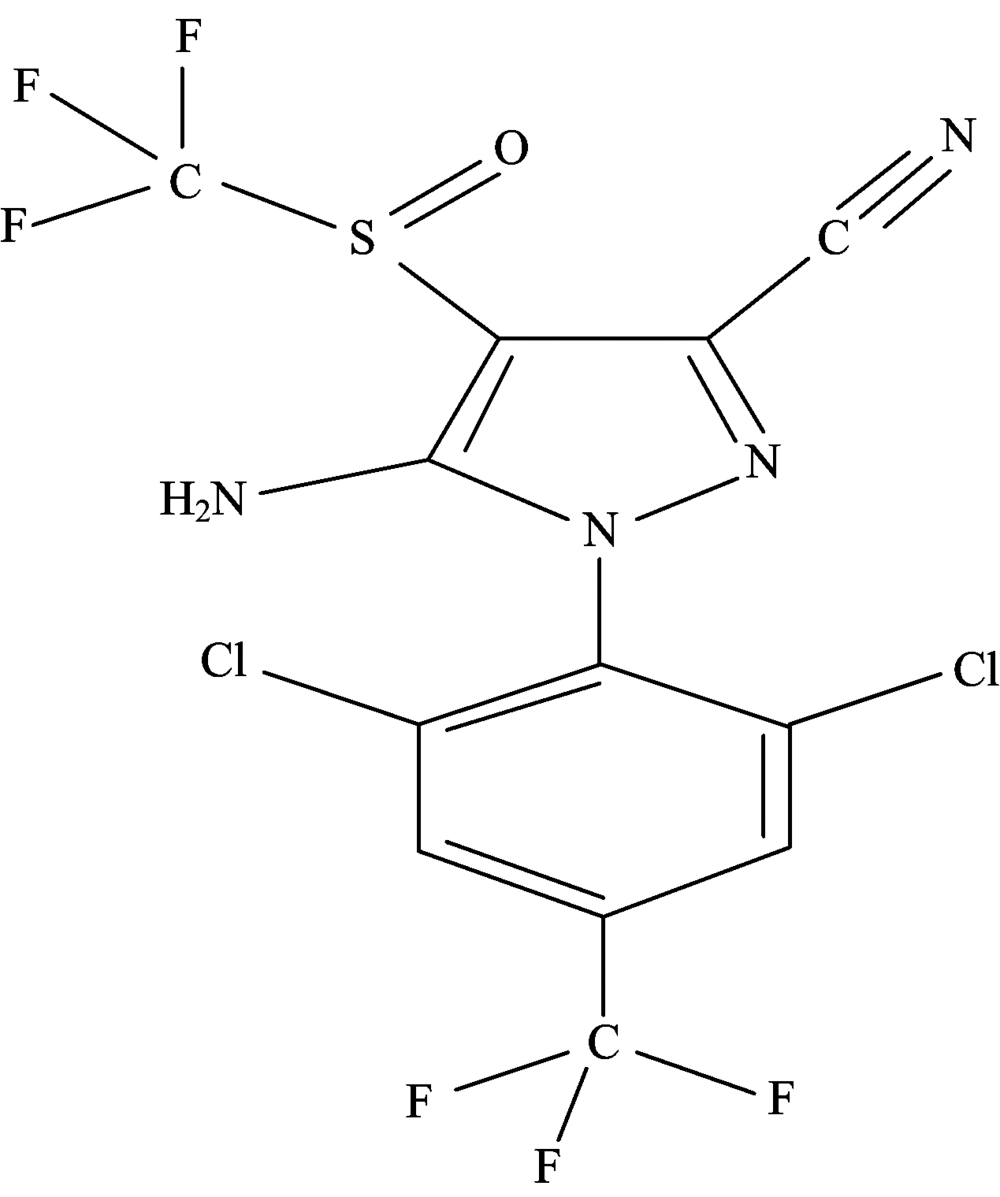 | Fig.1 Molecular structure of fipronil |
The EU stipulates that the residual amount of fipronil in egg products is no more than 0.02 mg· kg-1. The International Codex Alimentarius stipulates that the residual amount of fipronil in egg products is no more than 0.02 mg· kg-1, and the residual amount in poultry meat is no more than 0.01 mg· kg-1. GB2763— 2016[2] stipulates that the residual amount of fipronil in grains and vegetables is no more than 0.02 mg· kg-1 (no more than 0.1 mg· kg-1 in corn), but its maximum residue limit in eggs and poultry has not been made by any regulation. On October 1, 2009, China specified that fipronil can only be used to treat household hygiene pests. The conventional fipronil detection methods are gas chromatography-electron capture detection (GC-ECD)[3], liquid chromatography (LC)[4], liquid chromatography tandem mass spectrometry (LC-MS/MS)[5, 6], gas chromatography-mass spectrometry (GC-MS)[7] and high resolution chromatography-high resolution mass spectrometry (HRGCP LC-HRMS)[8] and so on. These chemical methods are complicated to operate, and the preparation is cumbersome and time consuming. At present, there are rare reports on the Raman spectroscopy of fipronil.
Raman spectroscopy is a scattering spectrum. It could reflect the structural characteristics of a molecule. However, in general, the Normal Raman spectroscopy(NRS) signal of the substance is very weak. In order to enhance this signal, the Surface Enhanced Raman Spectroscopy(SERS) is usually obtained by attaching the substance molecule on the surface of the roughened electrode. Raman spectroscopy does not need sample preparation, short measurement time, high sensitivity and accuracy, and is ideal for rapid detection and on-line detection.
Density Functional Theory (DFT) is a modeling method for physics, chemistry and materials science. It bases on ab initio method and quantum mechanics. It is commonly used to study the electronic structure of multi-body systems, especially atoms, molecules and condensed phases. Numerous studies conducted in Raman spectroscopy have shown its credibility[9, 10, 11]. In this paper, the theoretical calculation of the Raman spectra of fipronil molecules at the level of B3LYP/6-311G++(d, p) was carried out, and it was found to be in well agreement with the experimental measurements, and its vibration modes have been assigned.
In the experiment, the spectrometer was a T64000 grating confocal micro-Raman spectrometer from HORIBA. Spectra-Physics’ Stabilite 2017 Ar ion gas laser was used as the excitation beam source and its excitation line is 514.5 nm. The laser power of the sample surface was approximately 9.64 mW. OLYMPUS’ s BX41 (NA=0.25) 10× microscope. Fipronil (Purity≥ 98%) was purchased from Aladdin Reagent Company (China). Other reagents such as acetone, ethanol and silver nitrate were of analytical grade and were purchased from Beijing Chemical Company. Water used in this experiment was ultrapure water (18.2 MΩ ).
DFT can intuitively reflect molecular vibration information and was the most commonly used method in quantum chemical calculations. In this paper, the Raman spectrum of fipronil was calculated by G09W quantum chemical software package. The molecular configuration was calculated by Gauss View 5.0 at B3LYP/ 6-311G++(d, p) level. The keyword was opt freq=raman b3lyp/6-311++g(d, p).
The Ag/Cu nano-substrate was prepared according to the method of Xiaohong Jiang[13]. The 2 cm× 1 cm copper piece was ultrasonically cleaned with acetone, ethanol and ultrapure water for 10 min, then immersed in dilute nitric acid for 1 min to remove the surface oxide. Rinsed the treated copper foil with ultrapure water and dried it at room temperature. The dried copper sheet was immersed in the mixed solution containing 0.02 mol· L-1 SnCl2 and 0.02 mol· L-1 HCl for 1 min, taken out, dried again at room temperature, and then immerse the dried copper sheet in the 0.01 mol· L-1 AgNO3 solution containing PVP [m(AgNO3):m(PVP)=2:1] for 1 min. Finally, the copper piece was placed in the solution containing Sn2+ and then immersed, taken out, rinsed with ultrapure water, and dried at room temperature. The 10-3 mol· L-1 fipronil solution was prepared with acetone as a solvent, and the Ag/Cu nano-substrate was immersed in the prepared sample solution for 30 min at room temperature, taken out, and dried at room temperature in a vacuum oven. Measured the spectrum directly after completion.
The calculation result had no imaginary frequency, and the stable structure of the fipronil molecule was obtained. As Fig.2 shows, the ring composed of 1C, 2C, 3C, 4C, 5C, 6C and the ring composed of 15N, 16C, 17C, 18C, 19N are not on a plane. The dihedral angle of the plane of the two rings is 86.432 71° . The triangular pyramid structure composed of 13Cl, 14Cl, 15N, 9C and 10-12F can be considered as a substitution of a benzene ring.
 | Fig.2 The optimized molecular structure of fipronil |
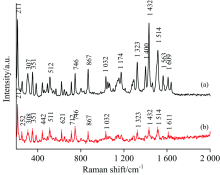
Fig.3(a) shows the NRS of the fipronil, and Fig.3(b) shows the calculated Raman spectrum of fipronil. The calculation results were observed with Gauss View 5.0. The assignments of theoretical calculations and experimentally determined vibration peaks were finished with the help of Gauss View 5.0 and were listed in Table 1[13, 14, 15].
 | Fig.3 Experimental normal Raman spectrum of fipronil (a) and Theoretical Raman spectrum of fipronil (b) |
| Table 1 The assignments of the calculated vibrational frequencies of fipronil (cm-1) at B3LYP/ 6-311G++(d, p) level |
Comparing the calculated values of DFT with the measured values of NRS, it has been found that there are little differences between them, but most of them are the same[16]. Some peaks appear in the calculations but are not found in the measured spectrum, mainly because the theoretical calculation is simply simulation of pure theoretical vibrations of individual molecule. But in the experiment, what has been measured is the solid powder, and there are mutual influence factors such as the intermolecular force and the interaction between the groups; therefore, the theoretical calculation itself has a certain error anyway. In the comparison, we can also see the intensity of the experimental measured value of the solid powder is much higher than the theoretical calculation. But the theoretical calculation still provides a lot of important information for the basic information of the molecule.
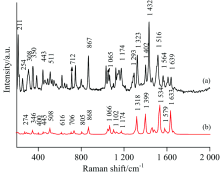
 | Fig.4 SERS of fipronil (a) and NRS of fipronil (b) |
The theoretical calculation of Raman spectra of fipronil was studied and it was in good agreement with NRS. The G09W software package was used as the calculation tool to optimize the spatial structure of fipronil and finally we obtained the stable structure. The theoretical calculation Raman spectrum was given at B3LYP/ 6-311G++(d, p) level. Combined with the vibration mode displayed by the visualization software Gauss View 5.0, the Raman vibration modes of fipronil were assigned. The results of quantitative calculations provide an effective theoretical basis for spectral analysis. Based on Ag/Cu, the SERS of fipronil-acetone solution was studied, and the adsorption mode was inferred. It provided a theoretical basis for the rapid analysis and detection of fipronil.
| [1] |
|
| [2] |
|
| [3] |
|
| [4] |
|
| [5] |
|
| [6] |
|
| [7] |
|
| [8] |
|
| [9] |
|
| [10] |
|
| [11] |
|
| [12] |
|
| [13] |
|
| [14] |
|
| [15] |
|
| [16] |
|