


兴城地区岩石光谱特征与物性参数、 金属元素间响应关系研究
[杨长保1  , 刘娜
, 刘娜2, * , 郐开富3 ]
, 刘娜, 郐开富|
|


岩石物性参数、 元素含量和光谱特征三者之间的相互关系并非独立存在, 研究三者之间的相互关系, 对于探索通过遥感信息进行岩石矿物成分、 物性参数的定量反演方法奠定基础。 采集了兴城地区590块岩样本, 分析其物性参数(密度、 介电常数、 电阻率、 磁化率)、 金属成分含量(Fe, Ti, V, Mn, Zr, Co, Zn, Nb, Bi, Pb)以及岩石光谱之间的关系。 将各物化参数与原始光谱、 光谱吸收深度、 光谱小波包分解后的高低频做相关性分析, 找出各物化参数影响光谱吸收和反射的特征波段, 探究关系密切的参数。 该研究为岩石岩性分类、 某种金属元素和物理特性的反演以及用某种参数来预测关系密切的参数奠定了基础, 取得如下结论: (1)获得了火成岩中Fe, Ti, Mn, V, Zn, Bi和Pb等元素的特征谱带, 其中Fe元素含量更高, 与光谱的相关性更显著。 在0.4和0.54 μm波段附近存在Fe的特征反射波段, 1.0~1.5 μm波段范围内存在Fe元素的特征吸收波段; 在0.4~0.55和0.6~0.65 μm波段范围内, Ti元素与光谱的相关性更显著, 在2.28 μm波段附近存在Ti的特征吸收波段; 在0.41 μm波段附近存在Mn的特征反射波段; 火成岩、 沉积岩V元素与光谱相关性差异性较大, 在0.76, 0.81, 0.89, 0.95 μm波段附近可能存在火成岩的特征吸收波段和沉积岩的特征反射波段; 沉积岩的Zn元素含量与光谱的相关性比火成岩要显著, 在0.41, 1.36, 1.59 μm波段附近可能存在火成岩Zn的特征反射波段, 在2.34 μm波段附近可能存在沉积岩Zn的特征波段; 2.14 μm波段附近, Bi元素对沉积岩光谱的吸收有一定的作用; Pb的特征谱带可能存在于0.45, 0.54, 2.29 μm附近; (2)在岩石各物理特性和光谱的关系研究中, 在0.57~0.85 μm波段范围内, 密度对光谱有很好的吸收反射特征, 在0.53 μm波段附近, 磁化率使光谱有较强的反射, 在1.08 μm波段附近, 磁化率使光谱产生较强的吸收; 电阻率和光谱的相关关系与密度和光谱的相关关系极为相似; (3)在岩石各物性参数间的关系中发现, 密度和电阻率呈显著正相关的关系; (4)在岩石各物性参数与金属元素的关系中研究发现, 密度与各金属元素相关性较弱; 磁化率与Fe和Ti元素呈显著的正相关关系; 电阻率与各金属元素间的相关关系较弱; 介电常数与各金属元素含量呈正相关关系, 其中与V, Zn, Bi元素的相关关系最显著; (5)在金属元素间, Fe与Ti有较显著的正相关关系, Ti与Fe, V元素间有较强的正相关关系, Zn和Pb存在较强的正相关。
YANG Chang-bao, (1972—), associate professor, College of Geo Exploration Science and Technology, Jilin University e-mail: yangcb@jlu.edu.cn
The relationship between physical parameters, elemental content and spectral characteristics is not independent, which lays a foundation for exploring quantitative inversion methods of mineral contents and physical parameters of rocks through remote sensing information.This paper studies the relationship between spectra, physical parameters (density, magnetic susceptibility, resistivity, permittivity),metal contents (Fe, Ti, V, Mn, Zr, Co, Zn, Nb, Bi, Pb) of 590 rocks in Xingcheng Area. Correlates the physicochemical parameters with original spectra, spectral absorption depths, and high and low frequencies after spectral wavelet packet decomposition, finds out the characteristic bands of the physicochemical parameters affecting spectral absorption and reflection, and explores closely related parameters. This study lays the foundation for lithology classification of rocks, inversion of certain metal elements and physical properties, and prediction of closely related parameters with certain parameters. This article mainly achieved the following results. (1)The characteristic bands of Fe, Ti, Mn, V, Zn, Bi and Pb in igneous rocks are obtained. The Fe content of igneous rock is higher, and the correlation with spectra is more significant. Characteristic reflection bands of Fe exist near the 0.4 and 0.54 μm bands, and characteristic absorption bands exist in the range of 1.0~1.5 μm. In the range of 0.4~0.55 and 0.6~0.65 μm, correlations between Ti and the spectra are more significant. There is a characteristic absorption band of Ti near 2.28 μm band and a characteristic reflection band of Mn exists in 0.41 μm band. The correlation between spectra and V element of igneous rock is different from that of sedimentary rocks. Moreover, characteristic absorption bands of igneous rocks and characteristic reflection bands of sedimentary rocks may exist near 0.76, 0.81, 0.89 and 0.95 μm bands. The correlation between spectra and Zn content of sedimentary rocks is more significant than that of igneous rocks. There may be Zn characteristic reflection bands of igneous rocks near 0.41, 1.36 and 1.59 μm bands, and Zn characteristic bands of sedimentary rock near 2.34 μm band. In the vicinity of 2.14 μm band, Bi element has effects on spectra absorption of sedimentary rocks. The characteristic band of Pb may exist near 0.45, 0.54, 2.29 μm band. In the study of the relationship between physical properties and spectra of rocks, the density has significant spectral absorption and reflection characteristics in the range of 0.57~0.8 μm bands. Susceptibility makes spectra have strong reflection near the 0.53 μm band, and susceptibility gives spectra spectral absorption near the 1.08 μm band. Correlations between resistivities and spectra are similar to those between densities and spectra. In the correlation between various physical parameters of rocks, it is found that density is significantly positively correlated with resistivity. (3) In the relationship between various physical parameters of rock, it is found that density and resistivity are significantly positively correlated. (4) In the relationship between various physical parameters and metal elements of rocks, it is found that the correlation between density and metal elements is weak. The susceptibility is significantly positively correlated with Fe and Ti. The correlation between resistivity and metal elements is weak. The permittivity is positively correlated with metal elements. And correlations between V, Zn and Bi elements are the most significant. (5) There are significant positive correlations between Fe and Ti, positive correlations between Ti, Fe and V elements, and positive correlations between Zn and Pb.
Physical parameters, element contents and spectral characteristics of rocks have been the hottest topics in geophysics, geology, geochemistry, and remote sensing science fields. The determination of physical parameters plays an important role in the application of geophysics.
The elemental content not only affects physical parameters, but also has a significant effect on geochemical exploration and regional environmental geochemistry.The application of remote sensing in geoscience has been greatly promoted in recent years. At present, the research hotspots of hyperspectral remote sensing mainly focus on the research on mineral spectral characteristics and spectral characteristics of rocks, among!which the research is mainly on the influence of rocks mineral contents on spectrum[1, 2].
Rocks are the aggregate of minerals. Chemical contents and physical properties of rocks are not only closely related to spectral characteristics, but also are the significant factors to determine spectral characteristics of rocks.Researchers at home and abroad attach great importance to related research. For examples, Lyon found that the mineral compositions were closely related to spectral characteristics in 1959[3]. Charles Heath used the correlation between far-infrared spectrum and X-ray diffraction, combing with the far-infrared attenuation total reflectance spectrum to describe and analyze mineral composition of shale[4]. In China, Guo Fusheng.et al achieved the close correlation between susceptibility and ferrous ion by studying the correlation between susceptibility and spectra of porphyroclastic lavas. Liang Shuneng, et al did the research on crystal chemical parameters and spectral characteristics[5, 6].
The correlation between physical parameters, element contents and spectral characteristics of rocks is not independent. The spectral characteristics of rocks are mainly represented by spectral reflectance and absorption depth. And the chemical compositions of rocks, crystal structure, particle size, degree of weathering, susceptibility, density, resistivity, etc are mainly factors that affect the spectral characteristics of rocks[7]. At present, the research is mainly devoted to one aspect of it, so it is rare for the literature to combine the three to study internal characteristic relationship.This article is based on the sub-theme “ Experimental and Demonstration Base Geophysical Method Experiment” in the “ Deep Detection Technology and Experimental Research Project” . This article is based on the sub-theme “ Experimental and Demonstration Base Geophysical Method Experiment” in the “ Deep Detection Technology and Experimental Research Project” . We collected 590 rock samples in Xingcheng area, and their physical properties (density, permittivity, electrical resistivity, susceptibility) and metal compositions (Fe, Ti, V, Mn, Zr, Co, Zn, Nb, Bi, Pb), rock spectra (0.35~2.5 μ m) were tested. On this basis, we studied the relationship between physical properties, metal element contents and spectral characteristics. Meanwhile, we tried to find out the quantitative relationship between physical parameters and metal element contents on spectral characteristics of rocks. Taking the mineralized characteristic spectra of rocks as the entry point, and combining correlation between the main metal element composition and physical parameters, it has great significance in detecting the composition, structure, type and identification of erosion information of rock-forming minerals, and lays the foundation for the studying quantitative inversion methods for mineral composition and material parameters through remote sensing information[8, 9].
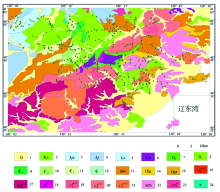
The experimental samples were collected in Xingcheng area of Liaoning Province. There are 590 rock samples, including 59 dolomite, 65 andesite, 93 tuff, 126 limestone, 147 granite, 5 diorite, 6 porphyry, 6 agglomerate, 3 breccia, 73 sandstone and 7 mudstone. Fig.1 is the map of geological and sampling point distribution of study area.
Beforing testing, rock samples were processed into cylinders with a height of 4 cm and a diameter of 3 cm. We used ASD (Analystical Spectral Devices) in the United States to determine the spectral reflectance of all rock samples at the band of 350~2 500 nm. Reflectance of single sample was measured three times and averaged, and the reflectance was resampled at 10 nm. We measured magnetic susceptibility of different faces of rocks by Czech SM-30 susceptibility instrument for three times, and the results were averaged. At the same time, the density and porosity of rocks were measured by the DM-2 rock densitometer. We used YDC-Ⅱ domestic resistivity meters to measure the resistivity of rock samples.The measurement of metal elements such as Fe, Mn, Pb and Ti, et al was carried out using the DELTA series XRF analyzer. The actual measured values of the metal elements of rock samples are shown in Table 1.
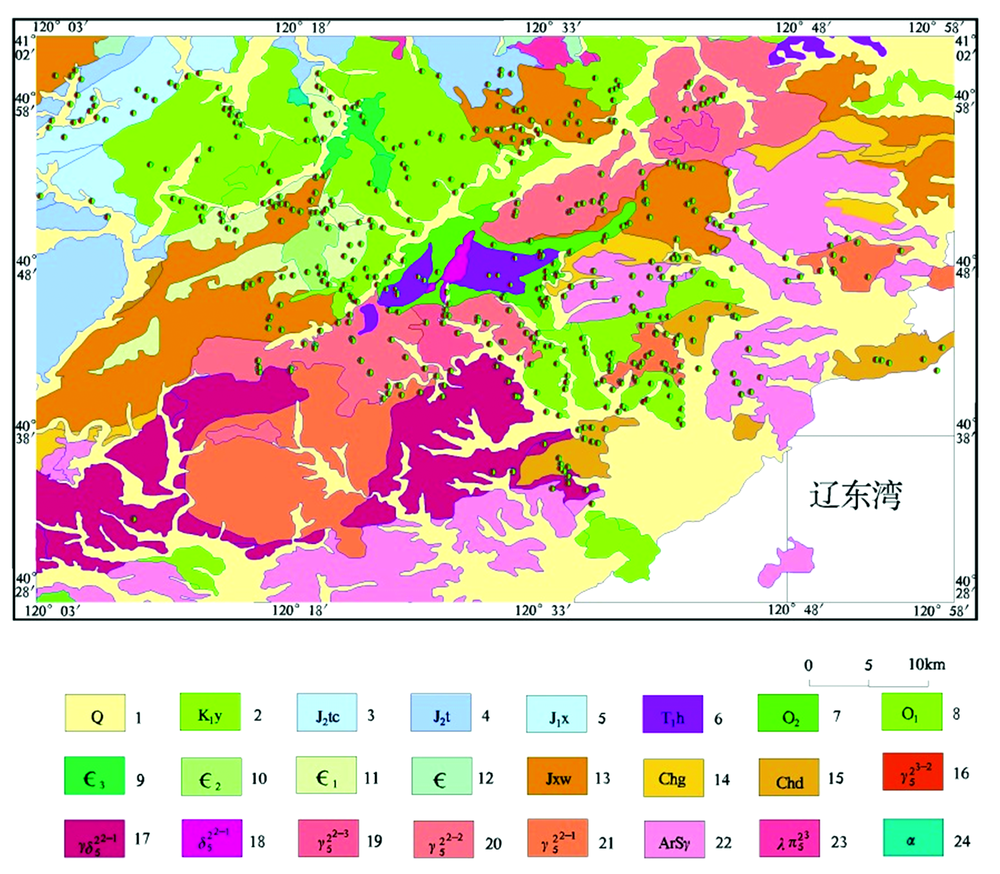 | Fig.1 Geological map and sampling point distribution in the study area Note: 1: Quaternary system: gravel, loess, silty clay, gravel layer; 2: Yixian Formation: Andesite, andesite agglomerate, Volcanic breccia, etc; 3: Uptown subgroups: Andesite sandstone, tuffaceous siltstone; 4: Tiaojishan group:basalt, andesite, Lava breccia; 5: Xinglonggou group: basalt, Andesite Clamp the lava brecciaand conglomerate; 6: Hongla group: Coarse grained sandstone in purple, siltstone, uff sandstone; 7: Majiagou group: upper part is medium-thick limestone, lower part is dolomitic limestone; 8: Thin and medium-thick limestone; 9: Thin-bedded limestone, oolitic limestone, wormkalk; 10: Medium thick-thick layer of oolitic crystal limestone clip purple gray siltstone; 11: Dolomitic limestone, brecciated limestone and banded limestone; 12: Cambrian is not divided; 13: Miwushan group: Flint zebra dolomite, striped dolomite; 14: Gaoyuzhuang group: Flint zebra dolomite, folium dolomite; 15: Dahongyu group: quartz sandstone, Feldspar quartz sandstone, arkose; 16: Late Jurassic biotite granite; 17: Granodiorite; 18: Diorite; 19: Fine-grained granite; 20: Red Granite; 21: Middle Jurassic biotite granite; 22: Gneissic granite; 23: Rhyolitic porphyry; 24: Andesite veins |
| Table 1 Sample record table (average value) |
Correlation coefficient describes the degree of closeness between two variables, which is generally represented by r. The value of r is between -1 and +1, and the closer the value is to -1 and 1, the closer the relationship is. The correlation coefficient accurately reflects the linear correlation between two variables in a numerical way, to infer the overall situation. Depending on different types of variables, different correlation coefficients are selected for calculation. Correlation coefficients are mainly divided into Pearson simple correlation coefficient, Spearman grade correlation coefficient and Kendallτ correlation coefficient[10].
Calculating the correlation coefficient of two things can determine the strength of correlation. The higher the correlation coefficient is, the stronger the correlation is. While, correlations between variables are complex and can be influenced by other things, which makes it impossible to accurately reflect the degree of correlation between variables. Generally, the simple correlation coefficient is not pure correlation.
Partial correlation analysis is also called net correlation, which more accurately analyzes correlations between two variables by controlling the effects of other variables. The method of measuring the correlation is to calculate the partial correlation coefficient. Partial correlation analysis can accurately find implied correlations from interferential variables.The process of calculating partial coefficients fos analysis is as follows[11, 12].
(1) Reflect the strength of the net correlation between two variables.
Calculating the partial correlation coefficient of two variables reflects the net correlation. The larger value of correlation coefficient is, the stronger net correlation is, and vice versa.
When calculating the partial correlation between variable … and y, the linear relation should be controlled. Then, the first-order partial correlation between … and y is defined as:
In the formula, ry1, ry2 and r12 respectively represent the correlation coefficient between y and x1, the correlation coefficient between y and x2, and the correlation coefficient between x1 and x2. The value range of partial correlation coefficient is consistent with that of correlation coefficient.
(2) Put null hypothesis. There is no significant difference between zero and partial correlation of the partial correlation of the two populations.
(3) Construct inspection statistics. In partial correlation analysis, the statistic is T and is defined as
R is the partial correlation coefficient, q is the order, and n is the number of samples.
(4) Calculate the observed value of test statistics and the corresponding probability value p.
(5) If the probability value is less than the given significance level α , then the original hypothesis should be rejected, indicating that two variables are partially correlated. On the contrary, if the probability value p is greater than the given significance level, the original hypothesis should be accepted, indicating that partial correlation coefficients of the two variables are not significant with zero.
The continuous removed method is a common method for analyzing absorption and reflection characteristics of ground objects.The envelope curve is defined as the maximum values of straight line on a spectral curve, and the external angle of the line is greater than 180 degrees. The envelope is equivalent to the shell of spectra.The de-envelope of spectra is the value on the original spectral curve divided by the value on the envelope curve. After spectra are removed, the reflectance of each point of the new spectral curve is ρ (λ ), the absorption depth is, and λ is the wavelength[13].
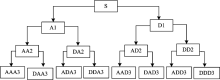
Wavelet packet analysis can provide a more precise analysis method for signals, which divides the frequency band into different levels and further decomposes high frequency parts without subdivision of multi-resolution analysis. According to the characteristics of analyzed signals, corresponding frequency bands are adapted to match signal spectra, so as to improve the time-frequency resolution. Fig. 2 is a three-layer wavelet packet decomposition tree diagram.
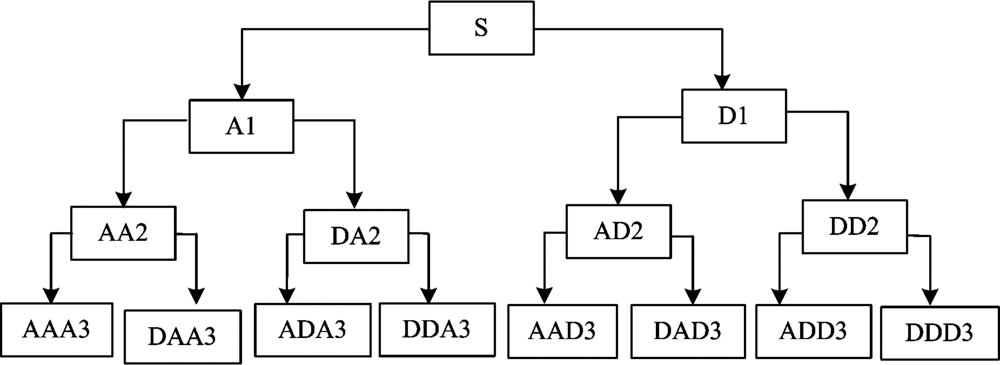 | Fig.2 Three-layer wavelet packet decomposition tree |
In the figure, S represents the original signal, A represents the low frequency part of signals, and D represents the high frequency part of signals.
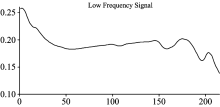
In this paper, original spectral curves were decomposed by Three Layers of Wave packet using the Db5 Wavelet Function, and we obtained the high-frequency and low-frequency parts of the spectral curve, which effectively separated the approximate features and details of the spectral curve.
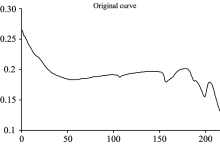
 | Fig.3 Original spectral curve |
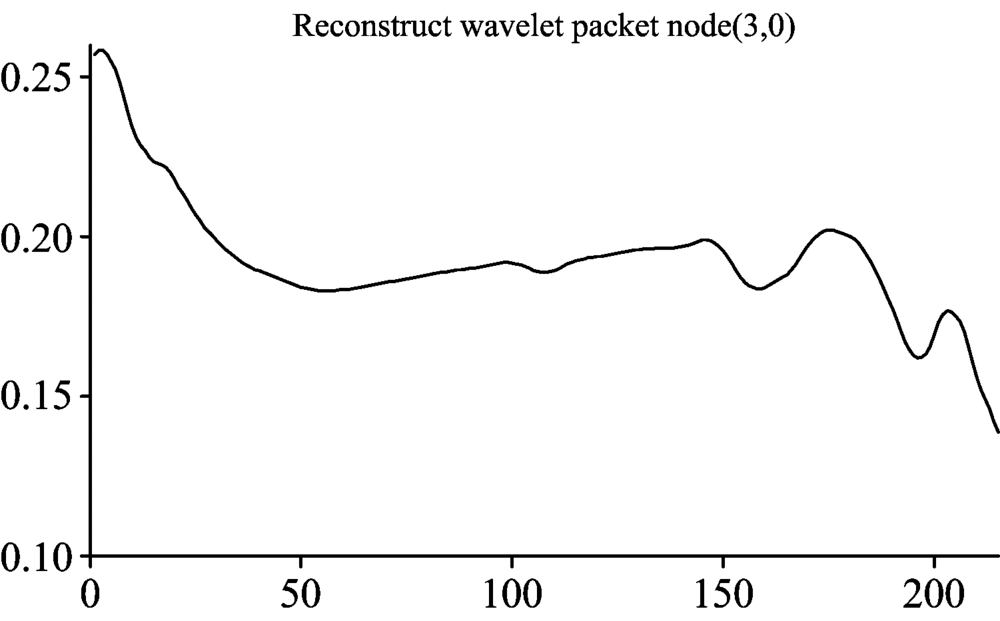 | Fig.4 Wavelet packet decomposition node(3, 0) |
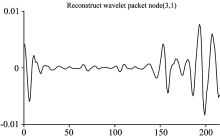
 | Fig.5 Wavelet packet decomposition node(3, 1) |
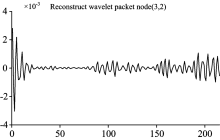
 | Fig.6 Wavelet packet decomposition node(3, 2) |
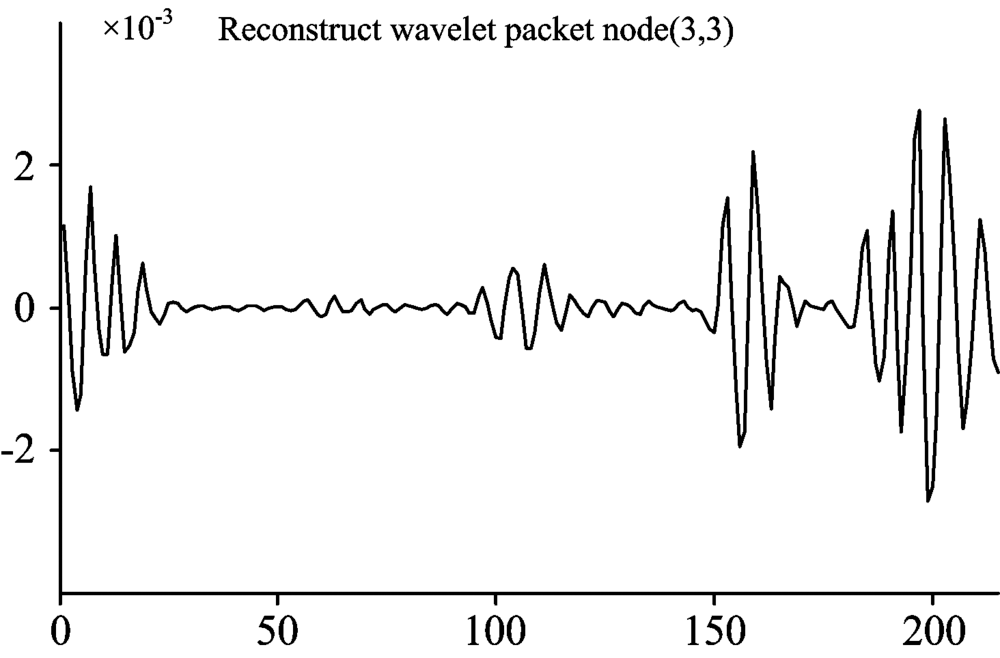 | Fig.7 Wavelet packet decomposition node(3, 3) |
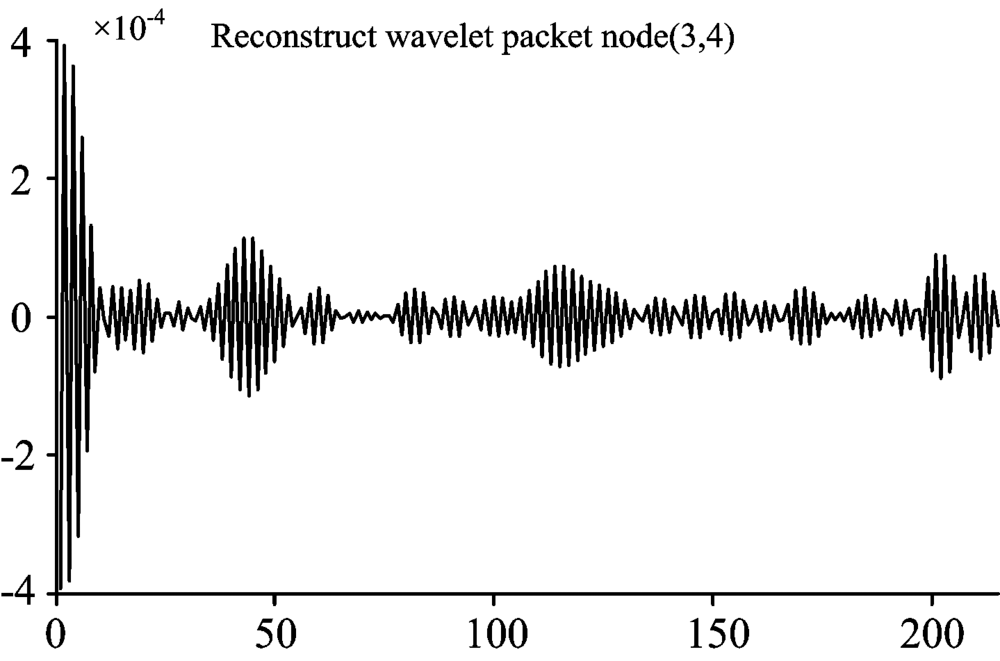 | Fig.8 Wavelet packet decomposition node(3, 4) |
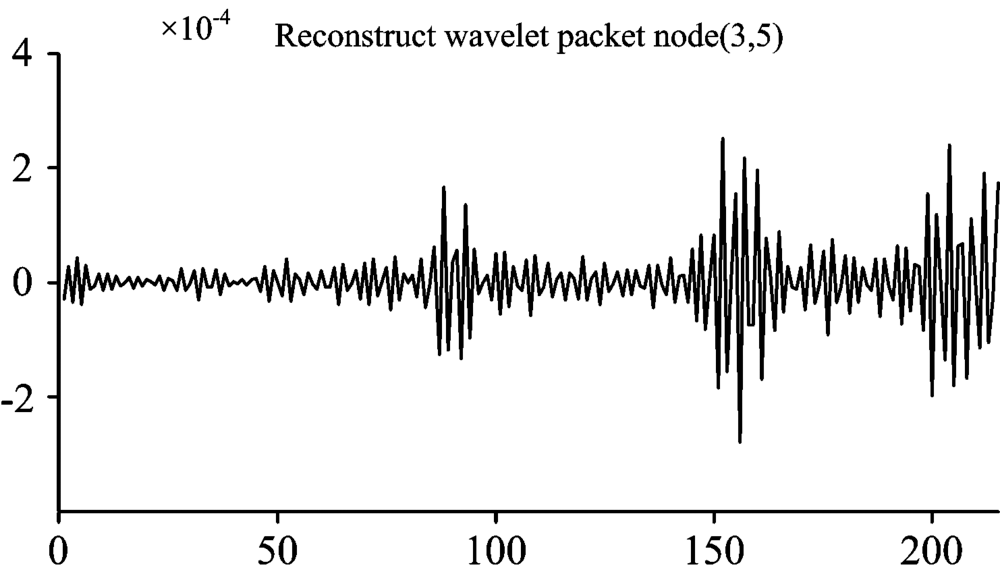 | Fig.9 Wavelet packet decomposition node(3, 5) |
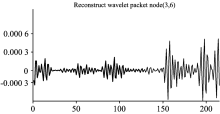
 | Fig.10 Wavelet packet decomposition node(3, 6) |
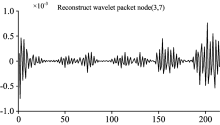
 | Fig.11 Wavelet packet decomposition node(3, 7) |
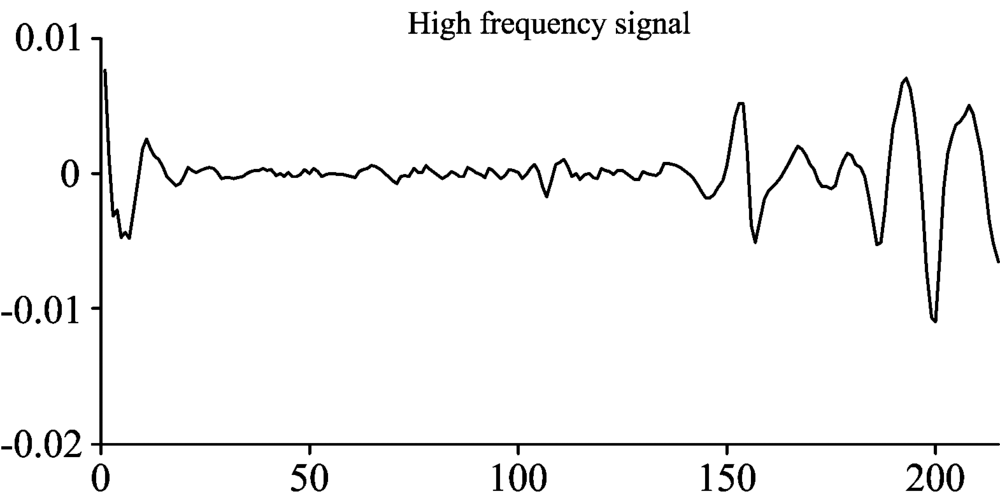 | Fig.12 Original spectrum high frequency signal |
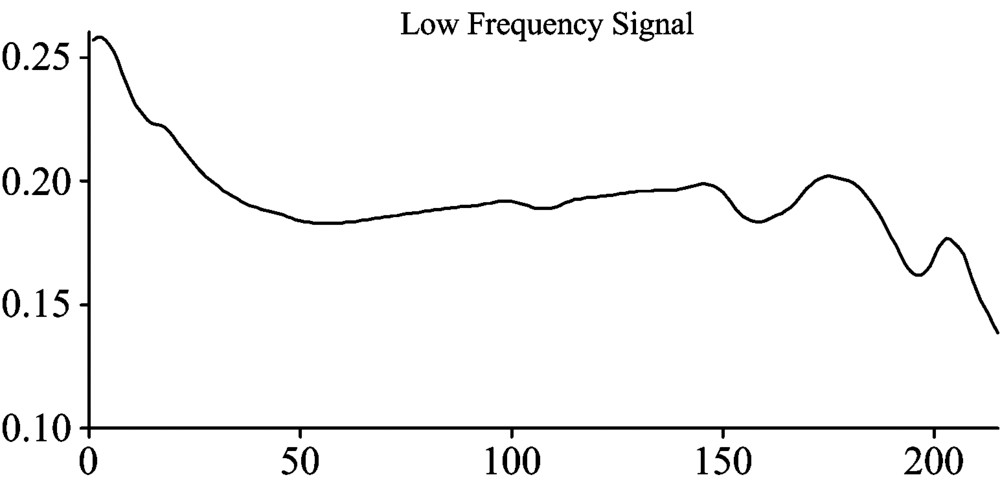 | Fig.13 Original spectrum low frequency signal |
Taking a spectral curve as an example, the following wavelet packet analysis results are obtained after decomposition and reconstruction of three-layer wavelet packets.
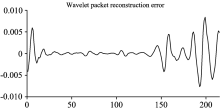
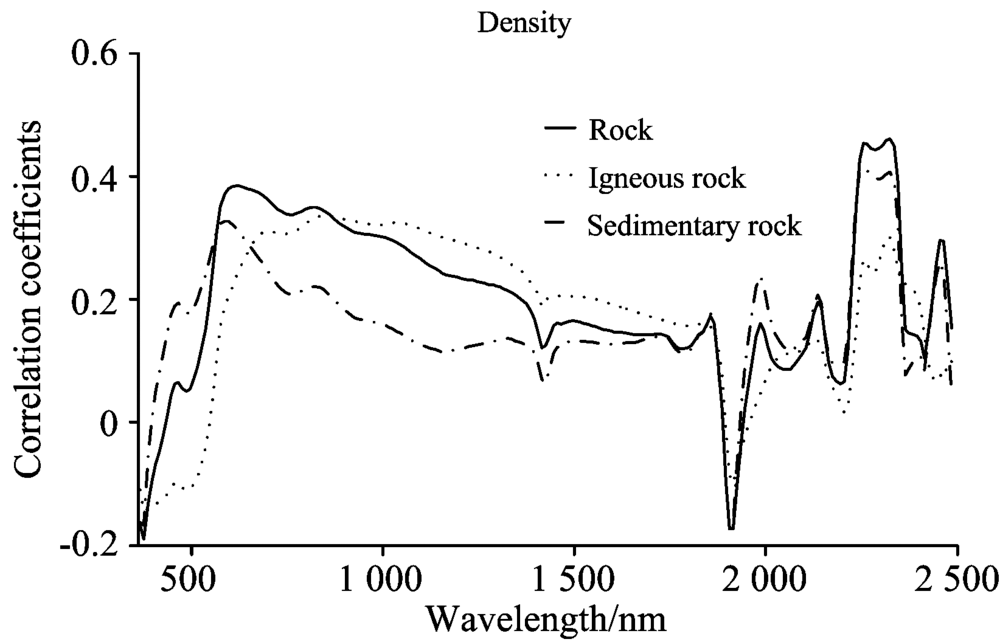
The correlation coefficients between density and spectral reflectance, absorption depth and high and low frequency after wavelet packet decomposition are respectively shown in Fig.14— Fig.16.
 | Fig.14 Wavelet packet reconstruction error |
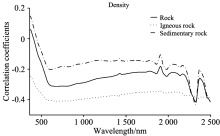
 | Fig.15 Correlation coefficient between density and reflectance |
 | Fig.16 Correlation coefficient between density and absorption depth |
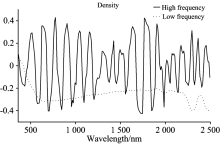
The relationship between density and spectrum is more significant in the range of 0.57~0.85 μ m, and density is negatively correlated with spectral reflectance. Correlation coefficients of igneous rocks are up to -0.41 at 0.63 μ m band, and the density is positively correlated with spectral absorption depth, indicating that densities have effect on spectral absorption in this range. The high frequency of spectral wavelet packet and density have large negative correlation coefficients near 0.57, 0.71, 0.85 μ m bands. The highest correlation coefficient is 0.43, which better confirms the influence of density on spectral absorption in this range.
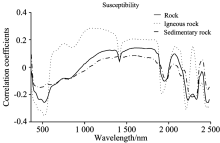
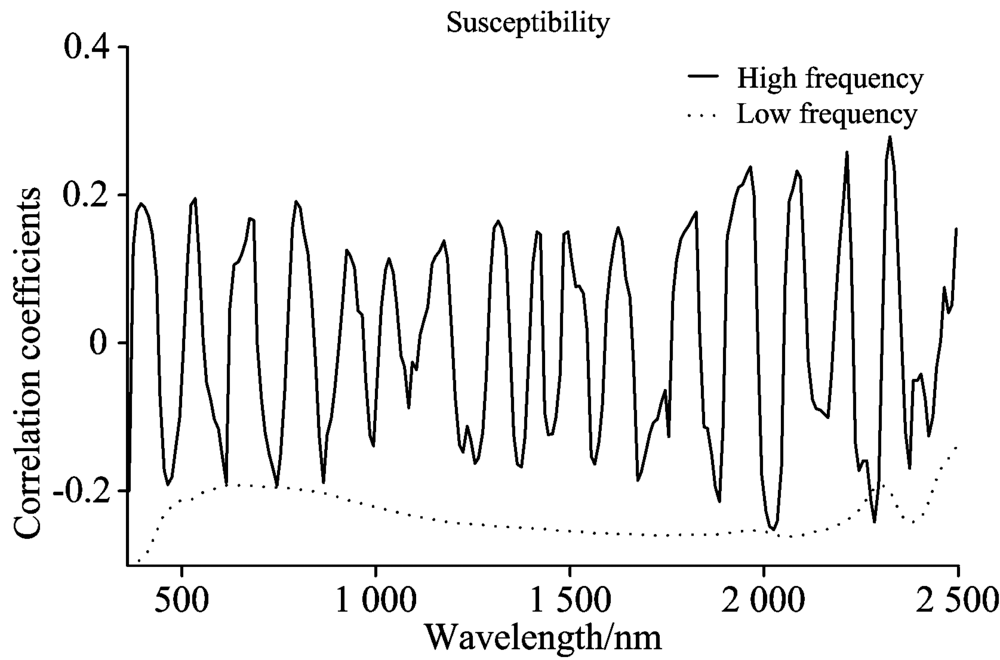
The Fig.17— Fig.19 show the correlation between susceptibility and spectral absorption depth, spectral high and low frequencies. As we can see from the figure, the susceptibility has negative correlations with spectral reflectance, in which the correlation between susceptibility and spectra of igneous rocks is higher, confirming that contents of susceptibility of igneous rocks are higher.
 | Fig.17 Correlation coefficient between density and high and low frequency |
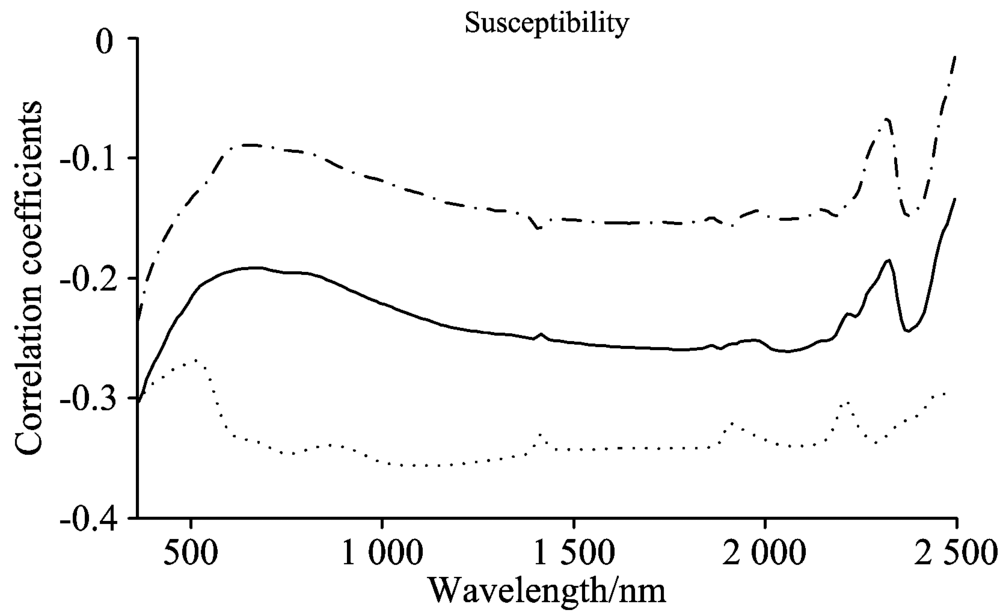 | Fig.18 Correlation coefficient between susceptibility and reflectance |
 | Fig.19 Correlation coefficient between susceptibility and absorption depth |
Near 0.53 μ m band, the susceptibility is significantly negatively correlated with absorption depth, and the correlation coefficient is up to -0.36. The susceptibility has a large positive correlation coefficient with spectral high frequency, and the correlation coefficient reaches +0.2, which illustrates that susceptibilities have effect on spectral reflectance in this band.
In the vicinity of the 1.08 μ m band, susceptibilities of igneous rocks are negatively correlated with spectral reflectance, with a correlation coefficient of -0.36. The susceptibilities of igneous rocks are significantly positively correlated with absorption depth with the correlation coefficient +0.29, which is a good indication that the density plays a role in spectral absorption of igneous rocks near this band.
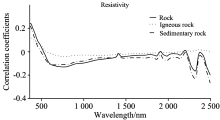
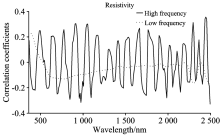
Fig.20— Fig.22 respectively show the correlation between the resistivity and spectral reflectance, absorption depth, high and low spectral frequencies. As can be seen from the figure, the correlation coefficient between resistivity and spectrum is very similar to that between density and spectrum, which also confirms the close relationship between density and resistivity of rocks. The correlation between resistivity and spectrum of sedimentary rocks is more significant, and the variation of correlation coefficient is greater, which exactly confirms that the resistivity of sedimentary rocks is larger.
 | Fig.20 Correlation coefficient between susceptibility and high and low frequency |
 | Fig.21 Correlation coefficient between resistivity and reflectance |
 | Fig.22 Correlation coefficient between resistivity and absorption depth |
In the range of 0.6~0.7 μ m, the resistivity and spectral absorption depth have positive correlation. At 0.62 μ m band, the correlation coefficient is up to 0.47, meaning the negative correlation between resisitivity and spectral reflectance. The resistivity of sedimentary rocks is higher, and the correlation of sedimentary rocks is more significant. The resistivity and high spectral frequency have a large negative correlation coefficient at 0.6 and 0.69 μ m, with the biggest value of -0.25, which is a good illustration that the resistivity has influence on spectral absorption in the range of 0.6~0.7 μ m.
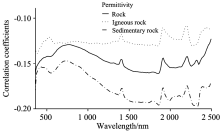
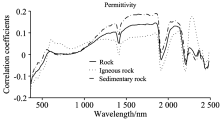
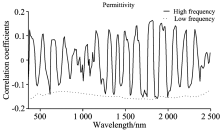
The relationships between permittivity and spectral reflectance, absorption depth, spectral high and low frequency are shown in Fig.23— Fig.25. It can be seen from the figure that the correlations between permittivities and spectra of sedimentary rocks are more significant and changes are more volatile, confirming that the permittivity constant of sedimentary rocks is higher.
 | Fig.23 Correlation coefficient between resistivity and high and low frequency |
 | Fig.24 Correlation coefficient between permittivity and reflectance |
 | Fig.25 Correlation coefficient between permittivity and absorption depth |
Near the 1.85 μ m band, the permittivity and spectral reflectance have negative correlations with the correlation coefficient reaching -0.2. The permittivity has a positive correlation with spectral absorption depth, and the correlation coefficient is up to +0.19. In this band, the permittivity and high frequency have negative correlations with the value of -0.16, which indicates that the permittivity has influence on spectral absorption, in which the influence of sedimentary rocks is more significant.
We respectively analyze the correlation and partial correlation on t densities, susceptibilities, resistivities and permittivities of 590 rocks.The results are shown in Table 2 and Table 3.
| Table 2 Partial correlation coefficient between geophysical parameters |
| Table 3 Correlation coefficient between geophysical parameters |
It can be seen from partial correlation coefficients and correlation coefficients that the density has positive correlation with the resistivity, with the correlation coefficient reaching +0.41, which also proves that the relationship between density and spectra is similar to that between resistivity and spectra. In natural state, water contents and salt concentration of aqueous solution are the main factors affecting rocks’ electrical conductivity. The higher the densities are, the smaller the porosities are, the worse conductivities of rocks are, and the higher resistivities values are, which is a good explanation of the positive correlation between density and resistivity.
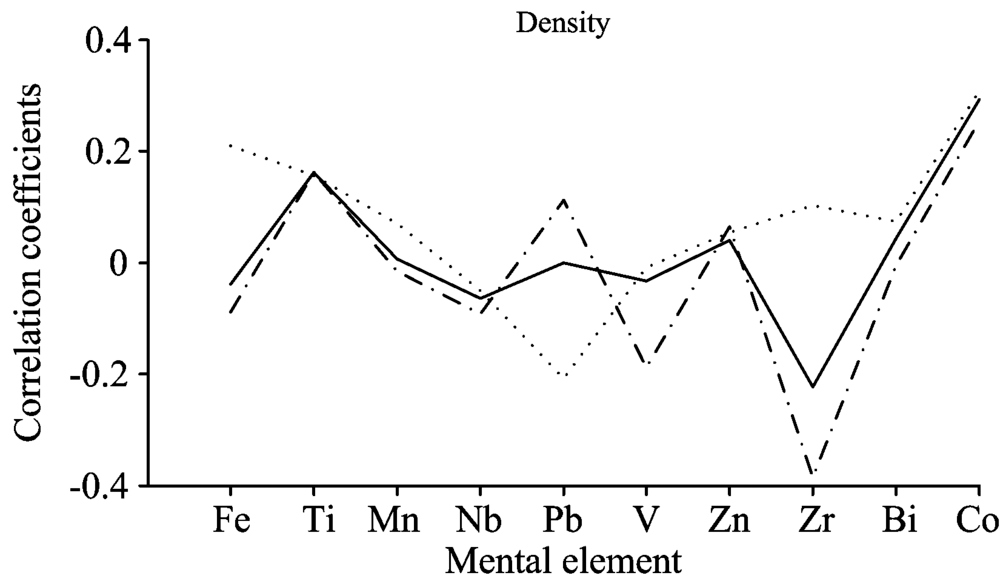
Fig.26 shows correlation coefficients between densities and each metal elements. As we can see from the figure, correlations between densities and metal elements of rocks are poor. Meanwhile, the density is positively correlated with Ti and Co, with the correlation coefficients of +0.16 and +0.3. The densities are negatively correlated with V with the correlation coefficient of sedimentary rocks reaching -0.39. Correlations between metal elements and densities of rocks are not significant, but the characteristic relationship between them cannot be ignored. Using the change of densities can qualitatively and semi-quantitatively infer contents and changes of geochemical elements.
 | Fig.26 Correlation coefficient between permittivity and high and low frequency |
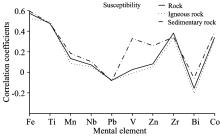
The correlation coefficients between susceptibilities and each metal element are shown in Fig.27. The susceptibility is well correlated with metal elements, where the susceptibility is positively correlated with Fe and Ti, with correlation coefficients of +0.57 and +0.47. On the one hand, that confirms the significant positive correlation between Fe and Ti, as well as the effect of Fe-containing and Ti-containing minerals on magnetism of rocks, such as the vanadium-titanium magnetite deposit in Panzhihua, Sichuan, China. On the other hand, it also shows that the magnetic minerals containing of Fe affect susceptibilities of rocks. The reduction of ferromagnetic minerals in magma splitting also indicates the decrease of susceptibilities of rocks.Therefore, we can use susceptibilities of rocks to study the magma separation and formation process.
 | Fig.27 Correlation coefficient between density and chemical elements |
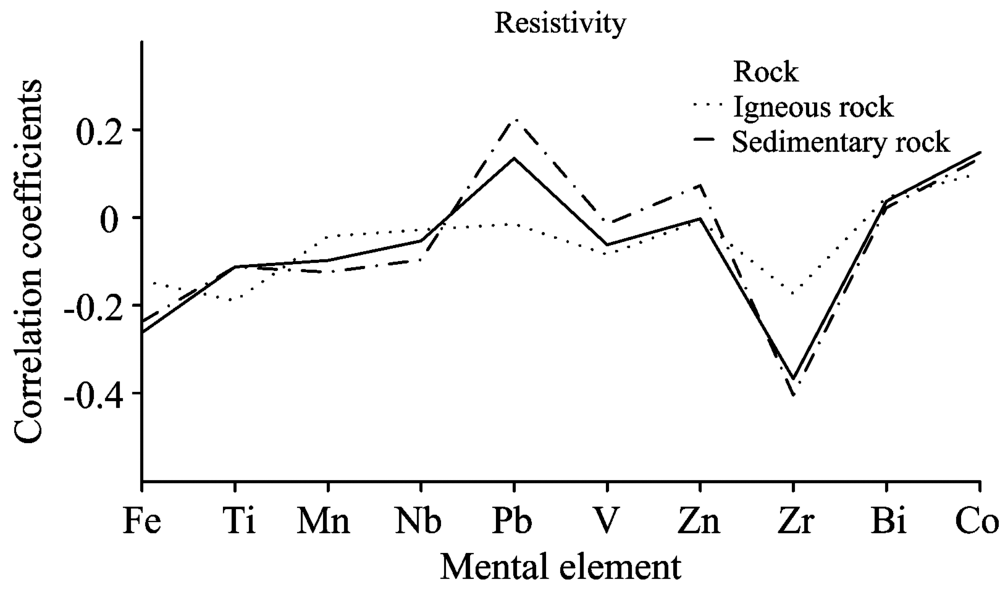
The correlation coefficients between resistivities and each metal element were shown in Fig.28. It can be seen that the relationship between rock resistivity and metal elements is relatively weak, which is due to its close relationship with the characteristics of mineral crystal particles. When conductive mineral contents of rocks are more than 80%, the resistivities will play a significant role. Therefore, the relationship between the content of each metal element and the resistivity is weak.
 | Fig.28 Correlation coefficient between susceptibility and chemical elements |
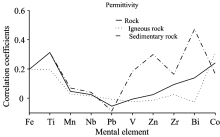
The correlation coefficient between the permittivity and each metal element is shown in Fig.29. The content of metal elements is positively correlated with the permittivity, which shows the increased ability of rocks to separate charges in electric fields with the increase of the content of positively correlated metal elements. And the correlation of sedimentary rocks is more significant. Fe, Bi, Co, Zn have a weak positive correlation with permittivity, and Ti has a significant positive correlation with permittivity with the correlation coefficient reaching +0.31. Meanwhile, there are significant positive correlations between the V, Zn and Bi and permittivities of sedimentary rocks. The correlation coefficient between Bi and permittivitiies of sedimentary rocks reaches +0.47. That well illustrates the relationship between physical properties and chemical element contents of rocks, and there are also great differences in the dependence of physical properties on chemical elements.
 | Fig.29 Correlation coefficient between resistivity and chemical elements |
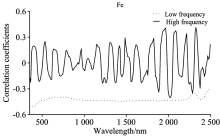
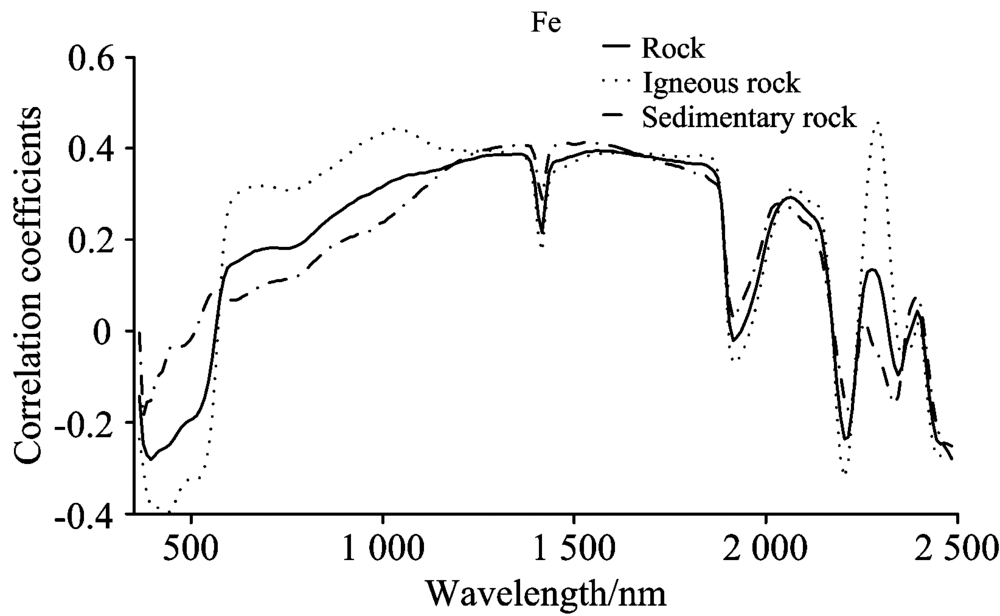
Fig.30 and Fig.31 respectively show correlations between the Fe element and absorption depth, high and low frequency of rocks. Compared with other elements, the correlation between Fe element and spectra is more significant.
There are negative correlations between Fe and absorption depth in the range of 0.4~0.54 μ m, and the correlation of igneous rocks is more significant, which indicates that Fe element make spectra show good reflection characteristics in this range. At 0.4 μ m band, Fe has negative correlations with absorption depth with the correlation coefficient reaching -0.282, and Fe has large positive correlation coefficients with high frequency +0.2, which is a good indication that the 0.4μ m band is the characteristic reflection band of Fe.
 | Fig.30 Correlation coefficient between permittivity and chemical elements |
 | Fig.31 Correlation coefficient between Fe and absorption depth |
At 0.54 μ m, Fe elements and the high frequencies have large positive correlation coefficient of +0.25, indicating that the Fe element has strong reflection of spectrum near this band. In the range of 1.0~1.15 μ m, there are positive correlation between Fe element and spectral absorption depth of igneous rocks, with the correlation coefficient up to +0.443, indicating that the Fe element makes spectra strongly absorbed in this range.
In the range of 1.7~1.8 μ m, Fe elements have significant positive correlations with spectral absorption depth of igneous and sedimentary rocks, and the difference of correlation coefficients between the two is not distinct. Fe element content is negatively correlated with the high frequency of spectra, which indicates Fe has effects on absorption of spectra in this range.
The correlations between absorption depth, high and low frequency of rocks and Ti element are shown in in Fig.32 and Fig.33. The correlation between Ti element and absorption depth is similar to that between Fe and absorption depth, which is a good evidence of a strong positive correlation between Fe and Ti elements.
 | Fig.32 Correlation coefficient between Fe and high and low frequency |
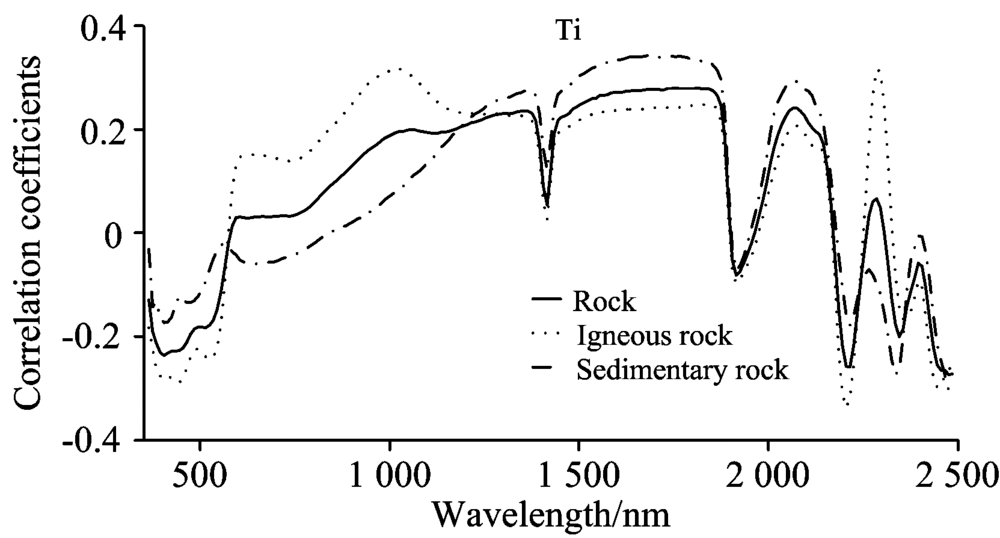 | Fig.33 Correlation coefficient between Ti and absorption depth |
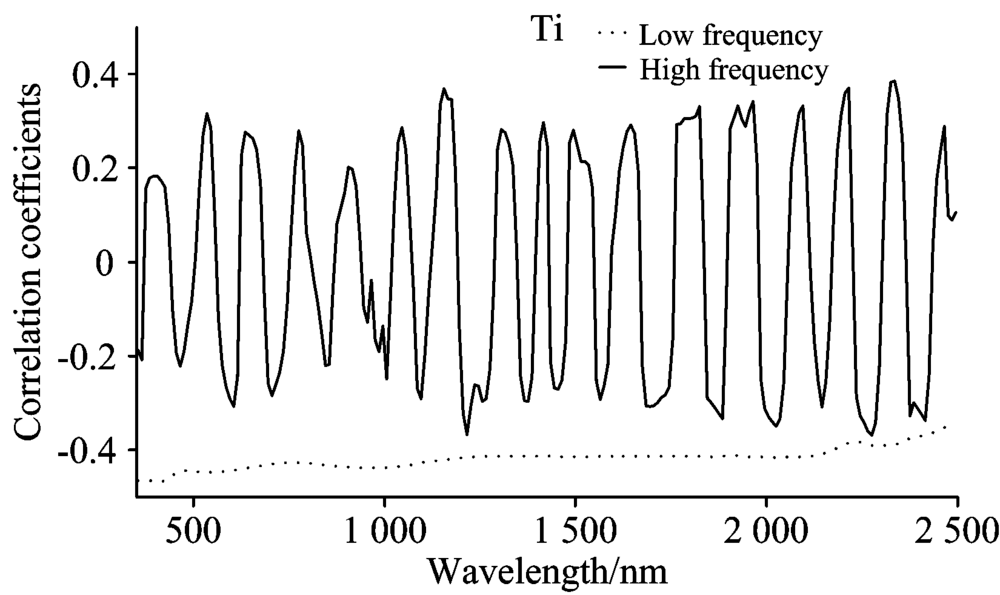 | Fig.34 Correlation coefficient between Ti and high and low frequency |
In the range of 0.4~0.55 μ m, Ti elements have negative correlations with spectral absorption depth, and correlations of igneous rocks are more significant than those of sedimentary rocks, which proves that element contents of Ti of igneous rocks are higher than those of sedimentary rocks. At 0.55 μ m, Ti is negatively correlated with absorption depth and positively correlated with high frequency of spectrum with a correlation coefficient of +0.32, indicating that Ti has effects on spectral reflection near this band.
In the range of 0.6~0.65 μ m, there are positive correlations between Ti elements and absorption depth of igneous rocks, and negative correlations between that of sedimentary rocks, which shows that Ti makes spectra of igneous rocks have good absorption characteristics and makes spectra of sedimentary rocks have good reflection. At 0.6 μ m, Ti has negative correlation with high frequency, and the correlation coefficient is up to -0.31. At 0.64 μ m, Ti has positive correlation with high frequency, and the correlation coefficient is up to +0.27. That is a good illustration of characteristic bands of Ti near 0.6 and 0.64 μ m bands.
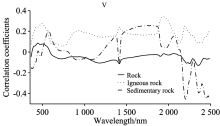
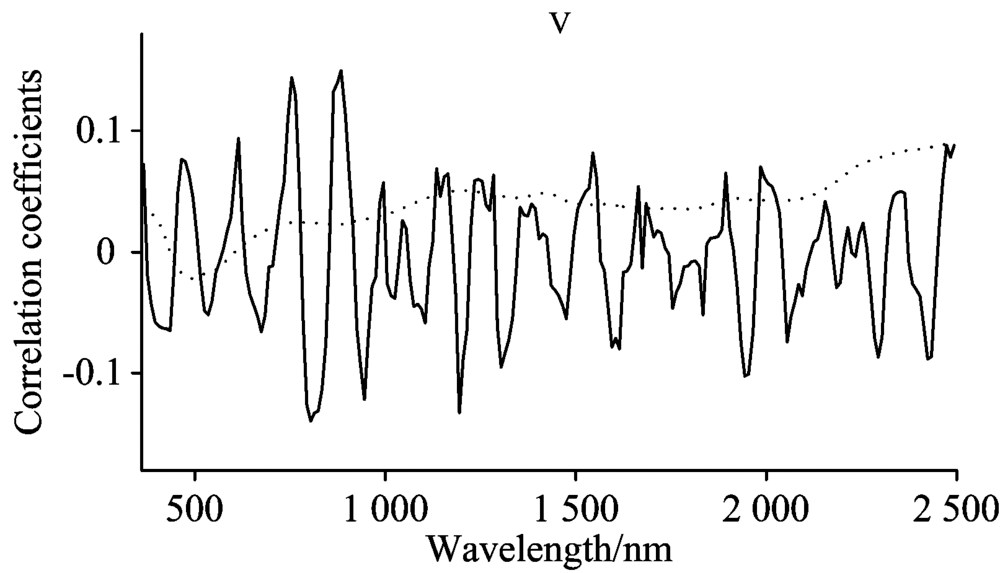
The correlations between V elements and absorption depth, high and low frequencies of rocks are shown in Figs.34 and 35. On the whole, the correlations between V and absorption depth are weak. While the correlations are more prominent and different when rocks are classified into igneous and sedimentary rocks.
In the range of 0.44~0.49 μ m, the V element has positive correlations with spectral absorption depth of igneous rocks. Near 0.5 μ m band, there are positive correlation coefficients between V element and absorption depth of igneous rocks, which is up to +0.275, indicating that the V element has effects on spectral absorption of igneous rocks in this band. Near 0.58 μ m band, positive correlation coefficients between V elements and spectral absorption depth of sedimentary rocks are up to +0.21, indicating that V element has influence on spectral absorption of sedimentary rocks near this band.
In the range of 0.75~0.95 μ m, there are positive correlation coefficients between V element and spectral absorption depth of igneous rocks and negative correlation coefficients between that of sedimentary rocks, indicating that V element has effects on spectral absorption of igneous rocks and spectral reflection of sedimentary rocks.
In the vicinity of 1.94 μ m, the V element of igneous rocks is positively correlated with spectral absorption depth, and the correlation coefficient is up to +0.34. Therefore, there may be characteristic absorption bands of V element of igneous rocks near this band.
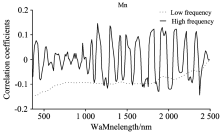
Fig.36 and Fig.37 respectively show correlations between Mn element and spectral absorption depth, high and low frequencies of rocks. It can be seen from the figure that correlation coefficients between spectra and Mn elements are similar to those between spectra and Fe and Ti elements, which can also indicates that Mn, Fe and Ti are positively correlated.
 | Fig.35 Correlation coefficient between V and absorption depth |
 | Fig.36 Correlation coefficient between V and high and low frequency |
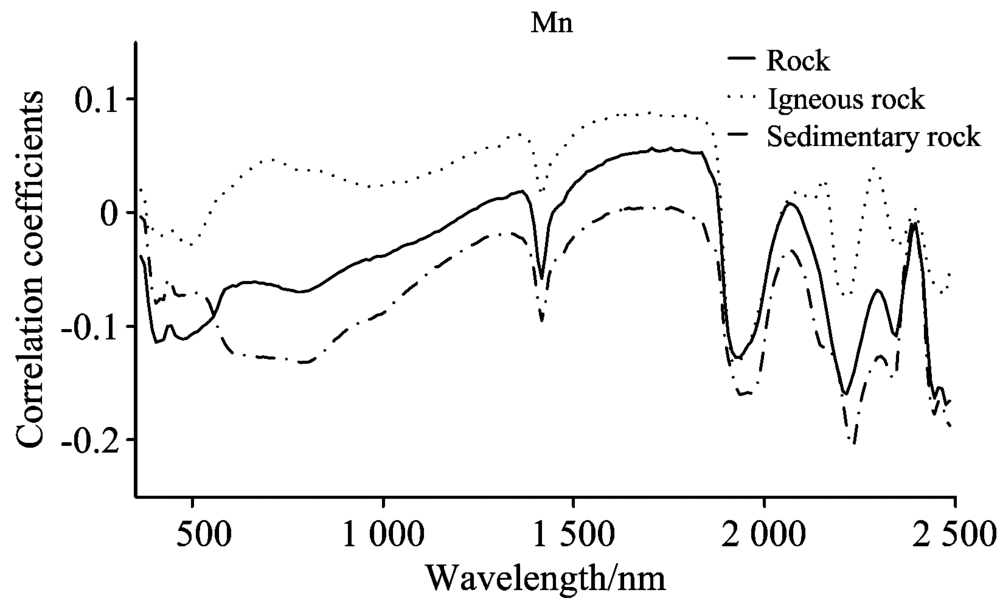 | Fig.37 Correlation coefficient between Mn and absorption depth |
 | Fig.38 Correlation coefficient between Mn and high and low frequency |
In the range of 0.4~0.48 μ m, Mn element has negative correlations with spectral absorption depth, indicating that Mn element has influence on spectral reflection in this wavelength range. The Mn element has positive correlations with high frequencies of spectra at 0.41 μ m band, indicating there are characteristic reflection bands of Mn near this band.
Near 1.93 μ m band, Mn element has negative correlation with spectral absorption depth. The correlations of sedimentary rocks are more significant with the correlation coefficient reaching -0.16. And Mn is positively correlated with high frequencies of spectra, and the correlation coefficient is +0.13. In the vicinity of the 2.22 μ m band, Mn element has negative correlation coefficients with absorption depth with the value reaching -0.2, and positive correlation coefficients with high frequency with the value reaching +0.11. That all well indicate that it is likely to exist feature reflection bands of Mn elements near 1.93 and 2.22 μ m bands.
(1)In the study of the relationship between physical properties and spectra of rocks, the correlation between density and spectra is more significant. What’ s more, the density has good absorption characteristics for spectra in the range of 0.57~0.85 μ m; the susceptibility makes spectra have a strong reflection near 0.53 μ m band. In the vicinity of the 1.08 μ m band, the susceptibility makes spectra have strong absorption, in which the susceptibility of igneous rocks has more obvious absorption effect on spectra. In the range of 0.6~0.77 μ m and near 2.32 μ m band, the resistivity has effects on spectral absorption. The values of resistivities of sedimentary rocks are higher than those of igneous rocks, and absorption characteristics are more obvious. Near 1.85 μ m band, the permittivity makes spectra produce stronger absorption characteristics, especially in sedimentary rocks.
(2) The density is positively correlated with resistivity of rocks. The higher densities are, the smaller porosities are, the worse conductivities of rocks are and the higher resistivities are, which is a good explanation of positive correlations between density and resistivity.
(3) The susceptibility is well correlated with each metal element, and is significantly positively correlated with Fe and Ti, indicating that magnetic minerals containing Fe affect the susceptibility of rocks.
(4) There are characteristic reflection bands of Fe near 0.4 and 0.54 μ m bands. Fe element makes spectra have strong reflection characteristics in the range of 0.4~0.54 μ m, and strong absorption characteristics at 1.0~1.1 μ m range. In 0.4~0.55, 0.6~0.65 μ m bands, correlations between Ti elements and spectra are more significant. And there are characteristic reflection bands of Ti near 0.55 μ m band. In the range of 0.4~0.48 μ m, Mn element has effects on spectral reflection, and a characteristic reflection band of Mn exists near 0.41 μ m band. The correlations between V element and of igneous rocks and those of sedimentary rocks are quite different. In the range of 0.75~0.95 μ m, V element makes spectra of igneous rocks have good absorption and, makes spectra of sedimentary rocks have good reflection. Moreover, characteristic bands of V element are most likely to exist near the 0.76, 0.81, 0.89, and 0.95 μ m bands.
This paper studies the relationship between geophysical parameters, elements and spectra of igneous rocks and sedimentary rocks, which can be used to contact for lithology classification and inverse certain physical parameters and chemical elements.
| [1] |
|
| [2] |
|
| [3] |
|
| [4] |
|
| [5] |
|
| [6] |
|
| [7] |
|
| [8] |
|
| [9] |
|
| [10] |
|
| [11] |
|
| [12] |
|
| [13] |
|
| [14] |
|