

饱和激发下叶绿素荧光非线性变化及影响分析
[李晓龙1  , 贺岩
, 贺岩2 , 陈卫标2 , 姜静波1 , 刘庆奎1 , 陈永华1, * ]
, 贺岩]
|
|


作者简介: 李晓龙, 1985年生, 中国科学院海洋研究所高级工程师 e-mail: lixiaolong@qdio.ac.cn
叶绿素浓度是海洋初级生产力的重要指标之一, 激光诱导荧光技术可以实现海水叶绿素浓度的快速测量。 测量叶绿素浓度的传统激光诱导荧光原理, 是利用叶绿素荧光与水体Raman散射的强度比值( IF/ R)进行反演, 即叶绿素浓度 nchl= CIF/ R, 其中 C为系统常量。 这是依据叶绿素荧光685 nm、 水体Raman散射强度都与激发光强呈线性关系。 然而, 该理论并没有考虑诱导荧光饱和现象的存在。 当诱导激光强度达到一定程度后, 685 nm荧光强度随激发光强非线性变化。 另外, 值得注意的是, 水体Raman散射并不存在信号饱和现象。 为了探讨饱和激发造成荧光非线性变化的影响, 在激光诱导荧光技术测量叶绿素浓度的实验中, 设计两种测量方案, 即: 不同激光功率诱导单一浓度样本的荧光测量, 和固定激光功率时不同浓度样本的荧光测量。 实验中利用Nd:YAG三倍频激光355 nm激发获得叶绿素溶液的404 nm处 Raman散射和685 nm荧光。 实验结果分为2部分进行讨论: (1)为了分析饱和激发造成荧光变化的非线性特性, 通过调节激发光功率测量溶液的受激发射光谱, 发现水体Raman散射强度与激发光强呈线性关系, 而685 nm荧光强度出现饱和激发下的非线性变化。 而且, 随叶绿素浓度的增加, 685 nm荧光的非线性趋势更为明显, Raman散射强度与激发光强的线性关系中斜率变小。 数据分析表明, 685 nm荧光数据拟合的4阶多项式和Raman散射效率值, 可以定性地表征685 nm荧光的饱和程度。 (2)考虑实际海洋激光雷达探测叶绿素浓度应用中存在饱和激发荧光非线性现象, 为了分析荧光非线性对传统叶绿素浓度反演理论适用性的影响, 在固定激发光强情况下对不同浓度叶绿素溶液的发射光谱进行测量。 将激发光功率调节至52.00, 80.70, 132.10和197.30 mW·cm-2, 获取相应激发光强下685 nm荧光与水体Raman散射的强度比值和叶绿素浓度之间的关系。 实验表明, 激发光强不变的情况下, 685 nm荧光与水体Raman散射的强度比值, 与叶绿素浓度仍满足线性关系。 但是, 在较高光强激发时, 饱和激发造成的叶绿素荧光非线性变化, 导致利用传统激光诱导荧光理论反演的叶绿素浓度值偏小。 因此, 需要对饱和激发下荧光非线性的影响进行修正, 其关系为 IF/ R= nchl/ C+ CF, 修正值 CF不可忽略。 另外, 值得一提的是, 修正关系中系统常量 C随激发光强增加而增大。 研究表明, 饱和激发造成的荧光非线性, 会对激光诱导荧光技术测量叶绿素浓度产生影响, 但由于造成荧光非线性因素的复杂性, 仅通过荧光数据拟合获得的多项式, 无法定量说明其影响权重。 然而, 当激发光强不变时, 可以实验测量获得基于激光诱导荧光原理的修正关系, 从而准确反演叶绿素浓度。
As one of the most important indicators for studying marine primary productivity, chlorophyll concentration in seawater can be quickly measured by laser-induced fluorescence (LIF) technology. In the traditional theory for obtaining chlorophyll concentration by LIF, the chlorophyll concentration nchl= CIF/ R, where IF and R are fluorescence intensity of chlorophyll a (Chl-a) at 685 nm and Raman scattering intensity of water respectively, and C is a system constant. Withoutconsidering induced fluorescence saturation, this theory is based on an assumption that both the fluorescence intensity at 685 nm and water Raman intensity are linear with the intensity of incident laser. However, experimentsconfirmed the existence of non-linear relationships between the induced fluorescence energy at 685 nm and laser energy. While the linear relationships between water Raman intensity and pulse intensity have always existed without saturation excitation. In order to explore the effect of non-linear fluorescence change under saturation excitation, two series of measurement were done in the experiments. Fluorescence of the solution with constant Chl-a concentration was measured by varied laser powers, and a constant laser power was used to obtain the solution fluorescence of varied Chl-a concentrations. The third harmonic of Nd:YAG laser at 355 nm was the excitation source. Thus, Raman scattering at 404 nm and fluorescence at 685 nm of Chl-a solutions were the key part of emission spectra. The experiment results were discussed in section 3. In the first part, the emission spectra of Chl-a solutions were measured by LIF with excitation light intensity variation. It shows a linear relationship between Raman scattering and excitation intensity, while fluorescence intensity at 685 nm appeared nonlinear change under saturated excitation. Moreover, fluorescence intensity of Chl-a solution with higher concentration increased to plateaus earlier, and the ratio of Raman scattering intensity to excitation intensity in the linear relationship decreased with Chl-a concentration. The data analysis shows that a polynomial of degree 4 fitting the changes of fluorescence intensity and the value of the Raman scattering efficiency can qualitatively characterize the saturation of fluorescence at 685 nm. Secondly, for the purpose of analyzing the effect of fluorescence nonlinearity on the applicability of traditional theory in chlorophyll concentration inversion, with considering the phenomenon of fluorescence saturation existing in the application of ocean Lidar for detecting chlorophyll concentration, the emission spectra of samples with different Chl-a concentrations were measured with a constant excitation intensity. The relationship between IF/ R and Chl-a concentration was obtained under the excitation power at 52.00, 80.70, 132.10 and 197.30 mW·cm-2. Experiments show that IF/ R is still in linear relationship with Chl-a concentration under the condition that the exciting radiation is not changed. But, the concentration from the traditional inversion theory by LIF is less than the real Chl-a concentration measured by a high excitation intensity which leads to fluorescence saturation effect. Therefore, the inversion module is necessary to be corrected with CF which is related to fluorescence nonlinearity under saturation excitation. A more accurate inversion is based on IF/ R= nchl/ C+ CF. And, it is worth mentioning that the system constant C in this correction module increases with the exciting intensity. Consequently, saturation excitation causesfluorescence nonlinearity and affects the measurement of Chl-a concentration by LIF technology. It is regrettable that the polynomial obtained by the fluorescence data fitting cannot quantify the impact of fluorescence saturation effect, due to the complexity of the nonlinear factors. However, when the excitation power is constant, a corrected inversion can be experimentally obtained and used to measure Chl-a concentration by LIF in field surveys.
叶绿素浓度是海洋初级生产力调查中不可或缺的部分[1]。 激光诱导荧光技术(LIF)已被广泛应用到海洋物质探测领域[2, 3, 4], 采用海洋激光雷达方式, 可高效地获取表层海水中叶绿素荧光信息, 以反演叶绿素浓度的空间分布[5]。
饱和激发情况下荧光的非线性特征, 是激光探测物质荧光的重要特性。 1988年Ivanov和Fadeev[6]对激光探测浮游植物时存在的荧光饱和效应进行了初步分析。 2013年李晓龙等[7]基于激光能量参量变化的三维油荧光光谱, 对“ 异类同谱” 的燃料油和原油进行分析, 辅助油种鉴别。 2017年Li等[8]初步分析了叶绿素荧光的非线性变化, 其非线性程度随叶绿素浓度增加而变强。 本文研究在此基础上, 进一步分析叶绿素浓度和激光功率密度与荧光非线性的关系, 目的探讨荧光饱和非线性效应影响下LIF技术探测叶绿素浓度的修正方法。
当激发光能量密度达到一定程度后, 受激发物质的荧光强度与激发光强呈现非线性变化趋势, 这就是物质荧光的饱和激发非线性现象[9]。
非饱和时荧光强度
其中, η 为物质的荧光转换效率。
随着激发光强增加, 受激荧光出现饱和现象
其中, β 为非线性因子, 它取决于物质本身的物理特性, IC为诱导荧光饱和的Ilaser。
传统理论中激光雷达反演海洋表层叶绿素浓度[10]
式中, IF为叶绿素荧光强度, R为海水Raman散射强度, C为系统常量。 方程(3)是以IF和都与Ilaser呈线性关系为前提, 而并未考虑饱和激发情况。
叶绿素荧光测量系统结构如图1, 主要包括激光器、 样本室、 光谱仪、 数据采集、 及光强控制系统五个部分。 激发源3倍频Nd: YAG激光脉宽7 ns, 样本室出射窗采用长波通滤光片, 截止波长360 nm。 荧光经由耦合透镜、 多模光纤进入Ocean Optics公司S2000光谱仪。 激光出射窗前, 使用355 nm部分反射镜将固定比例的激光能量反射并耦合进入多模光纤。 多模光纤采用分叉结构, 同时接收荧光和反射的激光信号。
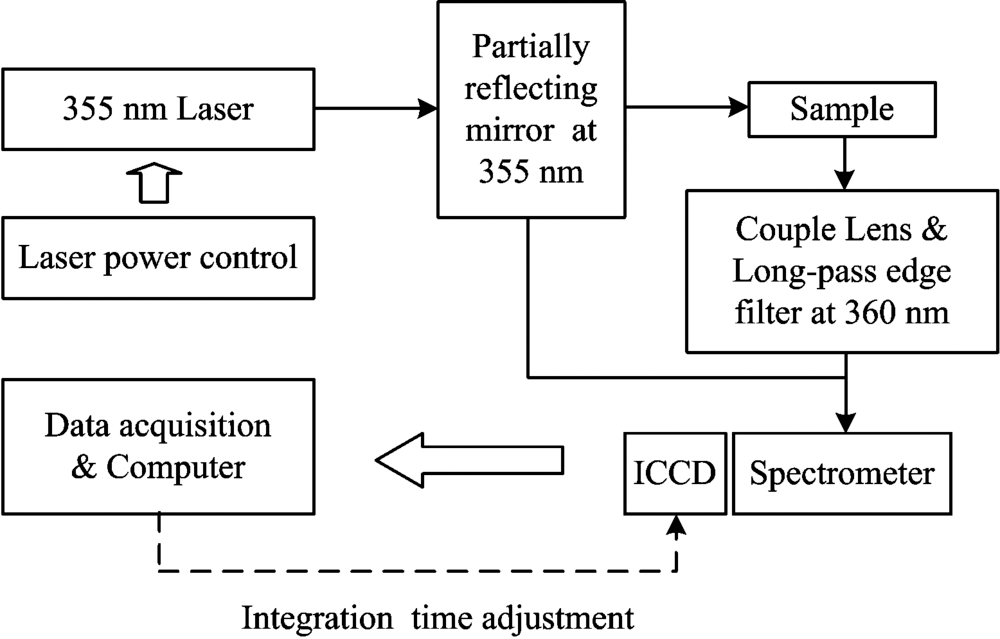 | 图1 饱和激发情况下叶绿素荧光测量的实验系统示意图Fig.1 The sketch of experiment system for measuring Chl-a concentration under laser induced saturation of fluorescence |
样本采用叶绿素a试剂的纯水溶液, 放入石英比色皿中进行荧光测量, 并考虑各类自然水体中叶绿素a浓度保持在μ g· L-1量级上, 最终配成的样本浓度为20.25, 40.50, 81.00, 162.00和324.00 μ g· L-1。 实验采用两种测量方式, 即单一样本在不同激光功率诱导下的荧光测量, 和固定激光功率时不同浓度样本的荧光测量。
纯水本身不产生荧光, 数据分析时提取激光、 Raman和685 nm处峰值, 并舍去Raman散射或叶绿素荧光峰值波长明显变化的数据。
为了分析荧光饱和的非线性特点, 首先分析样本Raman散射和荧光的变化, 进一步针对LIF技术测量叶绿素浓度的应用, 分析强激光探测的影响。
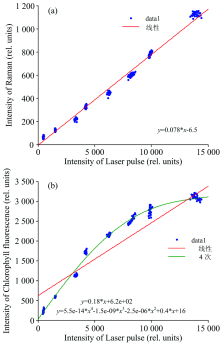
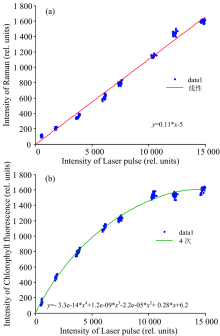
考虑荧光饱和效应和荧光猝灭间存在联系[9], 受叶绿素浓度的影响。 实验对不同浓度的样本进行测量, 图2和图3为改变激光功率获得的Raman散射和685 nm荧光强度与激光强度的关系, 对应叶绿素浓度分别为162.00 μ g· L-1和81.00 μ g· L-1。 激光光强和Raman散射强度呈良好的线性关系, 而荧光强度呈非线性变化。
 | 图2 叶绿素浓度162.0 μ g· L-1时水体Raman散射和叶绿素荧光强度随激光强度的变化 (a): 水体Raman散射与激光强度呈线性变化; (b): 叶绿素荧光与激光强度呈非线性变化Fig.2 The intensity characteristics of Raman and fluorescence of a solution with Chl-a concentration of 162.0 μ g· L-1 (a): A linear relationship between Raman intensity and laser intensity; (b): Chlorophyll fluorescence intensity is nonlinear with the emitted laser intensity |
 | 图3 叶绿素浓度81.0 μ g· L-1时水体Raman散射和叶绿素荧光强度随激光强度的变化 (a): 水体Raman散射与激光强度呈线性变化; (b): 叶绿素荧光与激光强度呈非线性变化Fig.3 The intensity characteristics of Raman and fluorescence of a solution with Chl-a concentration of 81.0 μ g· L-1 (a): A linear equation containing water Raman scattering intensity and laser intensity; (b): A nonlinear regression from chlorophyll fluorescence intensity and laser intensity |
将浓度162.00 μ g· L-1的样本荧光数据分别进行线性和四次多项式拟合, 如图2(b), 线性拟合造成较大方差, 而四次多项式拟合基本满足荧光强度分布, 与原始数据的相关系数为99.70%, 99.58%, 99.75%, 决定系数接近于1。 浓度为324.00, 162.00和81.00 μ g· L-1时, 荧光与激光强度关系分别拟合为
其中, 自变量x为Ilaser, x2, x3和x4可理解为在单重态湮灭、 再吸收及荧光猝灭等作用产生的分量。 结合式(2), IF=β η Ilaser+C0, 那么β 仍与Ilaser存在非线性关系。 仅根据拟合多项式, 能够描述样本685 nm荧光的非线性变化趋势, 但无法确定β 的具体形式。
由图2(a)和图3(a), 可假设R=η RIlaser+CR, 其中线性系数η R为Raman散射转换效率, CR为常数, 理想情况下CR=0。 浓度为324.00, 162.00和81.00 μ g· L-1时, Raman散射随激光强度的变化均满足线性关系
由此可见, η R值随叶绿素浓度增大而减小, 拟合出现的偏差CR分别为7.9, -6.5或-5, 相对于Raman散射的强度变化, 该值可忽略。
探测光源不变, 水中荧光颗粒物增多时, 荧光散射截面总和增大, Raman散射截面总和减小, 同时荧光猝灭、 再吸收的概率也相应增大[11]。 Raman散射的转换效率、 及685 nm荧光的非线性变化, 都与样本浓度存在联系。 因此, 可以将η R作为685 nm荧光非线性变化程度的参照量。
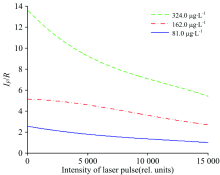
上述实验表明, 饱和激发下叶绿素荧光强度不再与激光强度呈线性变化关系, 而水体Raman强度仍与激光强度呈线性变化, 这造成比值IF/R与Ilaser呈非线性, 如图5。 而根据传统理论式(3), Ilaser≠ 0情况下, IF/R与Ilaser无关, 形成平行于x轴的一条直线。
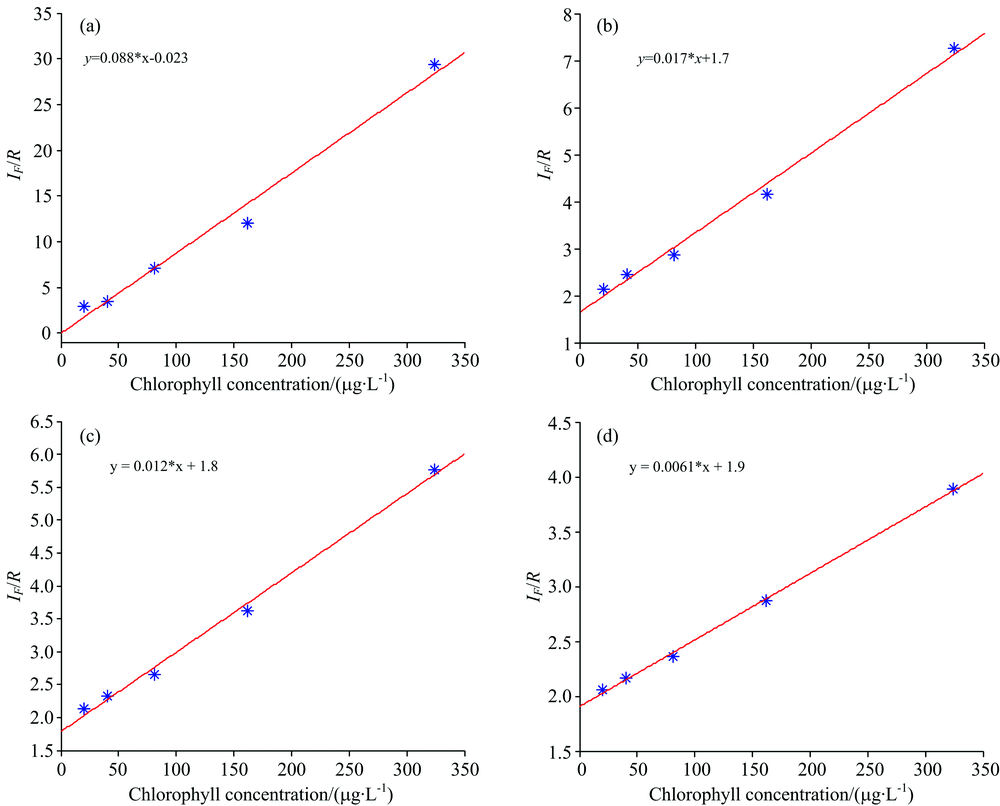 | 图5 不同激光光强时IF/R与叶绿素浓度的关系 (a), (b), (c)和(d)对应的激光功率密度分别为52.0, 80.7, 132.1和197.3 mW· cm-2Fig.5 The relationships of IF/R and Chl-a concentrations under different laser intensities (a): 52.0 mW· cm-2; (b): 80.7 mW· cm-2; (c): 132.1 mW· cm-2; (d): 197.3 mW· cm-2 |
为了探究式(3)的适用性, 在激光功率密度为52.00, 80.70, 132.10和197.30 mW· cm-2时测得IF/R与nchl的变化, 分别对应图5中(a), (b), (c)和(d)。
由式(3)得:
另外, 值得注意的是, 当激发光强增大时,
(1)饱和激发下IF非线性变化, 造成反演的nchl值随Ilaser增大而减小。
(2)若Ilaser不变, nchl与
 | 图4 饱和激发造成的比值IF/R非线性变化Fig.4 IF/R with Chl-a fluorescence saturation |
饱和激发荧光的非线性效应, 是影响LIF技术反演叶绿素浓度的重要因素。 由于荧光饱和过程的复杂性, 采用四阶多项式拟合荧光数据, 仅能定性描述其非线性趋势, 结合nR值可间接地说明样本的荧光饱和程度。 利用LIF技术测量叶绿素浓度, 须对荧光饱和效应的影响进行修正, 反演关系满足
| [1] |
|
| [2] |
|
| [3] |
|
| [4] |
|
| [5] |
|
| [6] |
|
| [7] |
|
| [8] |
|
| [9] |
|
| [10] |
|
| [11] |
|