低本底α/β仪测量饮用水中总α放射性活度的实验室质量控制
[毛俐 , 李荣培, 刘鑫, 苏会岚
* ]
, 李荣培, 刘鑫, 苏会岚]
|
|


作者简介: 毛 俐, 女, 1980年生, 成都医学院公共卫生学院副教授 e-mail: chemistrymao@126.com
总α放射性活度检测可避免繁琐的低水平放射性核素鉴定, 是饮用水放射性水平的初筛监测手段之一。 近年调查显示: 我国饮用水总α放射性活度稳定保持在较低水平。 低水平的α放射性活度检测需要高质量实验室质量控制, 以保证检测结果的准确度。 实验采用低本底α/β仪, 以α闪烁体为探测器, 吸收样品核辐射α粒子能量, 使有机闪烁体分子ZnS(Ag)发射荧光, 通过统计单位时间内的闪烁体发射荧光数目正比于核衰变数目, 由此感应有效厚度样品层辐射的α粒子计数信号, 对饮用水中总α放射性活度浓度检测。 首先, 实验以表面α粒子发射率为2~20粒子数/s(2π 方向)的电镀源测定本底α计数效率(CPS)。 然后, 在最优化的本底值、 工作源效率、 串道率等参数条件下, 运用标准曲线法测定标准源α计数效率( ε)。 最后, 结合CPS和 ε代值计算质控样总α体积活度、 计数平均值(或总体积活度平均值)
The gross alpha activity assay generally serves as one of screening approaches on gross radiation level to avoid the cumbersome radionuclide identification at low radioactivity level. Since the radioactivity investigation in China showed that the gross alpha activity in drinking water maintained a low level, the high-efficient quality control in laboratory should be provided in gross alpha activity assay to guarantee the accuracy. In this experiment, the low-background gross alpha/beta counter was employed with alpha scintillation as probe to detect the gross alpha activity in drinking water. The energy of alpha particles emitted from analyte sample was absorbed by alpha scintillation and transferred to organic scintillation with fluorescence emission on the probe, by which the nuclear radiation was converted into the flicker of fluorescence. The number of flickers is proportional to the number of kernel decay per unit time for counting the alpha particles numbers emitted from analyte sample layer. At first, the electroplating source with alpha particle emissivity of 2~20 particles numbers per second in 2π direction vector was used to determinate the alpha background counting rate (CPS). Then the alpha background count, the detection efficiency of work source ( η), the common background beta to alpha ratio ( Fα) were optimized in the experiment. Upon these optimized parameters, the standard source counting rate ( ε) was calculated by fitting calibration curve. Finally, combining the value of CPS and ε, the gross alpha volume activity in controlled water samples was calculated as mathematical model. Based on these data statistics, the quality control on alpha background count, alpha count of standard source and the gross alpha volume activity were investigated for evaluating the influence of CPS and ε on the quality control of gross alpha volume activity assay. The results showed that while the spread sample with the density of 4 mg·cm-2 was placed for 24 h and measured with239Pu as work source and241Am as standard source for 60 min, the CPS could be obtained as 0.000 37 s-1 upon the η of 94.34%, the Fα of 0.41% and ε of 7.25% ( Y=1.323 X-5.285, R2=0.991 5). And the alpha backgrounds of 40 blank panel samples count over the range of -1.61~5.82. Among these samples, 33 of samples count in the controlled scope of upper auxiliary limit (UAL) and lower auxiliary limit (LAL). 2 of samples count in the controlled scope of upper warning limit (UWL) and UAL. 3 of samples count in the controlled scope of lower warning limit (LWL) and LAL. 2 of samples count in the controlled scope of UWL and upper control limit (UCL). The alpha background was well controlled. And the alpha particle numbers of 24 standard source samples count over the range of 523.7~644.3. Among these samples, 14 of samples count in the controlled scope of UAL and LAL. 5 of samples count in the controlled scope of UWL and UAL. 5 of samples count in the controlled scope of LWL and LAL. The alpha count of standard source was well controlled. Moreover, the gross alpha volume activity of 20 drinking-water samples distributed over the range of 0.007 91~0.057 86 Bq·L-1. Among these water samples, 11 of samples dispersed in the controlled scope of UAL and LAL. 5 of samples dispersed in the controlled scope of UWL and UAL. 3 of samples dispersed in the controlled scope of LWL and LAL. Only one sample dispersed in the scope of LWL and lower control limit (LCL). The gross alpha activity detection was well controlled in drinking-water samples. Therefore, while the gross alpha activity at low level was detected by using alpha scintillation probe, controlling two main uncertainty source of alpha background and standard source counting rate was an effective strategy in quality control of gross alpha activity assay in laboratory.
水是人类摄入天然放射性核素的主要途径。 通常, 总α 放射性检测作为饮用水放射性水平的初步筛查监测手段之一, 常规化的开展在放射性核素鉴定之前[1]。 WHO规定饮用水的总α 放射性参考水平为0.5 Bq·
低水平的α 放射性活度检测受放射性核素自吸、 衰变等影响[3], 需要高质量实验室质量控制的检测方法做保障。 国家《生活饮用水标准检验方法— 放射性指标》推荐: 比较测量法、 厚样法和标准曲线法等三种方法为饮用水总α 放射性体积活度检测的基本方法[6]。 近来, 各研究机构对比较测量法和厚样法的测定不确定度时有评估[7, 8, 9], 但对实验室质量控制探讨少有涉及。 实验拟采用标准曲线法测定计算质控样总体积活度, 并深入探讨α 放射性测定中的实验室质量控制。
低本底α /β 测量仪(α /β 双闪烁体探测器)(HD-2011, 北京核地科技发展中心); 不锈钢测量盘(厚度大于250 mg· cm-2, 载样面积16 cm2); 电子天平(FA1604, 上海); 电热恒温干燥箱(GZX-DH-50X55-35, 上海跃进); 可编程一体化箱式电阻炉(SSXF-10-14, 上海康路); 电子恒温水浴锅(HH.W21, 北京中兴)。
241Am α 标准源粉末(中国计量科学研究院, 比活度11.1 Bq· g-1); 硝酸溶液(50% V/V, 优级纯, 成都市科龙化工试剂厂)。
取适量α 标准源241Am, 经350 ℃烘干1 h, 干燥器冷却, 研磨成粉末(< 100目), 双份制备。 精准称量200 mg, 铺于测量盘中, 滴入适量丙酮与乙醇的有机混合液(V/V=1:1), 调为糊状, 平铺均匀, 红外灯下烘干, 干燥器内冷却待用。
水样采集: 按照标准文件GB/T 5750.13— 2006执行[6], 以水和硝酸体积比1:0.020的比例, 将相应量硝酸加入聚乙烯桶中。 根据随机采样原则, 选择管网末梢水采样点, 每桶采集5 L水样带回实验室, -4 ℃下保存, 尽快分析。
水样蒸发: 取约1 000 mL水样, 加热近沸, 蒸发浓缩(至约100 mL), 转入恒重瓷蒸发皿后, 水浴蒸发(95~97 ℃), 硝酸溶液冲洗, 并入瓷蒸发皿。
酸化: 1 mL硫酸缓慢加入上述浓缩水样, 充分混合后, 电热板控温缓慢加热(330~350 ℃), 至无烟雾产生。
灼烧: 硫酸酸化后的残渣于高温炉下灼烧1 h, 取出并置干燥器冷却, 最后, 以减量法称量计算固体残渣质量(mg)。
准确称量200 mg样品残渣粉末(< 100目), 置于清洁样品托盘中, 然后滴入适量丙酮与乙醇的混合液(V/V=1:1)使之成为糊状, 均匀平铺, 红外灯下烘干, 放置24 h待测。
本底测量: 将空样品托盘放到测量位置, 设定“ 测量次数” (10次), 每次“ 定时设置” (100 min), 保存目录。
标准源测量: α 标准源样品盘放到测量位置, 4路通道同时进行每次60 min的α 标准源效率测量, 测6次, 共360 min。 重复上述测量, 取平均值。
样品源测量: 样品源托盘放到测量位置, 选择设定水样体积、 总残渣质量、 样品质量等样品类型相关信息, 设置测定时间和测定次数与标准源相同。
式(1)中: ε 为α 计数效率(从计数效率曲线查得, 与样品层质量厚度对应, 小数表示); ns为标准源α 计数率(CPS, 计数· s-1); n0为目标测量系统α 本底计数率(CPS, 计数· s-1); A为标准物质粉末α 放射性活度(由标准物质粉末的质量活度乘其样品盘中的质量得到, 单位Bq)。
式(2)中: Av为水中α 放射性体积活度(Bq· L-1); nx为样品源α 计数率(CPS, 计数· s-1); n0为α 本底计数率(CPS, 计数· s-1); ε 为系统α 计数效率; W为经处理后的水样品总残渣质量(mg); m为样品盘中的水样品源残渣质量(mg); V为水样体积(L); F为α 放射性回收率(设F=1); 1.02为每升水样加入20 mL硝酸的体积修正系数。
α 本底计数率与探测效率密切相关, 可先确定仪器探测效率, 再测量目标系统本底值。 实验以仪器原配的电镀239Pu为工作源, 进行10次测量结果如表1所示, 工作源探测效率η > 90%, α → β 串道率Fα < 0.5%。 同时, 利用仪器本底值对测量盘进行筛选, 如表2所示, 4路测量通道空盘本底α 计数率CPS均小于0.001 6 s-1。 选择本底值小, 且量值较接近的一组测量盘, 干燥器保存待用。
| 表1 α 放射性工作源效率 Table 1 The work source efficiency of alpha activity |
| 表2 α 本底计数 Table 2 The background count of alpha activity |
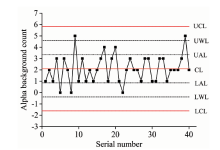
40份空盘α 计数测量数据, 计算本底α 计数平均值(
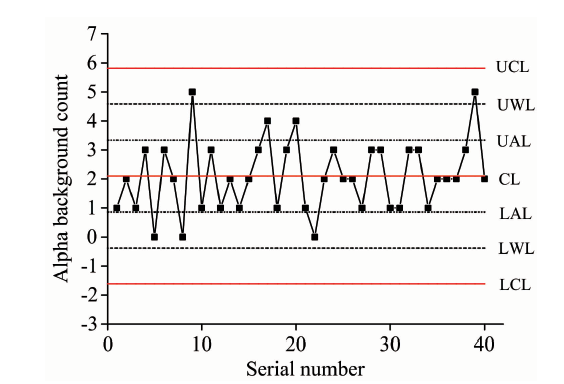 | 图1 空盘本底α 计数测定均数质量控制图Fig.1 Quality control chart of alpha background count with blank panel |
以国际标准推荐241Am粉末为标准源, 制备不同质量厚度标准源样品, 测量后, 按式(1)代入α 净计数率和标准源的标准物质粉末浓度, 计算α 计数效率。 然后, 以该标准源α 计数效率对标准源质量厚度作图, 拟合标准曲线(Y=1.323X-5.285, R2=0.991 5)。 241Am标准源测量结果数据(引用有效厚度经验值4 mg· cm-2)如表3所示。
| 表3 标准源计数效率 Table 3 The α counting rate of standard source |
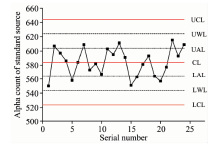
24份标准源样品4路α 计数测量数据, 计算计数平均值(
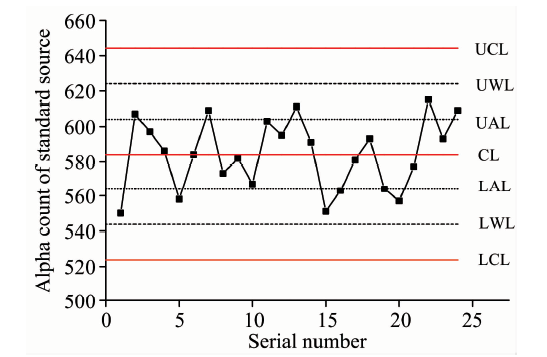 | 图2 标准源α 计数测定均数质量控制图Fig.2 Quality control chart of alpha count with 241Am as standard source |
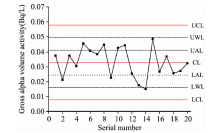
实验收集20组质控饮用水样α 放射性活度测量数据, 如表4所示。 计算α 总体积活度的算术平均值(
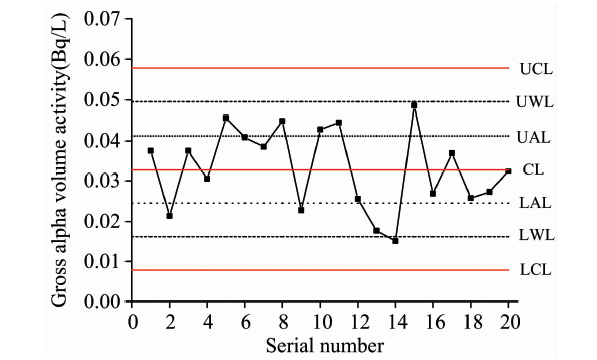 | 图3 质控饮用水样总α 体积活度均数质量控制图Fig.3 Quality control chart of gross alpha volume activity in controlled drinking-water sample |
| 表4 质控饮用水样总α 体积活度 Table 4 The gross alpha volume activity in water sample |
饮用水样总α 体积活度的受控范围0.007 91~0.057 86 Bq· L-1。 其中, 11 个点在UAL与LAL范围内, 5个点在UWL与UAL范围内, 3个点在LWL与LAL范围内, 1个点在LWL与LCL之间, 质控饮用水样中α 放射性活度检测受控良好。
低本底α /β 仪对α 放射性的测量是基于ZnS(Ag)闪烁体的主探测器吸收样品核辐射α 粒子能量, 使有机闪烁体分子ZnS(Ag)发射荧光, 统计单位时间内的发射闪烁荧光数目正比于核衰变数目, 由此感应α 粒子计数信号, 再转化成脉冲信号输出而实现样品放射性活度测量[10]。 本底计数统计涨落和标准源计数标准偏差是样品测量中不确定度的两大主要来源[11]。 因此, 本底计数和标准源的计数效率校正是标准曲线法测定α 放射性活度实验的关键。
系统本底α 计数, 以仪器原配电镀239Pu为工作源, 表面α 粒子发射率为2~20粒子数· s-1(2π 方向), 测得的探测效率、 串道率、 本底计数率等参数, 均达到或超过JJG853— 1993 《低本底α /β 测量仪检定规程》中Ⅱ 类水平, 说明仪器本底干扰小, 本底测量受控良好[10]。 标准源α 计数, 选择241Am作标准源, 能发射平均能量为5.5 MeV的α 粒子, 计数稳定, 有效避免我国水体α 放射来源中238U的干扰[12, 13]。 且在样品放置时间、 测量时间、 铺样分散、 铺样称量等操作参数最优化条件下[10, 14], 标准源测量受控状态良好。 由此可见, 在本底计数率CPS为0.000 37 s-1与标准源计数率ε 为7.28%, 且二者计数受控状态良好的情况下, 以α 闪烁体为探测器对饮用水水样放射性体积活度测定, 取得较好质量控制效果。
| [1] |
|
| [2] |
|
| [3] |
|
| [4] |
|
| [5] |
|
| [6] |
|
| [7] |
|
| [8] |
|
| [9] |
|
| [10] |
|
| [11] |
|
| [12] |
|
| [13] |
|
| [14] |
|