高光谱结合主成分分析的苎麻品种识别
[曹晓兰1, 2  , 邓梦洁
, 邓梦洁1 , 崔国贤2, * ]
, 邓梦洁]
|
|


作者简介: 曹晓兰, 女, 1972年生, 湖南农业大学信息科学技术学院副教授 e-mail: cxl@hunau.net
苎麻( Boehmeiria nivea L)是我国的特产, 作为一种传统的纤维作物, 一直有着较高的经济地位。 开发一种基于高光谱的、 新型高效的苎麻品种识别方法, 有利于苎麻栽种、 种质资源开发利用, 为实现苎麻高产优质及麻田精准管理提供关键技术支撑, 对提高苎麻产量和品质有重要意义。 为了将高光谱技术应用于苎麻品种识别, 采集了9个不同基因型苎麻品种, 利用地物光谱仪测定苎麻叶片高光谱反射率, 共1 458个叶片高光谱数据, 利用主成分分析(PCA)对高光谱数据进行降维, 探讨PCA最佳主因子个数的确定方法, 比较不同主因子个数与不同判别分析(DA)方法——即线性判别分析(LDA)、 二次判别分析(QDA)和马氏距离判别分析(MD-DA)组合, 在建立基于叶片高光谱的苎麻品种识别模型中效果。 对全波段的数据样本进行主成分分析之后, 以2~20个主成分作为特征变量, 分别建立LDA, QDA和MD-DA三种品种判别模型进行预测, 以预测集正确率为评价标准, 比较各种组合的效果。 结果表明, 若以累积贡献率≥85%为标准, 选择2个主成分时, LDA, QDA和MD-DA三种判别模型预测集正确率分别为32.92%, 38.48%和33.54%; 以特征值≥1为标准, 选择11个主成分时, 三种判别模型预测集正确率分别为68.72%, 87.04%和83.54%; 若以预测集正确率为优先考虑标准, 将主成分个数增加至20个时, 三种判别模型正确率有较大提高, 分别为84.98%, 95.68%和95.27%。 由此, 得到如下结论: ①利用PCA组合DA方法建立基于苎麻叶片高光谱的品种识别模型是可行的, 但因子数不同、 DA判别标准不同、 组合方法不同效果差异非常大; ②主因子个数对识别结果的影响较为明显, 适当增加主成分个数可以显著提高模型判别正确率, 因此不应局限于PCA特征值和方差累积贡献率的选择方法; ③主因子个数相同时, 三种判别标准中, QDA效果最好, LDA效果最差; ④最佳组合是20个主成分+QDA方法, 其数据维度大大降低(由全波段的2 031维降低20维), 而预测集正确率为95.68%。
Ramie( Boehmeiria nivea L)is a special and traditional fiber crop in China, having higher economic status. Determining the hyperspectral reflectance of ramie leaves with the spectrometer and developing a hyperspectrum-based method of ramie variety identification of high efficiency will be beneficial for the cultivation of ramie, the development and utilization of germplasm resources as well as the provision of critical technological supports to realize the top quality and high production of ramie and the accurate management of ramie croplands, which are significant for improving ramie yield and quality. In order to apply the hyperspectral technology for identifying ramie varieties, total 1458 hyperspectral data on the ramie leaves coming from nine ramie varieties of different genotypes were collected. According to these data, we explored the using of the Principal Components Analysis(PCA) to reduce dimensions of the hyperspectral data and how to determine the best appropriate number of principal factors in the PCA. Further, we compared different combinations constituted by different principal factors and different Discriminant Analysis approaches, and the results of the ramie variety identifying models based on the hyperspectrum of ramie leaves were established. After the principal component analysis of the full-band data sample, with 2~20 principal components as the feature variables, we applied three discriminant models, namely the Linear Discriminant analysis(LDA), the Quadratic Discriminant Analysis(QDA), and the Mahalanobis Distance Discriminant Analysis, (MD-DA), to create variety discriminant models and used them to predict, and with the accuracy of the prediction set as the evaluation criteria, the effects of various combinations were compared. The results showed that when we used the cumulative contribution rate(≥85%) as the criteria and selected two principal components, the accuracies for the LDA, the QDA and the MD-DA prediction sets were respectively 32.92%, 38.48% and 33.54%; but, when we used the feature value(≥1) as the criteria, and selected eleven principal components, the accuracies for the prediction sets of above discriminant models were respectively 68.72%, 87.04% and 83.54%; and further, when we considered the accuracy of the prediction set as the preferential criteria and selected twenty principal components, the accuracies for above discriminant models were all significantly improved and were respectively 84.98%, 95.68% and 95.27%. Therefore, we can draw the following conclusions: (1) it is feasible to establish the ramie leaf-based hyperspectral variety identification model by combining the PCA and the DA, but there are big differences between results due to different numbers of factors, different DA criterias and different combination approaches; (2)The impact of the number of principal factors on the identification results are significant, and the appropriate adding of the principal components can notably improve the accuracies of corresponding models, thus it is not confined to how to select the feature values of the PCA and the accumulative variance contribution rate ; (3) When the numbers of principal factors are the same, among above three discriminant criteria, the effect of the QDA is the best while that of the LDA is the worst; (4) Twenty principal components and the QDA approach constitute the best combination, which makes data dimensions be hugely reduced, from 2031 dimensions of the full-band down to 20 dimensions, and the accuracy of the prediction set is 95.68%.
农作物的准确识别是作物分布范围、 类型、 长势等信息提取的基础, 也是农业资源调查、 作物估产、 灾害监测等的保障[1]。 此外, 准确识别农作物对新品种的培育也起着积极的作用。 高光谱分析能够在许多非常窄的波谱范围内对物体的细微差别进行探测, 能区分那些具有诊断性光谱特征的物质, 有助于更好地通过目标的光谱特性来确认或揭示其本质属性, 具有简单快捷、 高精度、 无损、 无污染和信息量大等特点, 因此, 近年来被广泛应用于作物、 农产品等分类、 识别研究[2, 3, 4, 5, 6, 7]。
苎麻被誉为中国草, 我国苎麻种植面积和原料产量占世界的95%以上[8], 在国民经济中有着较高的经济地位。 我国苎麻的种质资源十分丰富, 当前, 苎麻品种分类研究工作主要基于种植区域、 植物学形态、 产量和品质、 生育期等标准进行划分, 这些方法繁琐、 耗时长、 成本高或主观性强。 因此, 充分利用高光谱的优势, 开发一种基于高光谱的苎麻品种识别方法, 不仅有利于苎麻属植物分类的深入研究和进一步利用, 还为建立苎麻品种高光谱数据库, 以实现苎麻品种信息化管理, 以及为今后实现田间苎麻种植监测和种植区域的监控提供可能的技术手段。
高光谱数据采集设备选用ASDFieldSpec 3便携式地物光谱仪和配套的手持叶夹式叶片光谱探测器。 光谱仪波段范围350~2 500 nm, 光谱分辨率为3 nm@350~1 000 nm和10 nm@1 000~2 500 nm, 数据间隔1 nm, 采集频率15次· s-1; 手持叶夹式叶片光谱探测器具有内置石英卤化灯, 光源稳定。 采集时每隔20~30 min左右做一次OPT(optimize instrument setting)优化和白板校正。
数据采集在长沙县梅花基地苎麻种质资源圃(28° 07'59″N, 113° 17'46″E)、 湖南农业大学耘园苎麻材料圃(28° 11'01″N, 113° 04'10″E)和湖南农业大学国家麻类长期定位试验点(28° 10'51″N, 113° 04'34″E)进行, 时间选在苎麻旺长期。 采集时, 选择植株中部发育完整且处于旺盛期的叶片, 避开主叶脉, 将叶片夹持器夹紧叶片所测部位, 用探头测定叶片光谱。 每个叶片在主叶脉两边各选择2个采样点, 一共4个采样点, 采样点数据做断点校正之后再取均值代表该叶片光谱数据。 为消除光谱数据在采集时首端与末端产生的噪音, 选择420~2 450 nm之间的光谱数据进行分析。
一共采集了金沙枸皮麻、 毕节圆麻、 湘潭鸡骨白、 沅江黄壳早、 平塘大刀麻、 中苎1号、 邵阳4号、 双峰大叶麻和绥宁青麻等9个品种的叶片高光谱数据, 每个品种162个叶片, 共1 458个叶片样本数据。 将每个品种样本按2∶ 1比例随机分成建模集(108片)和预测集(54片): 建模集用于建立品种鉴别模型; 预测集不参与建模, 仅用于评测模型的准确率。 对光谱数据分析和处理采用Excel 2010, ViewSpecPro, Spss Statistics 19和Umscrambler 10.4软件进行。
全波段的光谱数据虽然信息全面, 但数据维度高, 数据量大, 且存在冗余信息甚至噪声, 会对模型结果造成干扰, 用于建模并不适合, 需要通过特定的方法对数据进行降维。 降维的目的是在满足一定精度要求的前提下, 选择/提取更有效和代表性的特征参数, 减少数据量, 去除冗余信息和噪声, 用较少的特征完成对观测对象的分析处理, 从而节约计算成本, 提高模型效率、 质量和稳健性。
主成分分析(principal components analysis, PCA)是常用的一种高光谱数据降维方法。 PCA对原始数据通过线性变换到一个新的坐标系统中, 每个主成分尽可能多地保留原始变量的信息且相互独立, 任何数据投影的第一大方差在第一个坐标(即第一主成分)上, 第二大方差在第二个坐标(第二主成分)上, ……[9]。 将降维后的主成分作为变量用于建模, 所得结果多半优于原始变量直接建模。
判别分析(discriminant analysis, DA)属于有监督分类方法的一种, 其基本原理是按照一定的判别准则, 建立一个或多个判别函数, 用研究对象的大量资料确定判别函数中的待定系数, 并计算判别指标, 据此可确定某一样本属于何类[10]。 根据判别标准不同, 判别分析有线性判别分析法(linear discriminant analysis, LDA)、 二次判别分析法(quadratic discriminant analysis, QDA)、 马氏距离判别分析法(Mahalanobis distance discriminant analysis, MD-DA)等。
定性模型的评价以预测集准确率结合建模变量个数为主: 准确率越高, 模型效果越好; 参与建模的变量个数越少, 计算量越小越好; 但变量个数太少, 可能会导致失去一部分有效信息, 使得建模准确率降低, 因此二者需要权衡考虑。
对所有样本原始高光谱数据进行PCA分析, 前20个主成分(principal components, PC)的特征值和累积贡献率如表1所示。 由表可知, 第1个PC贡献率为75.78%, 是所有PC中贡献率最大的; 前2个PC累积贡献率为86.68%, 之后各PC累积贡献率缓慢增加; 前11个PC的特征值均大于1, 累积贡献率为99.89%; 前20个PC累积贡献率达到99.98%, 仅剩0.02%的光谱信息未能表达。
| 表1 前20个主成分的特征值和累积贡献率 Table 1 The eigenvalues and the cumulative contributions of the top 20 principal components |
采用PCA降维的一个重要问题是选择主成分个数, 即降到多少维比较合适: 主成分个数太多达不到消除冗余的效果, 太少又会造成原始变量信息丢失过多, 建模效果可能不理想。 常规标准是方差累积贡献率≥ 85%以上或者特征值≥ 1; 此外, 也有研究认为, 最佳主成分个数可以在建模过程中依据模型结果而定[11]。
在本研究中, 若以方差累积贡献率≥ 85%以上为标准, 则最佳PC个数为2; 以特征值≥ 1为选择标准, 则最佳PC个数为11。 可见, 采用这两个常规标准得到的最佳主成分个数差别较大。 为了探明主成分个数对建立苎麻品种判别模型效果的影响, 找到主成分个数与判别模型正确率的最佳比, 本研究以2~20个主成分作为特征变量进行建模。
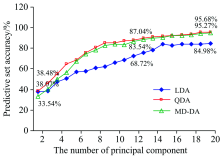
将2~20个主成分分别与LDA, QDA和MD-DA三种判别方法组合, 建立模型并进行预测, 各组合建模集和预测集正确率见表2, 预测集的判断正确率折线图如图1所示, 图中标注了2个主成分、 11个主成分和20个主成分正确率。
| 表2 不同主成分个数DA判别结果 Table 2 The DA discriminant result by using different numbers of principal components |
 | 图1 不同主成分个数DA判别结果Fig.1 The DA discriminant result under different numbers of principal components |
由表2、 图1可知, 主成分个数不同, 建模效果不一样: 若以累积贡献率≥ 85%为标准, 选择2个主成分时, LDA, QDA和MD-DA三种模型预测集正确率分别为32.92%, 38.48%和33.54%; 而以特征值≥ 1为标准选择11个主成分时, 预测集正确率分别为68.72%, 87.04%和83.54%; 若考虑提高模型的正确率, 选择20个主成分时, 三种模型的预测效果均为最佳, 分别为84.98%, 95.68%和95.27%。
对比不同主成分个数建模效果可知, 采用常规的确定最佳主成分个数的方法, 即方差累积贡献率≥ 85%和特征值≥ 1, 虽然能很好地表达x变量, 维度也比较低(分别为2个和11个), 但是模型预测效果不佳, 特别是前者, 三种DA模型预测集正确率均低于40%。 主成分个数适当增至15~20个, 虽然维度略增, 但可以较大幅度提高正确率。 臧卓的高光谱乔木树种分类研究发现, 利用主成分对高光谱数据降维时, 保留前15~20个主成分效果比较合适[3]; 刘瑶在研究高光谱的大豆品种识别时, 选择10个以上的主成分效果最佳, 累积贡献率在95%以上[4], 与本研究结论相符。
(1) 基于高光谱的苎麻品种DA模型的可行性
在多种组合中, 测试集正确率最高有95.68%, 最低的仅32.92%。 表明, 利用PCA+DA方法对苎麻进行品种识别是可行的, 但是不同主成分个数组合不同DA方法得到的识别结果差异非常大, 因此, 需要选择最合适的组合方案。
(2) 三种DA方法比较
由表2可知, 主成分个数相同时, LDA, QDA和MD-DA三种苎麻高光谱品种判别模型中, QDA模型效果最好, LDA效果最差。
(3) 主成分个数的选择
本研究中原始高光谱数据维数为2 031个, 即使取20个主成分, 也不及原始高光谱数据维度的1%, 降维效果仍然比较理想。 因此, 运用PCA方法降维, 建立苎麻叶片高光谱品种DA识别模型时, 综合权衡模型正确率、 降维力度, 将最佳主成分个数增至15~20个是比较好的方案。
(4) 最佳组合方案
选择20个主成分, 应用QDA方法, 预测集正确率最佳, 达到95.68%, 即最佳组合为20个主成分+QDA方法。
The authors have declared that no competing interests exist.
| [1] |
|
| [2] |
|
| [3] |
|
| [4] |
|
| [5] |
|
| [6] |
|
| [7] |
|
| [8] |
|
| [9] |
|
| [10] |
|
| [11] |
|