


基于二维相关光谱分析的纯棉与丝光棉制品鉴别分析
[曹凯1  , 赵众
, 赵众1, * , 袁洪福2 , 李彬2 ]
, 赵众, 袁洪福|
|


纯棉与丝光棉制品是日常生活中常用的两种纤维制品, 但是由于二者在物理结构和化学结构上非常相似, 以至于使用一些简单的方法难以准确识别一部分纯棉与丝光棉制品。 提出一种使用水含量作为扰动的二维相关光谱结合机器学习方法来对二者进行鉴别的新方法。 共使用从专业机构获得的200个标准样本来设计实验对新方法进行验证, 其中包括100个纯棉样本与100个丝光棉样本。 对每一个样本, 使用水含量作为扰动, 分4次改变样本水含量并采集该水含量下样本的一维光谱, 其中4次的水含量分别为20.20%, 14.52%, 7.77%与0%。 根据四条不同的一维构造每一个样本的动态光谱, 再通过二维相关算法来计算其同步二维相关光谱, 从该同步二维相关光谱中使用移动窗口技术提取三组不同的分类特征, 每组特征分别对应一个设计好的支持向量机(SVM)分类器。 之后本文提出一种基于信息熵的多分类器融合方法, 根据权值不同, 将三个分类器融合为一个具有更优效果的强分类器。 为了验证方法的准确性与有效性, 设计了严谨的实验对方法进行验证。 实验首先按照传统的从一维光谱中提取特征的方法对纯棉与丝光棉样本进行鉴别, 使用两种样本各50个来进行分类模型建立, 剩余的进行模型验证, 分类效果最高只有76%。 但是基于从二维相关光谱中提取的三组特征设计的三个支持向量机(SVM)分类器的准确率分别可以达到88%, 90%, 88%, 最后根据提出的基于信息熵的多分类器信息融合方法将三个分类器进行融合同一可以得到92%的分类准确率, 比三个基础分类器准确率都有提升。 与从一维光谱中提取特征并设计分类器进行分别鉴别相比, 从二维相关光谱中提取特征设计多个分类器并使用基于信息熵的多分类器信息融合方法进行分类鉴别具有更高的分类准确率。 二维相关光谱将光谱信息扩展到更高的维度, 将一维光谱中隐藏的折叠峰进行展开, 因此具有更高的分类准确率。 提出的方法是一种快速准确鉴别纯棉与丝光棉制品的新方法。
Biography: CAO Kai, (1992—), the postgraduate of College of Information Science and Technology, Beijing University of Chemical Technology e-mail: caok_5062@163.com
Pure cotton and mercerized cotton products are widely used in daily life. It is difficult to classify the pure cotton and mercerized cotton products with simple methods because they are similar in chemical and physical structures. In this work, a new method of rapid identification of pure cotton and mercerized cotton products with two-dimension correlation spectra analysis was proposed. In this work, 200 textile samples including 100 pure cotton fiber products and 100 mercerized cotton fiber products were collected. For each sample, the water content was changed 4 times and one-dimension spectra was collected, among them, the water content of 4 times was 20.20%, 14.52%, 7.77% and 0% respectively. Then their simultaneous two-dimension correlation spectra were calculated based on correlational analysis. Three kinds of classification features were extracted from the synchronous two-dimension correlation spectra. Support Vector Machine (SVM) was combined with different kind of the classification features to construct different classifiers. In this work, an information fusion method was proposed to make the multi-classifier decision. To verify the feasibility and effectiveness of the proposed method, the comparative experiments have been done. The accuracy of identification with the classifier based on extracted one-dimensional spectra features with PCA was only 76%. The accuracy of identification with the three classifiers based on extracted features from two-dimensional correlation spectra were 88%, 90% and 88% respectively. The accuracy of identification with the proposed method was 92%. Compared with one-dimension spectra based feature extraction, the two-dimension correlation spectra based feature extraction achieved feature enhancement and the multi-classifier fusion decision could improve the accuracy of classification obviously. Two-dimensional correlation spectroscopy extended spectral information to higher dimensions, unfolded hidden fold peaks in one-dimensional spectra, and had higher classification accuracy. The proposed method provided a new way for rapid identification of pure cotton and mercerized cotton products.
Pure cotton and mercerized cotton products are fiber products commonly used in daily life.It is usually difficult to identify pure cotton and mercerized cotton products with traditional methods[1]. For these cases, Some methods based on pattern recognition have been proposed to solve these problems. Classification features on the internal chemical and physical structures are extracted from the molecular spectra[2, 3] which can be classified in pattern recognition methods. But till now, identification of the materials with similar chemical and physical structures, such as the pure cotton and mercerized cotton products, is still an ad hoc research. Classification feature extraction is the most important part in the spectra analysis based on pattern recognition method. A good feature extraction method for a classifier needs to reduce the data dimension for lower computing cost, and more importantly, to transform the original data to the final feature space where the samples can be classified[7]. Two-dimensional correlation spectroscopy was first proposed in 1986, and was used in the field of nuclear magnetic resonance[8]. Two-dimensional correlation spectroscopy can enhance the apparent spectral resolution. Spectra change caused by the perturbations can be used to study the dynamic correlations of different spectra. In this work, 200 textile samples were collected including 100 pure cotton fiber products and 100 mercerized cotton fiber products. For each sample, the water content was changed several times and its corresponding one-dimensional spectra was collected. Then the simultaneous two-dimensional correlation spectra were calculated based on correlational analysis. Three kinds of classification features were extracted fromthe synchronous two-dimension correlation spectra. Support Vector Machine (SVM) was combined with different kind of the classification features to construct different classifiers. In this work, an information fusion method was proposed to make the multi-classifier decision. To verify the feasibility and effectiveness of the proposed method, the comparative experiments have been done. The remainder of the paper is organized as follows: Section 2 introduces the methods. In Section 3, the experiment is presented. In Section 4, the results and discussion are presented. Section 5 is the summary.
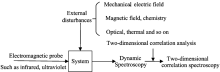
1.1.1 Acquisition of two-dimensional correlation spectra
The principle of two-dimensional correlation spectroscopy[9] is illustrated in Fig.1. In the process of measuring the spectraof substances to beclassified, a specific external perturbation is applied to them, and this external perturbation can be any physical or chemical changethat can change the internal sample environment. The spectra which change with external perturbations are called dynamic spectra. Two-dimensional correlation spectra can be acquired by two-dimensional correlation calculation of dynamic spectra[10].
 | Fig.1 Principle of two-dimensional correlation spectra acquisition |
(1) Calculation of dynamic spectra
First select an external disturbance, which can be any proper physical or chemical perturbation such as temperature and humidity[11]. In this work, the water content of samples is selected as the external disturbance and the minimum/maximum value of external disturbance is defined as tmin, tmax, and spectral intensity of external disturbances isdefined as y(v, t), Where v denotes the spectral changes, t denotes the external disturbance, and the dynamic spectra
where
(2) Two-dimensional synchronous and asynchronous spectra calculation
The generalized two-dimensional correlation spectrais divided into synchronous two-dimensional correlation spectra and asynchronous two-dimensional correlation spectra. For two different spectral wavelength points v1 and v2, their synchronization correlation strength Φ (v1, v2) is defined as
Asynchronous correlation intensity Ψ (v1, v2) is defined as
where m denotes the number of spectra measured during perturbation, N∈ Rm× m denotes the Hilbert-Noda matrix, yj(v) denotes the spectral intensity of the jth spectra at the wavelength v in the dynamic spectra and
The dynamic spectra can be described in vector form, then the synchronization spectraand the intensity of asynchronous spectra can be defined as
where
1.2.1 Support Vector Machine (SVM)
SVM is a feature classification method that is to find a classification hyperplane that could guarantee the high classification accuracy and makethe classification interval maximization[12]. In this work, the dichotomous classification problem is studied with SVM. Assuming the given training sample set is (xi, yi), i=1, 2, …, l, x∈ Rn, y∈ {± 1} and the classification hyperplane of wx+b=0 exists, to maximize the classification accuracy and classification interval, then (8) must be satisfied
where xi is the classification feature of theith training sample and yi is the classification category label of the ithtraining sample, w=(w1; w2; …; wd) is the normal vector of the classification hyperplane, which determines the orientation of the hyperplane, b is the displacement term, which determines the distance between the hyperplane and the origin.
The distance from any point x in the sample space to hyperplane (w, b) can be written as
The sum of distances between two heterogeneous support vectors and the hyperplane is calculated as r=2/‖ w‖ , which maximizes the interval. Then, the above problem of finding optimal hyperplane can betransformed into the minimization problem as
Introduce Lagrange function as
where ai> 0 is the Lagrange multiplier. The QP (quadratic programming) problem as (11) can be transformed into the following duality problem (a=(a1, a2, …, al)) as
The optimal weight vector w* and optimal bias b* can be calculatedrespectively as
All aj greater than 0 is setas
where x∈ Rn.
1.2.2 Multi-classifier fusion with voting mechanism
Random forest is a classifier that uses multiple decision trees to train and predict samples[13]. It can be used as a multi-classifier fusion method. Decision tree is a weak classifier. According to the voting mechanism, random forest fuses the multiple (odd) different weak classifiers to a strong classifier.According to probability principle, the accuracy of classification results of the fused strong classifier would be higher than that of each individual weak classifier.However, the idea of random forest with voting mechanism may amplify the effect of poor classifier and cause the lower accuracy of classification.
1.2.3 Multi-classifier fusion based on information entropy decision
Assuming a sample X may exist in several different states as x1, x2, …, xn, p(xi) denotes the probability of state xi(i=1, 2, …, n) appearing, then the sample information entropy H(X) is defined as
where 0≤ p(xi)≤ 1 and
In this work, identification of pure cotton and mercerized cotton fabricsis a dichotomous problem. The information entropy H(S) of the sample set in classifier S can be redefined as
Define the reciprocal of H(S) for classifier S as the weight of information fusion decision to avoid the unbalanced decision-making problem caused by the same weight of different classifiers. In this work, the identification problem is a two-class identification problem. Definethe class labels are 1 and -1. In this work, there are three classifiers (S1, S2, S3) for information fusion decision. The three classifier’ s information entropy are defined as H(S1), H(S2), H(S3) and the corresponding weights are 1/H(S1), 1/H(S2), 1/H(S3) respectively. For the same sample A, the discriminant labels of the three classifiers are P1, P2, P3 (the value of Pi is -1 or 1) respectively, then the final multi-classifier fusion result of the sample can be definedas
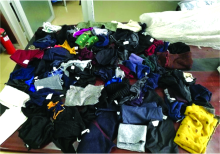
Totally 200 samples including 100 Cotton and 100 mercerized cottonfabrics shown in Fig.2 were provided by CSEPAT (Beijing, China) Technology Co. Ltd. Samples were taken from sweaters and shirts of different colors, both in size 15 cm× 15 cm. The sample type number, calibration set, validation set, and sample size are shown in Table 1.
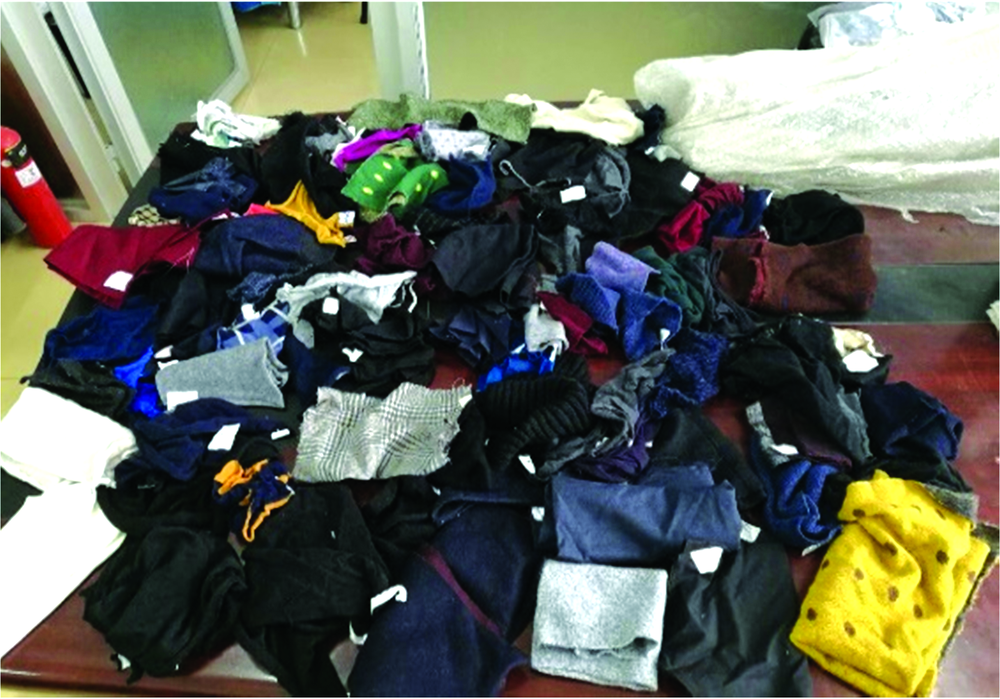 | Fig.2 Samples of pure cotton and mercerized cotton fabrics |
| Table 1 The statistics of the samples |
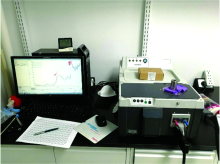
The instrument used in this experiment was an Antaris II FT-NIR spectrometer with a spectral range of 4 000~10 000 cm-1 and a resolution of 3.8 cm-1 as shown in Fig.3. Water content was used as an external disturbance to acquire the dynamic spectra. First, 200 original samples were evenly laid in an oven, then dried at 105 ℃ and weighed. Each time a sample was taken out, folded into 4 layers and tiled to collected the spectraon the instrumentwith scanning 32 times.Then the dried samples were tiled on a clean bench, sprayed pure water on both sides of the sample uniformly to make the water content be 20% and collected each sample spectra in the second time. After all the samples were exposed to the air for a short period of time to make the water content drop to about 14%~15%, then collect each sample spectra in the third time. Similarly, spectra of samples with water content declining to 7%~8% were collected in the fourth time. Finally, each sample had 4 NIR spectra with different water contents as shown in Table 2 to make a dynamic spectral matrix.
 | Fig.3 NIR spectrometer |
| Table 2 The water contents of samples for the dynamic spectra |
The MATLAB R2014a was used for data processing. First, the multivariate scatter correction and first-order S-G derivation were used to preprocess spectral data. Two-dimensional correlation spectra for each sample were calculated and classified using three SVM classifiers as shown in Table 3. The correct and incorrect probabilities of each sample were calculated with the SVM Matlab toolkit for each classifier. The entropy and weight of each classifier were calculated with (16)— (18). The final classification result of each samples was calculated with (19). The classification accuracy was calculated with (20)[16].
| Table 3 The classification featuresfor each classifier |
One-dimension spectra of the pure cotton and mercerized cotton samples with water content of 0 are shown in Fig.4. From Fig.4, it can be seen that there are serious overlap of one-dimension spectra of pure cotton and mercerized cotton samples. It is usually difficult to classify the pure cotton and mercerized cotton samples with one-dimension spectra as shown in Fig.4. The average spectra of two-dimension correlation spectra of 100 pure cotton textiles and 100 mercerized cotton textiles are shown in Fig.5. From Fig.5, it can be seen that there is obvious difference between the two-dimension correlation spectra of pure cotton textiles and mercerized cotton textiles in the red region. Compared with the one-dimensional spectra, the two-dimensional correlation spectra can enhance the apparent spectral resolution.
 | Fig.4 First-order S-G derivative spectra of pure cotton and mercerized cotton samples |
 | Fig.5 The averaged two-dimension correlation Synchronous spectra of pure cotton and mercerized cotton samples (a): Two-dimension correlation spectra of cotton; (b): Two-dimension correlation spectra of mercerized cotton |
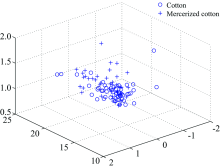
One-dimension spectra with water content of 0 for all samples were taken. PCA was used to compress the one-dimension spectra and extract the classification features of each sample. Since the sum of the contribution of the first two principal components reached 99%, all the samples were compressed to three dimensions and then classified with SVM. The sample space distribution after classification feature extraction with PCA was shown in Fig.6. 76 samples of total 100 test samples was correctly classified and the final classification accuracy was 76%. Because there are serious overlap of one-dimension spectra of pure cotton and mercerized cotton samplesas shown in Fig.4, it is not easy to classify the pure cotton and mercerized cotton samples using PCA to extract classification features from a one-dimension spectra.
 | Fig.6 The sample space distribution after classification feature extraction with PCA3.3 Classification based on two-dimension correlation spectra |
Compared with one-dimensional spectra, two-dimensional correlation spectra have higher resolution as shown in Fig.5. In this work, three kinds of classification features were extracted from the synchronous two-dimension correlation spectra. Support Vector Machine (SVM) was combined with different kind of the classification features to construct different classifiers. In this work, an information fusion method was proposed to make the multi-classifier decision.
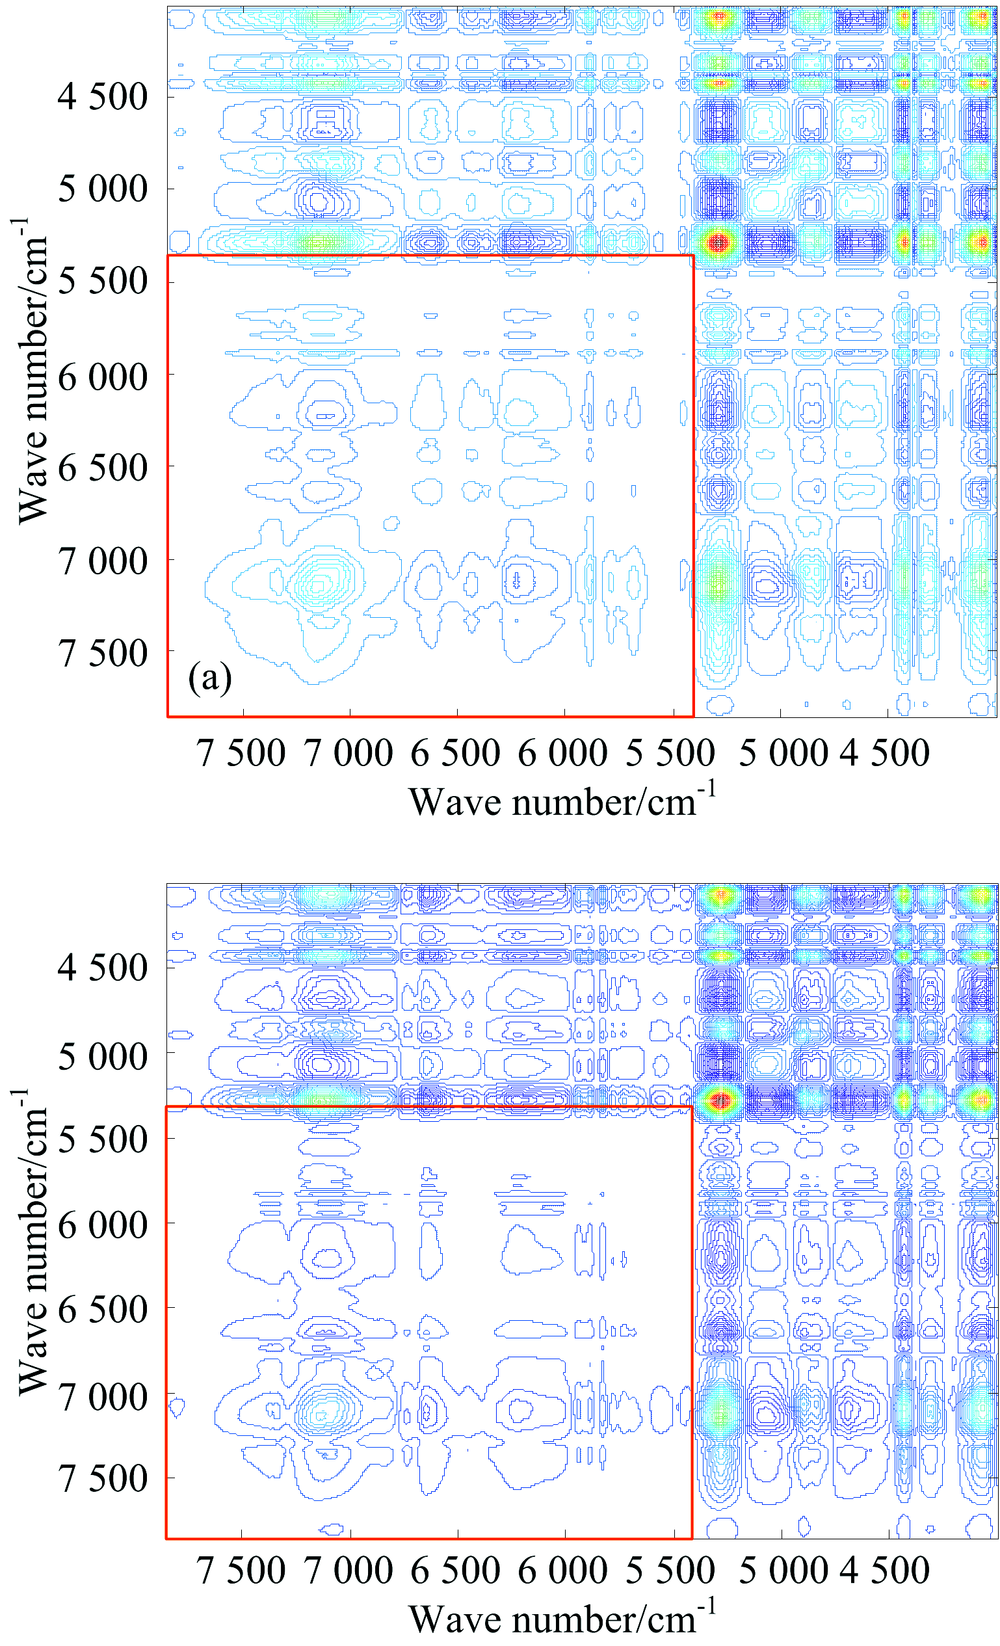
3.3.1 Classification with classifier 1
From Fig.5, it can be seen that there are significant differences between the two types of samples in the red region indicating that the mean and variance of the two are also different in this region. In this work, the mean and variance of the two-dimension correlation spectra were chosen as the classification features in the red region. The whole two-dimension spectra were traversed using the moving window technique. Each time the data point number was 400× 400, and the mean and variance of the region were extracted as the classification features. It was found that the wavenumber coordinates [4 471:5 537, 5 932:6 696] had the most significant differences. The SVM using the RBF kernel function with a penalty coefficient 0.8 and a gamma value 1 was chosen as the classifier 1 to classify the spectra of wavenumber coordinates [4 471:5 537, 5 932:6 696]. The mean and variance for all samples in the wavenumber [4 471:5 537, 5 932:6 696] region were plotted inFig.7, where the x-axis is the mean of all samples and the y-axis is the variance of all samples. 100 validation samples, including 50 cottons and 50 mercerized cottons fabrics, were classified correctly by the classifier 1 and the classification accuracy was 88%.
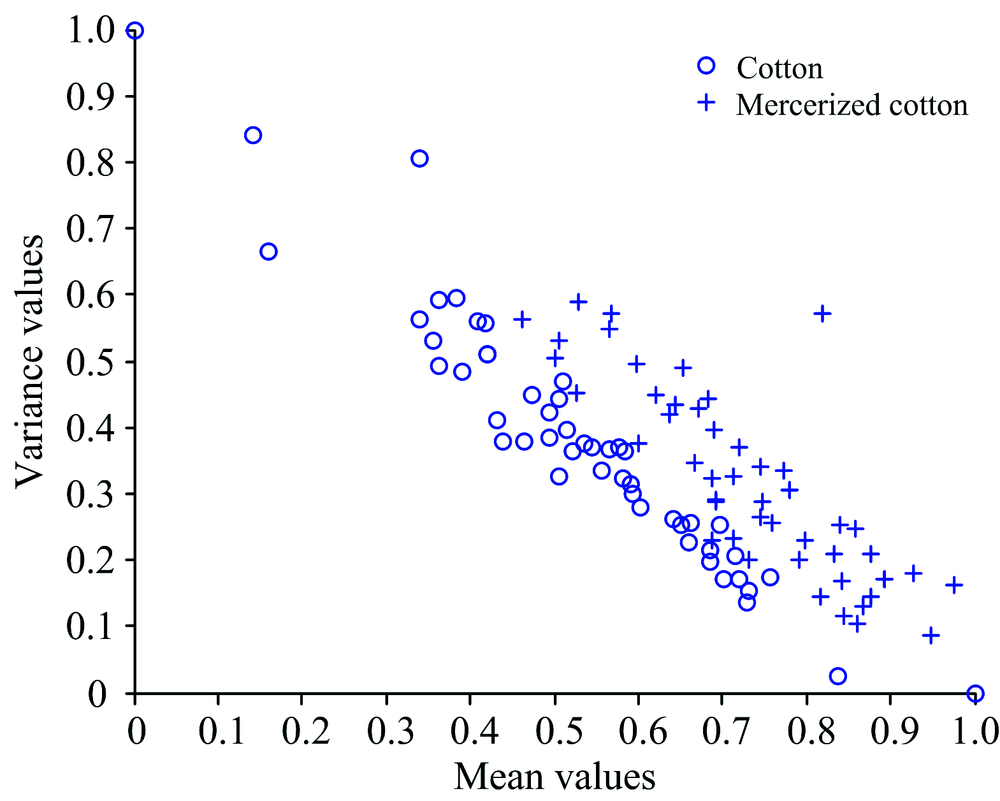 | Fig.7 The plot of mean values vs variances of all samples in the region with wavenumber coordinates [4 471:5 537, 5 932:6 696]3.3.2 Classification with classifier 2 |
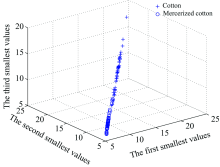
Similar to classifier 1, using the moving window analysis technique, the whole two-dimension correlation spectra were traversed. A 400× 400 size submatrix of the two-dimension correlation matrix of each sample were taken and the minimum three numbers were extracted from the sub-matrix region as the classification features for classifier 2. It was found that the wavenumber coordinates [4 385:5 156, 4 000:4 771 had the most significant differences. All three samples in the region [4 385:5 156, 4 000:4 771] are shown in Fig.8, where x-axis, y-axis and z-axis are the smallest three digits respectively.
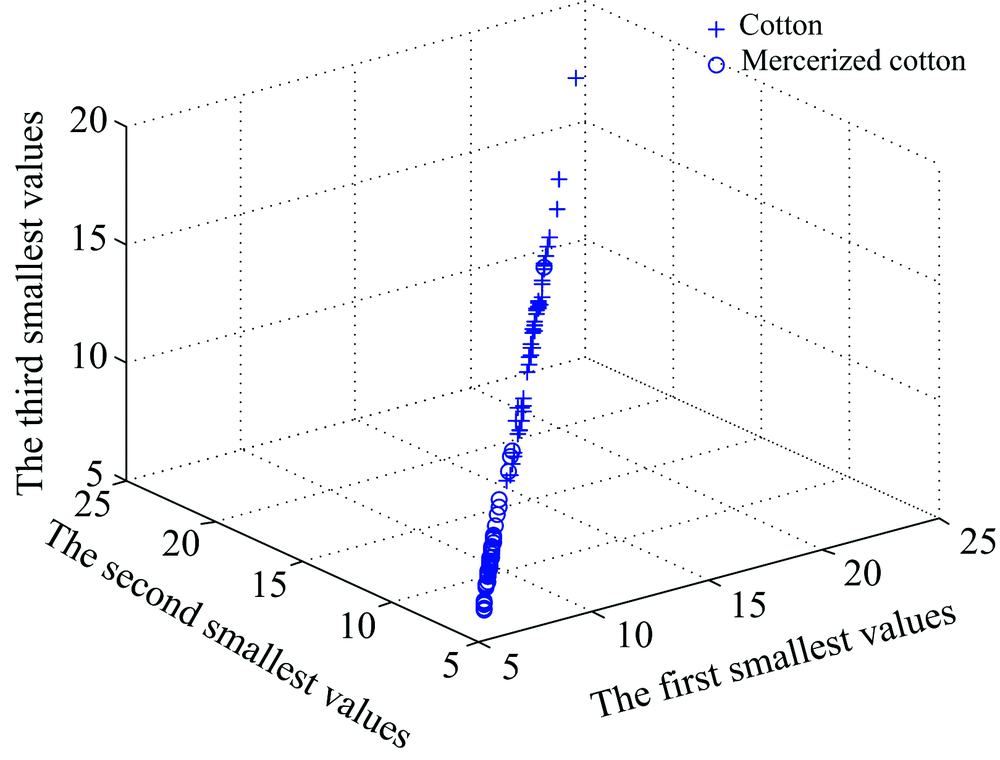 | Fig.8 The plot of the three smallest values of all the samples in the regionof coordinates [4 385:5 156, 4 000:4 771] |
The SVM using the RBF kernel function with a penalty coefficient 1 and a gamma value 1 was chosen as the classifier 2 to classify the three smallest values of all the samples in the region of coordinates [4 385:5 156, 4 000:4 771]. 100 validation samples, including 50 cottonsand 50 mercerized cottons fabrics were classified with the classifier 2 and the classification accuracy was 90%.
3.3.3 Classification with classifier 3
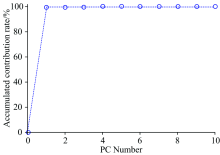
Similar to the classifier 1, using the moving window analysis technique, the whole two-dimension correlation spectra were traversed. A 400× 400 size submatrix of the two-dimension correlation matrix of each sample were taken. PCA was used to extract the classification features for classifier 3 from the wavenumber coordinates [6 313:7 081, 4 385:5 156]. The number of principal components and the corresponding cumulative contribution rate are shown in Fig.9. The RBF kernel function with a penalty coefficient 1 and a gamma value 1.5 was chosen as classifier 3.100 validation samples, including 50 cottons and 50 mercerized cottons fabrics, were classified with the classifier 3 and the classification accuracy was 88%.
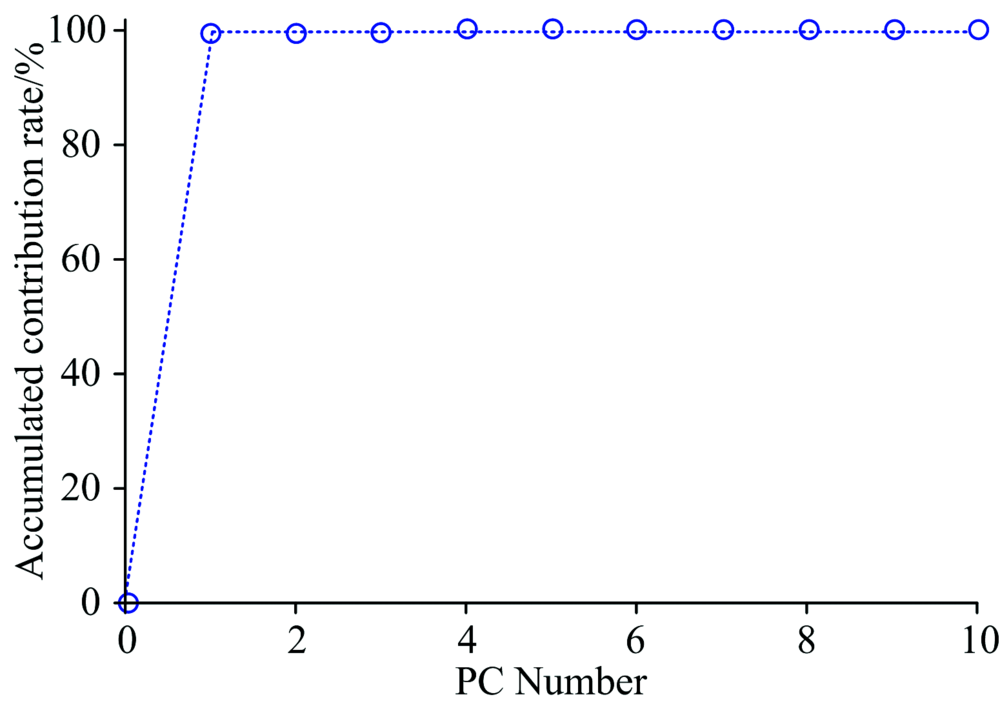 | Fig.9 PC Number and accumulated contribution rate in the area of coordinates [6 313:7 081, 4 385:5 156]3.3.4 Multi-classifier fusion based on information entropy decision |
The entropy and the weight of each classifier were calculated with (17) and its reciprocal respectively. According to the classification result of each sample in different classifiers and the proportion of the classifier in the multi-classifier fusionbased on information entropy decision, the final classification result of each sample was obtained according to (19). The classification results for all samples in the test set with each classifier and with the multi-classifier fusion based on information entropy decisionare shown in Table 4.
| Table 4 The classification result of each classifier and the fusion |
In this work, a new method is proposed for rapid identification of pure cotton and mercerized cotton products with two-dimensional correlation spectra analysis. Two-dimension correlation spectra were calculated in which humidity is the external disturbance. Three kinds of classification features were extracted from the synchronous two-dimension correlation spectra. Then Support Vector Machine (SVM) was combined with different kind of classification features to construct diverse classifiers respectively. Finally, to achieve the fusion of multiple classifier results, an information entropy-based information fusion method was used. The comparative experiment results have verified that, using information entropy fusion method, two-dimension correlation spectra have higher classification resolution than one-dimension spectra. What’ s more, multiple weak classifiers can form a strong classifier and can reduce the classification error caused by the unilaterality of single classifier. The proposed method in this work provided a new way for rapid identification of pure cotton and mercerized cotton products.
The authors have declared that no competing interests exist.
| [1] |
|
| [2] |
|
| [3] |
|
| [4] |
|
| [5] |
|
| [6] |
|
| [7] |
|
| [8] |
|
| [9] |
|
| [10] |
|
| [11] |
|
| [12] |
|
| [13] |
|
| [14] |
|
| [15] |
|
| [16] |
|