


钻石颜色分级定量化技术的研究
[程佑法1  , 范春丽
, 范春丽1 , 王岳1 , 张丛森2 , 朱红伟1 , 陈淑祥3, * ]
, 范春丽]
|
|


美国宝石学院19世纪30年代起, 首先建立了一套成熟的钻石颜色分级系统。 传统上, 钻石颜色分级靠目视以及与成套标准比色石比较确定。 目视分级结果被一些因素如检验环境、 钻石尺寸, 分级人员等所影响。 因此经常出现对一个样品, 即使是同一个人在相同环境分级检测也容易出现分级偏差。 为了避免上述问题, 利用检测设备来评估钻石颜色, 成为钻石领域的一个研究热点。 可是目前没有达到评估钻石颜色分级的要求。 该研究给出了一个有意义的方法来定量表征钻石的颜色。 该方法使用显微微区定位检测方法来定量评估钻石颜色, 同时该方法可以避免钻石尺寸大小对钻石颜色分级的影响。 可见光分光光度计原理被使用在该方法。 该方法由样品系统、 微区定位显示系统、 信号收集与计算系统组成。 D65光源被使用, 并且色温保持在(6 500±200) K; 高分辨率CCD探测器作为信号采集设备。 该方法准确检测了几套不同大小和颜色的带国家(中国)标准证书的钻石样品, 结果表明, 该方法能够快速、 准确的测量钻石的颜色坐标, 并自动转换为钻石分级系统对应的颜色分级级别, 同时靠使用微区定位检测技术, 对圆钻型钻石测试能够排除钻石尺寸引起的颜色分级偏差。 该方法对钻石分级是一个有益的潜在技术。
Biography: CHENG You-fa,(1972-). Professor CGC, National Gold & Diamond Testing Center email: 18678786329@163.com
Diamond color grading has been firstly designed to form a set of mature grading system by Gemological Institute of America. Traditionally, diamond color grading method is to observe the sample visually and compare it with a set of standard colour master stones. The classification results are mainly affected by the testing environment, size of diamond, inspectors and so on. Then, grading deviations will always exist for the same sample, even if it is tested by the same person in the same environment.To avoid the above problems, it has been a hot research topic in diamond field to use an excellent instrument to evaluate the color of diamond. However by now, there have not yet been any instruments which can completely meet the requirement for the grading of diamond. This paper gave an interesting method for quantitative evaluation of diamond color,and the micro zone measurement was applied and proposed to avoid the effect of size variation results in color grading of the diamonds. The principle of spectrophotometer was used in the method, which consisted of a sample system, a micro positioning display system, an automatic acquisition and calculation system. D65 light source was employed and its color temperature was (6 500±200) K. The color signal acquisition was realized by CCD optical fiber spectrometer with high speed, high resolution and large pixels. Several sets of master diamonds with the national(China) standard certificate and with different sizes and different colors were employed to test. The results showed that the method could obtain the index of the color of the diamond accurately and could transform to the degree of diamond grading color system. By using the micro area accurate positioning method, selected the common features of the diamond pavilion measurement area, which could eliminate the errors of the same color grade diamond due to the size. The method is a potentially useful technology for diamond color grading.
Diamond color grading is explored for diamond trade and use. The traditional diamond color grading method is to observe the sample visually and compare it with a set of standard colour master stones, and the results of which are mainly affected by the background color, UV fluorescence, inspectors and so on[1, 2]. Then, it is very difficult to avoid a large deviation result, even if the sample is tested by the same person in the same environment.
To avoid the above problems, we need to explore a new test method which can evaluate diamond color and find the error immediately when the inspectors made a big mistake.
In the recent years, the diamond color automatic measurement systems were paid attention to and studied[3, 4, 5, 6]. Automatic measurement methods should have a good repeatability and accuracy. However, by now, the repeatability of the measuring instrument can not completely meet the needs of color measurement, and what’ s worse, the results of the instrument measurement can not meet the color perception of the human eye and the brain.
At present, for the majority of diamond color measurement methods, the sample information is collected by placing the diamond samples on the integral ball window. A selected light irradiates the diamond sample surface, and the light is reflected and diffused by the diamond, then turned into the sphere detector for data acquisition[7, 8, 9]. The limitation of the method is that integral color automatic measurement requires a sample of plane structure, in order to reduce the measurement error caused by the surface structure. But the diamond color measurement faces a complex situation, especially different sizes. If a beam of light enters the diamond samples with different sizes, the optical path length inside the diamond will not be consistent. If the optical path length inside a large volume diamond is longer, the color will be deeper. If the optical path length inside a diamond of small size is shorter, the color will be lighter. The optical path length will directly affect the diamond color saturation. It is found that the standard round brilliant diamond pavilion has the similar characteristics, such as angle and shape. The precise light positioning of the region in the same measuring area can effectively eliminate the measurement error caused by the optical path in diamond. The paper provided a micro positioning detection method to avoid the size problem.
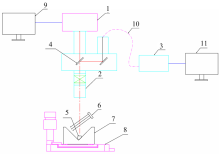
The method consists of a sample collecting system, a micro positioning display system, a spectrum automatic acquisition and calculation system. The principle of colorimetry of the CIE Lab. was applied to collect, analyze and calculate the information of tested diamond. At the same time, a continuous sequence color with different classes was adopted and used as the standard for reducing the system error. The design of the instrument structure was shown in figure 1, and the experimental apparatus was shown in figure 2. D65 light source with the color temperature of (6 500± 200) K was used. D65 light source is the most commonly used artificial sunlight as standard light sources. In order to meet the test conditions of vertical pavilion facets, a V type groove fixed angle was applied. A powder standard white board specified by standard GB/T 9086 was used and spectral reflectance ratio of which was above 95%, and the absorption of visible light was neutral[10]. Two standard white boards were placed above a fixed angle of the V type slot, which could be relatively movable, so that each surface of the test sample could be rotated to observe easily. This study used the VC development integration tool of Microsoft Windows desktop application. The color signal acquisition was realized by CCD optical fiber spectrometer with high speed, high resolution and large pixels. The technical parameters of the spectrometer were shown in table 1.
 | Fig.1 Instrument working principle diagram 1: CCD; 2: Zoom lens; 3: Spectrometer; 4: Semi transparent and semi reflective mirror; 5: Sample; 6: Light; 7: V type sample slot; 8: Adjustable two dimensional platform; 9: Positioning display; 10: The signal line; 11: Signal processing computer |
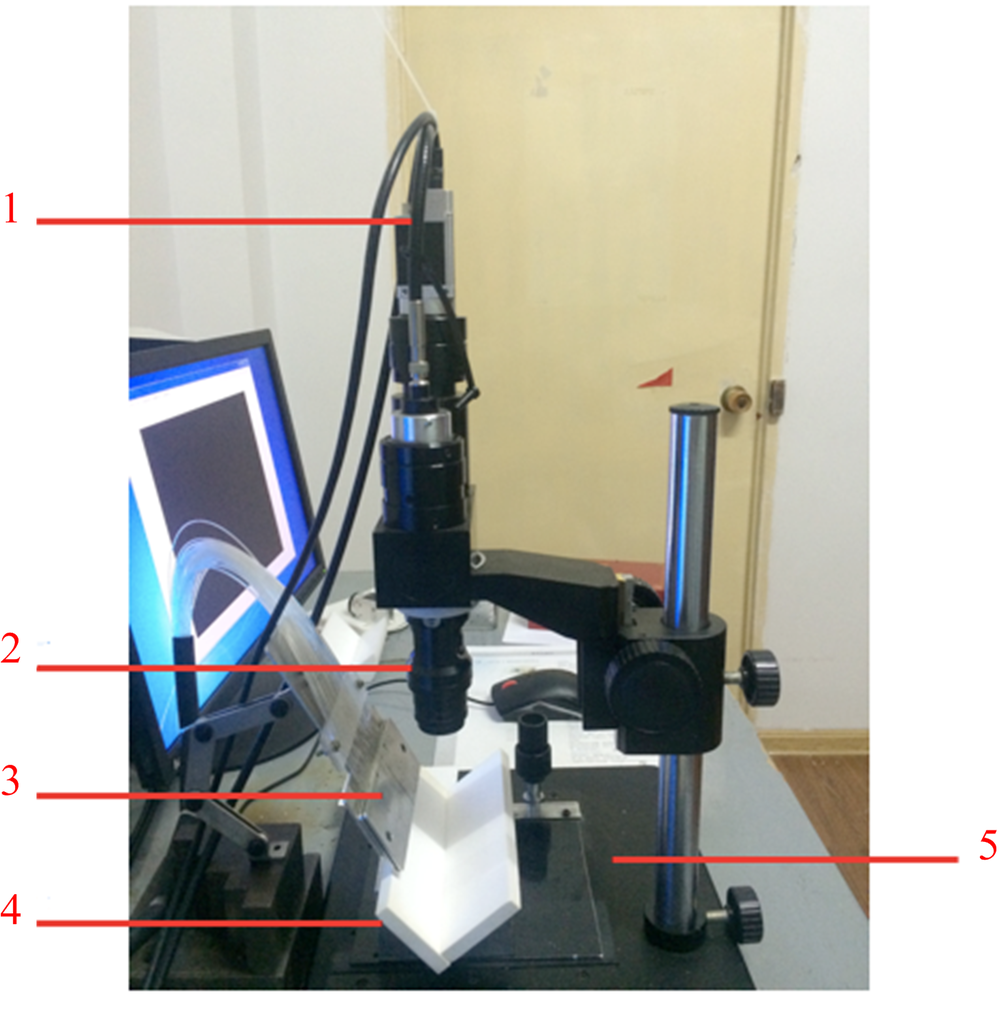 | Fig.2 Experimental device diagram 1: CCD; 2: Zoom lens; 3: Light source; 4: White board and V type slot; 5: Adjustable two dimensional platform |
| Table 1 Technology parameters of the spectrometer |
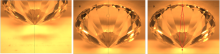
In order to ensure the same collection of diamond samples with different sizes and the results would not be affected by the size of the diamond, a measurement area was precisely positioned in the same characteristics of the diamond pavilion area, as shown in figure 3. Through a software analysis and calculation system, it could obtain the color measurement coordinates (x, y) value and diamond color level automatic conversion.
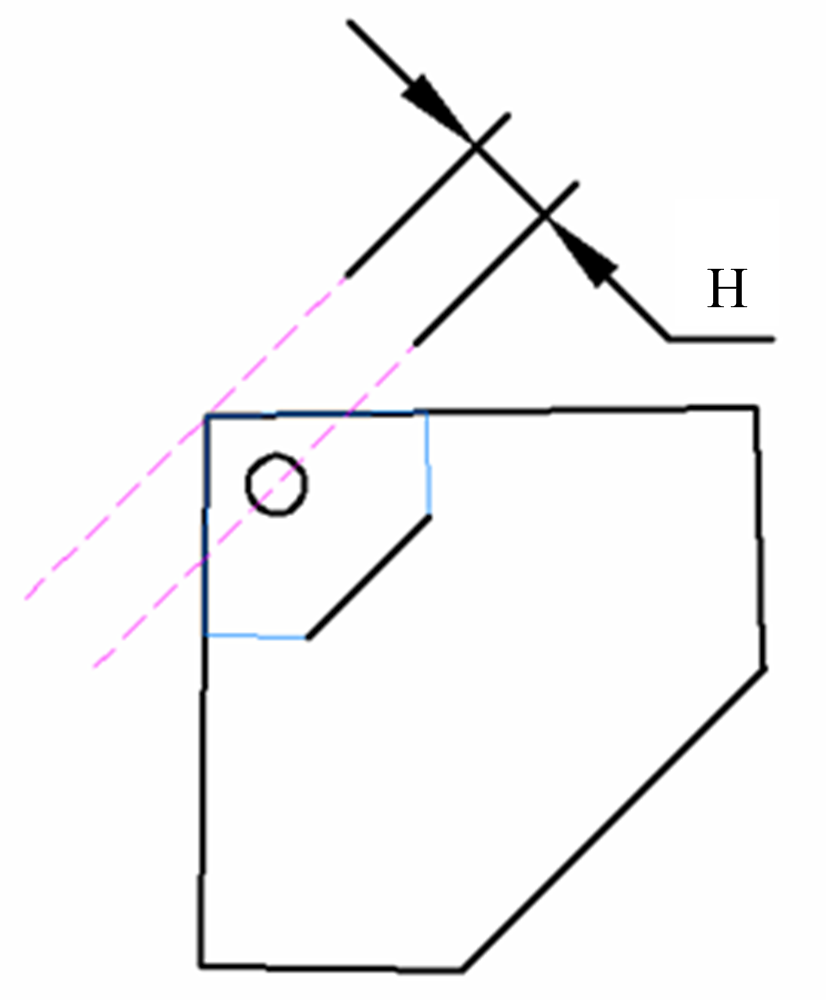 | Fig.3 Sample test area (Features of different sizes of diamond in the same area of the Pavilion) |
To ensure traceability, 5 sets of master diamonds with the national(China) standard certificate were tested. In which, the first set of stones included D, E, F, …, L color level, total of 9 stones, whose weight were 0.230.26 ct, and the 24 sets had similar size with the first set of master stones. The fifth set of master stones were larger, whose weight were 0.300.38 ct.
The diamond sample was placed on the whiteboard, and the diamond table was close to the side of the light source which was near to the board, as Figure 4(a). The other mobile whiteboard adjusted the position of the diamond, as shown in Figure 4(b). The A and B of the pavilion main facet were kept on a vertical dotted line, and the dotted line bisects the pavilion the main facet, so met the vertical pavilion main facet. The bottom point (B point) was moved to the center of the cross circular area as measuring region, as shown in the figure 4(c).
 | Fig.4 Measure the vertical pavilion main facet, bottom tip and cross center overlap, circular area is the measurement area |
To ensure the accuracy of the test results, each sample was calculated for 8 times by using the same method, and the average value of 8 data obtained was the final testing result.
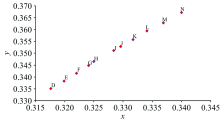
The 5th set of master stones were measured, and the diamond color coordinates (x, y) were shown in figure 5. The difference between the x and y index of the adjacent color grade were calculated, and the results were shown in table 2. The digital precision of the X and Y index were 0.000 2.
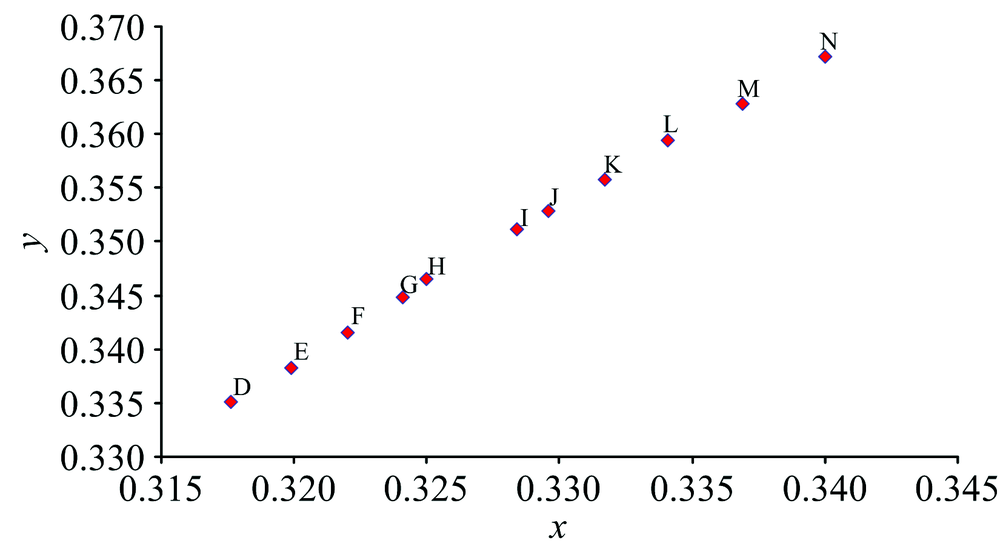 | Fig.5 Color coordinate chart |
| Table 2 Difference between adjacent color levels |
As shown in Figure 5, the method could also be used to test the color span levels of diamonds. The projection point of the test result basically showed linear distribution, and the whole uniformity was good. The method could easily distinguish the diamonds with different color gradings.
For testing the stability and repeatability of this method, we took a diamond of grading D as the example, fixed the same test surface, ten times in a row, and the results were shown in table 3.
| Table 3 D color diamond test data on the same test surface |
The data in Table 3 indicated that the stability and reproducibility of this method were good, and the average value method could further reduce the error.
Selecting No.1 and No.2 sets of mater stones to test, according to the same method as the above, and the results were shown in figure 6.
 | Fig.6 2 sets of different master stones test results |
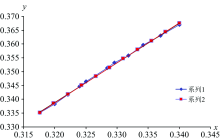
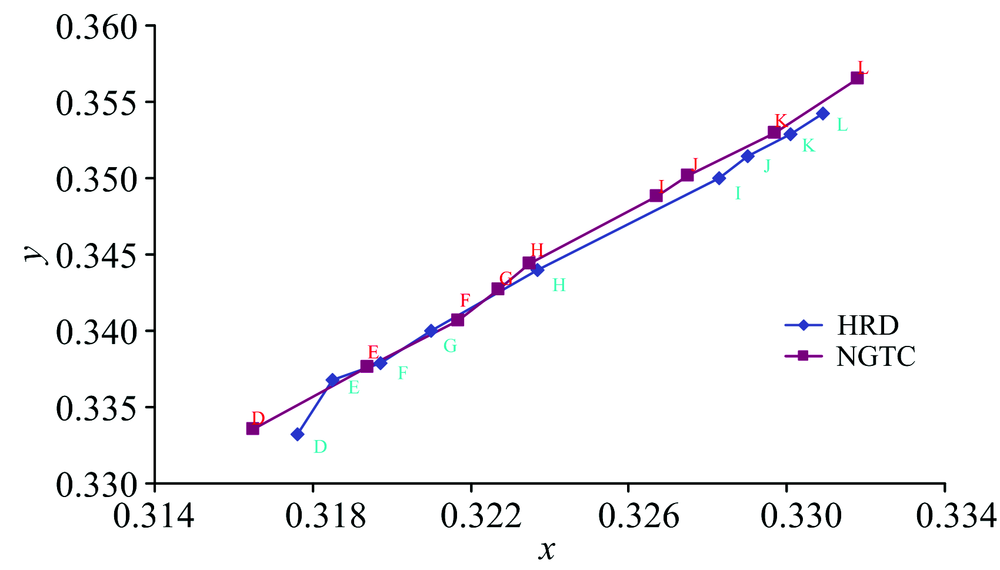
From Figure 6, the test results indicated that it was dramatically different from a set of master diamonds to anther set. Although the numerical results of each set were linear, there was a big difference in series of colorimetric stones, especially, the result of the same color level of different sets and uniformity of each set of stones. The same grading stones with different colors like this maybe will bring a big problem to test laboratories. In order to solve the problem, the method provided a suitable idea to avoid the problem, which was to make the numerical value more uniform, as shown in table 4 and figure 7, before and after simulation. Linear fitting formula was y=1.439 2X-0.121 7. This simulation had a guiding significance for the choice of the diamond master set, through the color data, it could be more accurate to select the more uniform diamond master set.
| Table 4 The actual measurement results and the simulation results of equal distance between different colors |
 | Fig.7 The results of the actual measurement of the mater stones and the simulation results after equal distance treated |
(1) By using the micro area accurate positioning method, selected the common features of the diamond pavilion measurement area, which could eliminate the error of the same color grade diamond due to the size.
(2) The method was employed to test several diamond master sets with different sizes and different color levels. The results showed that the method can accurately distinguish the color grading of the diamond.
(3) The method can be tried to be used as an efficient verification technology of the traditional visible test method in future.
The authors have declared that no competing interests exist.
| [1] |
|
| [2] |
|
| [3] |
|
| [4] |
|
| [5] |
|
| [6] |
|
| [7] |
|
| [8] |
|
| [9] |
|
| [10] |
|