基于改进的两维Otsu管道红外图像高温区域分割研究
[邵磊 , 张一鸣, 李季
* , 刘宏利, 陈小奇, 于晓* ]
, 张一鸣, 李季]
|
|


石化管道通常可分为常温区域和高温区域两部分。 高温区域的存在影响着整个系统的安全运行, 热量的散失将会引起资源的浪费及环境的污染等一系列问题。 红外光谱图像能够较好地描述石化管道的高温区域, 但是如何从中提取高温区域是红外光谱图像处理的一类难题。 为实现从红外图像中, 将高温区域准确快速分割出来的目的, 基于经典的一维Otsu算法提出一种改进的二维多阈值自动获取方法。 该算法首先对管道红外图像进行经典单阈值分割, 将图像划分为背景和管道两部分。 然后基于管道图像区域, 以管道灰度图像与平均值图像作为图像二维,对目标图像进行二维双阈值分割, 最终将较大的阈值作为划分管道常温区域与高温区域的分割点。 将本算法对不同的管线进行多次试验分析, 结果表明, 采用改进的二维Otsu多阈值算法能够更加清晰的将管道从复杂背景中提取出来, 并在此基础上把高温区域更精确的分割。
Biography: SHAO Lei,(1973-), Associate professor of Tianjin University of Technology email: shaol_tjut@163.com
The petrochemical pipeline can usually be divided into the normal temperature region and the high temperature region. The existence of high temperature region affects the safe operation of the whole system, and the loss of heat will cause a series of problems, such as the waste of resources and the pollution of the environment. For the realization of quickly and accurately separating the high temperature region from the infrared image, based on the basic one-dimensional Otsu algorithm we propose an improved two-dimensional multi threshold method. First, the algorithm divides the infrared image of pipeline into two parts: background and pipeline through classical single threshold segmentation. Then, based on the image region of the pipeline, the two thresholds of the target image are divided by the two dimensional image of the pipeline gray image and the average value image, and the larger threshold is finally taken as the segmentation point of the normal temperature region and the high temperature region. We analyze the different pipeline for several tests. The results show that the improved two-dimensional Otsu threshold algorithm can extract the pipeline from complex background more clearly, and on the basis of the step segment the high temperature region more accurately.
As the key step of image processing and analysis, image segmentation is widely used in industrial production, computer vision and so on[1, 2]. The leading methods involve threshold segmentation[3], region segmentation[4, 5] and edge segmentation[6, 7]. Among these fashions, automatic threshold segmentation which was introduced by Nobuyuki Otsu has an extensive use because of its wonderful stability and adaptability.
Actually, we can get infrared pictures with temperature information by infrared thermograph which monitors the temperature of outdoor pipeline, but infrared images tend to exist intricate background, thus extracting the high temperature region is not easy. Aimed at this problem, a number of domestic and foreign scholars have done thorough researches. In 2014, Zhang Lanyong and his partners presented an improved Otsu algorithm using genetic algorithms for infrared dim target detection[8]. For the problems in Two-Dimensional image threshold segmentation such as being time consuming, low accuracy and being easy to produce false segmentation image, Zhou Chenhang proposed a novel image segmentation algorithm that combines improved Firefly Algorithm with Two-Dimensional Otsu(2-D Otsu) in 2015[9]. In the same year, an iterative thresholding based on 2D improved Otsu method using a novel threshold value recognition function was proposed to find the optimum threshold value in different types of histograms and separate into two classes[10]. And Zhang Zhenjie introduced a method for extracting high temperature region of petrochemical insulation pipeline which is based on threshold segmentation[11]. He successfully segmented the normal and high temperature region of the thermal insulation pipeline, which fulfilled the need of actual engineering. But for it, there still exists the problem of unclear pipe profile. In 2016, Gong Yuxi presented an improved Canny algorithm based on adaptive two-dimensional Otsu and Newton Iterative to solve the contradiction between the noise filtering and edge maintenance[12]. In 2017, Pan Jianjia employed the simplified swarm optimization (SSO) as a swarm-intelligent optimization method to search the threshold value based on 2D Otsu method[13]. In the identical year, Song Tao and others introduced an improved k-means clustering algorithm for image segmentation aiming at the defects of the pipeline. They showed that using quick Otsu-Kmeans for image segmentation is more suitable for the segmentation of pipeline defect images than Otsu and region growing[14]. And Sa Jiming and his partners suggested an improved thresholding segmentation approach based on the maximum variance algorithm for the problem that the threshold calculation is too low that leads to an undesirable performance in terms of segmenting the target from the background in 2017[15]. We can also improve it for the handling of complex background target.
We combine the one-dimensional Otsu algorithm and two-dimensional Otsu algorithm, and then suggest a kind of modified two-dimensional Otsu algorithm. We finish the determination of the self-adaptive multi-threshold, apply it into pipeline image segmentation, and get good segmentation effect.
The paper is based on the one-dimensional and two-dimensional Otsu algorithm, and we select the thresholds of the two dimension (gray scale and average gray scale of the neighborhood k× k) of the establishing two-dimensional distribution histogram separately twice. First we segment the target and the background region, and eliminate complex backgrounds and pipelines. Second we segment the target pipeline region, and pick up the high temperature region.
Nobuyuki Otsu, a Japanese scholar, proposed the Otsu algorithm originally. According to the one-dimensional histogram of the image, we look for the maximum between-cluster variance of the target and background, and determine the best threshold value. This method is effective for most infrared images in segmentation.
The method of one-dimensional Otsu automatically acquiring the threshold is as follows: Let a gray level of an image be G, the gray value in the picture is (0, 1, 2, …, G-1); the number of pixels with a gray value of i is ni, as a result, the probability pi of the occurrence of the total number of pixels N and the gray value i respectively are
We divide the image into two categories by using the gray value t as the threshold value. The first class G0 (0, 1, …, t), that is, the lower temperature area in the pipeline image; the second category G1(t+1, t+2, …, g), that is, the higher temperature area in the pipeline image. The probability ω of the occurrence of these two regions and the average gray value μ of these two regions respectively are
The average gray level μ of the whole picture is
Between-class variance σ 2 of the two kind regions is
Under Otsu’ s maximum inter-class variance criterion, when
Traditional two-dimensional Otsu algorithm establishes on the basics of one-dimensional Otsu algorithm. It is a slightly improved threshold determination method that points at the problem of one-dimensional gray histogram having or not obvious peaks and troughs. The method of traditional two-dimensional Otsu algorithm obtaining a threshold automatically is as follows:
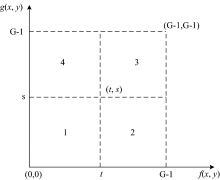
In a gray image of size M× N, we define each pixel point in the image by the coordinate point (x, y), the gray value of each pixel point is represented by f(x, y), and the average gray value of the 3× 3 neighborhood of the pixel point (x, y) is represented by g(x, y). Therefore, the relationship between g(x, y) and f(x, y) is shown in formula (6).
Among this formula, 0< x+m< M, 0< y+n< N. In the square area which is defined by image grayscale g* g, we make g(x, y) and f(x, y) as two axes in two-dimensional Otsu distribution histogram. Then any point in the coordinate plane is represented by a binary group (i, j), and the frequency number of the occurrences of the binary group is represented by Cij. As shown in formula (7), and we can get the rate Pij of the binary group.
As suggested in the figure 1, we let the binary group (i, j) as the independent variable, let the rate Pij of the occurrences of the binary group as the dependent variable, establish two-dimensional gray histogram, choose a point (t, s) in the histogram as the threshold value point and cut the whole two-dimensional plane into four parts. In the picture, the diagonal region 1, 3 respectively represents the image’ s target and background, and the region 2, 4 away from the diagonal line represents other interference factors such as noise in the image. And we can ignore these noises in the infrared image.
 | Fig.1 Two-dimensional histogram |
We determine the points (t, s) in the histogram, the region 1 is C0 and the region 3 is C1. Based on the one-dimensional Otsu, we can get the probability ω of the occurrences of the two regions and the mean gray value μ of the two axes of the two regions
The total average of the whole image on the two axes is
The inter-class variance σ 2 of two kind regions is
Under Otsu’ s maximum inter-class variance criterion, when
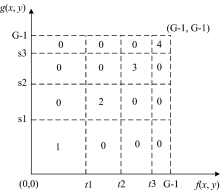
The target and outline of the image segmented by one-dimensional Otsu algorithm are clear and obvious; the target segmented by two-dimensional Otsu algorithm is more precise and specific, accordingly, we propose an improved two-dimensional Otsu algorithm. Predominantly, we extract the target contour accurately and eliminate the background interference. Then we make the threshold segmentation to the target area and divide the area into normal region, a little high temperature region and very high temperature region. The improved two-dimensional multi-threshold Otsu algorithm histogram picture is shown in figure 2.
 | Fig.2 The improved two-dimensional distribution histogram |
Under the characteristics of infrared image histogram, the areas closing to the leading diagonal 1, 2, 3, 4 respectively are background region, target normal temperature region, a little high temperature target region and very high temperature target region. The points away from the main diagonal are the noise region of image, and the influence of this area on our image is minimal and negligible.
Combined with the characteristics of actual pipeline high temperature region, according to the expression of this algorithm, we always use temperature grade W instead of image gray value G to illustrate. As for a pipeline image of size M× N, we still use coordinate (x, y) to represent the temperature of each point, and use f(x, y) to represent the temperature value of this point, use g(x, y) to represent the average temperature of the neighborhood 3× 3 of the point (x, y). Formula (6) still exists, any points’ temperature (i, j) in histogram, its occurrence times Cij and probability Pij all reference to traditional two-dimensional Otsu algorithm.
The improved algorithm firstly uses gray image and traditional Otsu algorithm; confirms the initial necessary segmentation threshold value t1 and finishes threshold segmentation. Based on the segmentation result, we extract the target area (the first region) and achieve the function of eliminating background interference. Then about the two-dimensional distribution histogram with the temperature dimension f(x, y) and mean value dimension g(x, y) of the target region we apply one-dimensional double threshold Otsu algorithm to manage two dimensions and obtain the best thresholds— the temperature dimension t2, t3 and the average temperature dimension s2, s3— for the second time. Finding the corresponding points (t2, s2) and (t3, s3) in the two-dimensional histogram, we complete accurate segmentation for the target high temperature region and divide the target region into the normal temperature (the second region), the high temperature (the third region) and the higher temperature (the forth region) through double threshold.
The method of getting double threshold in two dimensions is same and we illustrate it by temperature dimension. Under the traditional Otsu algorithm and the formula (1)— (5), the temperature value of the target region is (t1, t1+1, …, W-1); the number of pixels with the temperature value of i is ni, as a result, the probability pi of the occurrence of the total number of pixels N and the temperature value i respectively are
Using the temperature t2, t3 as threshold cut the target region image into three parts. The first kind W0 is (t1, t1+1, …, t2), as the normal temperature region of pipeline; the second kind W1 is (t2+1, t2+2, …, t3), as the high temperature region of pipeline; the third kind W2 is (t3+1, t3+2, …, W-1), as the high temperature region of pipeline. The probability ω of the occurrence of the three parts and their corresponding average gray value μ are
The mean temperature value of the entire image is
The inter-class variance σ 2 of three kinds of regions is
Under Otsu’ s maximum inter-class variance criterion, when
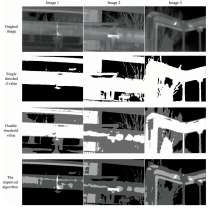
Our experiments choose three kinds of pipeline image with different complex backgrounds and different high temperature areas, and the experimental results and other threshold methods comparison are shown in figure 3.
 | Fig.3 Segmentation images of three methods |
In figure 3, the white area is our final extracting high temperature target region. We can find that single threshold algorithm can only make a rough division of the pipeline and the background and cannot extract the high temperature region; although double threshold algorithm can divide pipeline more accurately than single threshold algorithm, it also cannot extract the high temperature region accurately; the algorithm in our paper can extract the high temperature region more accurately than the other two methods and the pipeline is well divided from the complex background.
Among the test result, we have also carried out quantitative experiments and used the true positive rate and the false positive rate for data analysis and evaluation of target acquisition results, and the results are shown in Table 1. From the table we can know that the true positive rates of the segmentation results of single threshold and double threshold are all 1, which illustrates that the detected area contains all the targets. But the false positive rates of these two methods are relatively high, the average false positive rate of single threshold is 0.558 9, and the average false positive rate of double threshold is 0.335 8. The results show that the miss electing target area of the two algorithms is large and unable to extract the contour of the target well. Although the average true positive rate of this algorithm is 0.841 2, the average false positive rate is 0.000 2. The data show that the algorithm in this paper not only ensures high coincidence between the extracted high temperature region and the real region, but also the area of miss electing background is close to zero. We realize the more accurate segmentation of high temperature target region.
| Table 1 Quantitative experiment of three methods |
The paper studies the basic one-dimensional Otsu and two-dimensional Otsu algorithm; we present an improved multi-threshold maximum inter-class variance algorithm on this base and apply it into high temperature region segmentation of pipeline infrared image in complex background. The improved method proposed in this paper combines the simplicity of one-dimensional single-threshold Otsu algorithm and the segmentation accuracy of interrelated multidimensional information of the two-dimensional Otsu algorithm. We can more accurately distinguish the desired high temperature region of pipeline. The experimental results show that the improved method that the paper proposed can segment the target and the complex background region better than traditional one, distinguish the pipeline target and complex background, and meanwhile, it can extract the high temperature area part and higher temperature area part of the pipeline clearly.
The authors have declared that no competing interests exist.
| [1] |
|
| [2] |
|
| [3] |
|
| [4] |
|
| [5] |
|
| [6] |
|
| [7] |
|
| [8] |
|
| [9] |
|
| [10] |
|
| [11] |
|
| [12] |
|
| [13] |
|
| [14] |
|
| [15] |
|