
基于二维相关技术的氯吡脲拉曼光谱分析
[卢丹1  , 赵武奇
, 赵武奇1, * , 高贵田1, 2 , 孟永宏1 , 曾祥媛1 , 吴妮1 , 雷玉山2 ]
, 赵武奇, 高贵田|
|


作者简介: 卢 丹, 1993年生, 陕西师范大学食品工程与营养科学学院硕士研究生 E-mail: 597533561@qq.com
氯吡脲作为一种苯脲类生长调节剂, 被广泛应用于果蔬中, 但是氯吡脲若过量使用, 会严重影响果蔬的内在质量, 且摄入过多会影响人的身体健康。 现有的检测方法, 虽然技术上成熟、 精度高, 但技术条件要求高、 样品预处理过程复杂、 耗时、 检测费用高。 利用二维相关拉曼光谱技术对乙酸乙酯中氯吡脲的浓度变化进行检测研究, 建立一种灵敏、 快速、 高效的检测果蔬中氯吡脲的技术提供理论基础, 对食品安全具有重大意义。 采集氯吡脲粉末的拉曼光谱图, 结合氯吡脲分子的结构图可对拉曼光谱谱图中的峰进行归属。 配置浓度分别为2.5, 5.0, 7.5, 10.0, 12.5, 15.0, 17.5和20.0 g·L-1的氯吡脲乙酸乙酯溶液并采集拉曼光谱, 对不同浓度的氯吡脲乙酸乙酯溶液的光谱数据进行二维相关分析, 得到氯吡脲的拉曼二维相关同步谱图和异步谱图, 分析同步谱图得出842, 992, 1 044, 1 442和1 604 cm-1的几处交叉峰具有协同作用, 随着氯吡脲浓度的升高而升高; 分析异步谱图得出交叉峰敏感性为1 044 cm-1>992 cm-1>842 cm-1, 1 735 cm-1>1 604 cm-1>1 442 cm-1, 842 cm-1>1 735 cm-1。 结果表明, 乙酸乙酯中氯吡脲的拉曼特征吸收峰分别为842, 992, 1 044, 1 442, 1 604和1 735 cm-1, 其中1 044 cm-1(苯环的环伸缩振动)、 992 cm-1(吡啶环的环呼吸振动)、 842 cm-1(C—O—N假对称的伸缩振动)、 1 735 cm-1(C=O伸缩振动)对氯吡脲浓度变化比较敏感, 敏感度顺序为苯环的环伸缩振动>吡啶环的环呼吸振动>C—O—N假对称的伸缩振动>C=O 伸缩振动>多个耦合峰的C=C伸缩振动>C—H的变形振动。 拉曼光谱与二维相关技术相结合可以准确地反映出氯吡脲随浓度变化, 为果蔬中氯吡脲含量的检测奠定了理论基础。
As a kind of Benzourea, Forchlorfenuronis widely used to regulate the growth of fruits and vegetables. However, excessive use of Forchlorfenuron extremely hinders the growth of agricultural products. The residual Forchlorfenuron taken by humans also leads to damage of health. Various technologies were limited to fulfil both high accuracy and low cost in detecting Forchlorfenuron, so simple and time-saving technologies need to be developed. In this paper, highly sensitive and efficient Raman spectroscopy based on two-dimensional correlation technique were applied to detect the concentration change of Forchlorfenuron in ethyl acetate solution. The development of this technology provided theoretical basis of relevant analysis method for detecting Forchlorfenuron, which has a great influence on food safety. Raman spectrogram of Forchlorfenuron powders and its formula were used to analyze the Raman peaks. Different concentration of 2.5, 5.0, 7.5, 10.0, 12.5, 15.0, 17.5, 20.0 g·L-1 Forchlorfenuron in ethyl acetate solution were also tested to analyze the relationship of Raman peaks with the concentration change by using the synchronous and asynchronous spectroscopy of Forchlorfenuron. The result of synchronous showed that a synergetic effect of the peaks occurred at 842, 992, 1 044, 1 442, 1 604 cm-1 and the intensity of peaks increased with the rise of Forchlorfenuron concentration. Meanwhile, The results of asynchronous spectroscopy showed that the sensitivity of peaks had the following relationship: 1 044 cm-1>992 cm-1>842 cm-1, 1 735 cm-1>1 604 cm-1>1 442 cm-1, 842 cm-1>1 735 cm-1. Raman characteristic absorption peaks of Forchlorfenuron in ethyl acetatesolution were determined to be 842, 992, 1 044, 1 442, 1 604 and 1 735 cm-1, respectively, among which the peaks at 1 044 cm-1 (stretching vibration of benzene), 992 cm-1 (breathing vibration of pyridine), 842 (C—N—O asymmetrical stretching vibration) and 1 735 cm-1 (C=O stretching vibration)were more sensitive to the concentration of Forchlorfenuron and the sensitive order were stretching vibration of benzene, breathing vibration of pyridine, C—N—O asymmetrical stretching vibration, C=O stretching vibration, C=C stretching vibration of various coupling peaks and C—H deformation vibration. Such a combination of Raman spectroscopy based on two-dimensional correlation technique could exactly analyze the concentration change of Forchlorfenuron in ethyl acetatesolution, which will provide a new idea and method for the detection of Forchlorfenuroncontent in fruits and vegetables.
氯吡脲被广泛应用于水果蔬菜和粮食作物[1], 但是氯吡脲的滥用会使果实生苦味[2], 影响人体健康[3]。 目前对氯吡脲的检测方法存在技术条件要求高、 预处理过程复杂、 耗时、 费用高等缺点。 拉曼光谱可用于现场实时快速检测[4], 具有灵敏、 快速、 高效的特点。 二维相关光谱技术能对各个特征峰和官能团的研究, 具有较高的光学分辨率, 可以有效地解析弱峰、 偏移峰和覆盖峰[5, 6, 7]。 赵丽君等[8]利用二维相关中红外光谱技术对正己烷中的邻苯二甲酸二丁酯进行研究, 为食品中塑化剂含量的检测提供了方法; Yang等[9]利用二维近红外光谱和中红外光谱以及NPLS-DA对掺杂牛奶进行有效判别分析。 本文将拉曼光谱技术与二维相关技术结合对氯吡脲进行研究, 为果蔬中氯吡脲的快速检测提供新的思路和方法, 对食品安全具有重大意义。
英国雷尼绍公司的显微共聚焦拉曼光谱仪。 光谱采集范围为100~2 000 cm-1, 532 nm激发器, 曝光时间10 s, 激光强度1 %。
氯吡脲购于美国sigma公司, 乙酸乙酯购于天津科密欧公司。
固体氯吡脲拉曼光谱采集: 取适量氯吡脲标准品粉末置于载玻片上, 为利于显微聚焦将其压平, 采集拉曼光谱信号。 液体氯吡脲拉曼光谱采集: 将氯吡脲溶于乙酸乙酯中, 涡旋振荡15 min, 超声20 min, 配制成一系列不同浓度的氯吡脲/乙酸乙酯溶液。 将含氯吡脲的已酸乙酯溶液装入毛细管固定在载玻片上后, 采集拉曼信号。
以氯吡脲浓度作为微扰量, 得到氯吡脲的动态拉曼光谱, 利用Noda教授编写的软件得到二维相关分析的结果。 二维谱图等高线层数设为8。
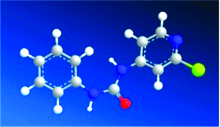
氯吡脲的分子式为C12H10ClN3O, 其分子结构图如图1所示, 从图1中可知, 氯吡脲分子结构由苯环, 吡啶环和酰胺基团组成, 其中含有C— H, C=C, N— H, C— N, C=O, C=N, C— Cl等官能团。 不同的官能团具有不同的拉曼振动频率, 可以根据不同的振动频率对氯吡脲的拉曼峰进行归属, 以寻找出氯吡脲的拉曼特征峰。
 | 图1 氯吡脲分子结构模型Fig.1 Forchlorfenuron molecular structure diagram |
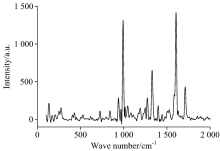
图2是固体氯吡脲的拉曼光谱图。 图3为不同浓度氯吡脲乙酸乙酯的拉曼光谱对比图。 结合图2, 排除图3中波数在380, 632, 781和1 452 cm-1等几个峰为氯吡脲的拉曼峰。 从图3中可以看出, 波数在842, 992, 1 044, 1 442, 1 604和1 735 cm-1处有明显的拉曼峰, 但随着氯吡脲浓度的变化, 拉曼光谱图只有在1 604 cm-1处的峰值有人眼可分辨的明显变化。 结合图1氯吡脲的结构图, 842 cm-1处为C— O— N假对称的伸缩振动, 992 cm-1处为吡啶环的环呼吸振动, 1 044 cm-1处为苯环的环伸缩振动, 1 442 cm-1处为C— H的变形振动, 1 604 cm-1处为多个耦合峰的C=C伸缩振动, 1 735 cm-1处为C=O伸缩振动。
 | 图2 氯吡脲的拉曼光谱谱图Fig.2 Raman spectroscopy of Forchlorfenuron |
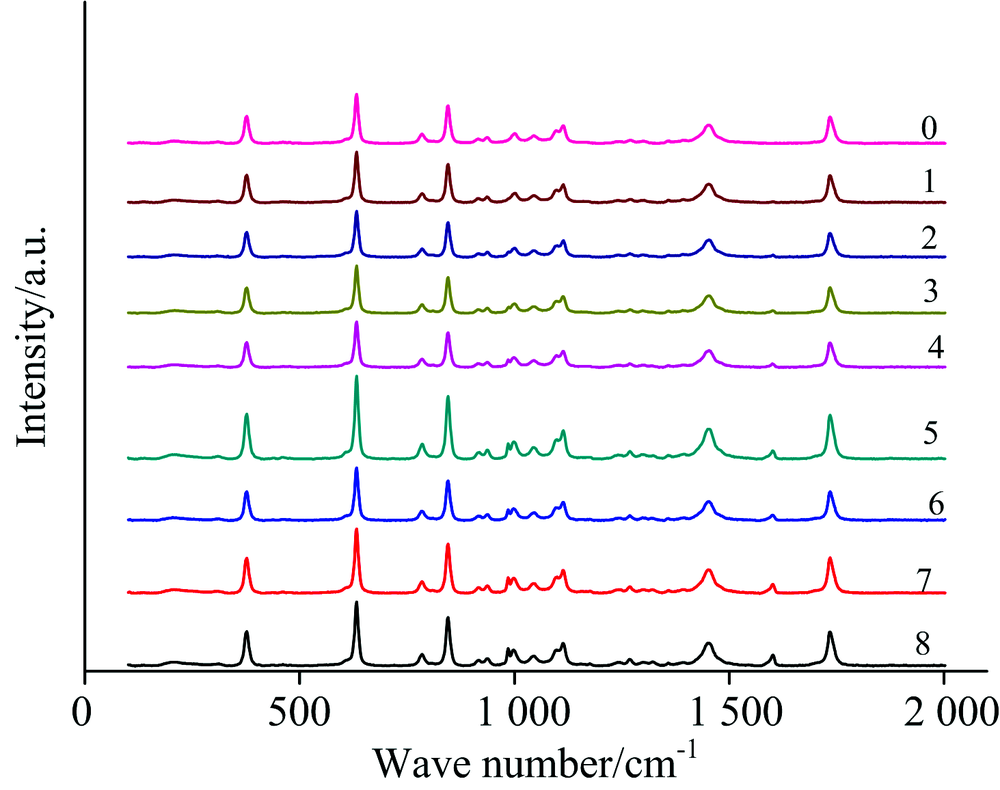 | 图3 不同浓度氯吡脲乙酸乙酯的拉曼光谱图Fig.3 Raman spectroscopy of different concentrion of Forchlorfenuron inserted ethyl acetate solution 0: 0; 1: 2.5 g· L-1; 2: 5.0 g· L-1; 3: 7.5 g· L-1; 4: 10.0 g· L-1; 5: 12.5 g· L-1; 6: 15.0 g· L-1; 7: 17.5 g· L-1; 8: 20.0 g· L-1 |
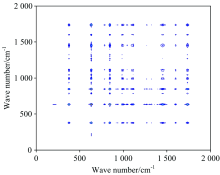
图4为在02 000 cm-1拉曼波段下的二维相关同步图, 从图4中可以看出842, 992, 1 044, 1 442和1 604 cm-1处存在较强的自吸收峰。 (842, 992), (842, 1 044), (842, 1 442), (842, 1 604), (842, 1 735), (992, 1 044), (992, 1 442), (992, 1 604), (992, 1 735)(1 044, 1 442), (1 044, 1 604), (1 044, 1 735), (1 442, 1 604), (1 442, 1 735)和(1 604, 1 735)均为正值, 说明这些峰之间具有协同作用, 随着氯吡脲浓度的升高而升高。
 | 图4 氯吡脲的拉曼二维相关同步谱图Fig.4 2D-correlation Raman synchronous spectroscopy of Forchlorfenuron |
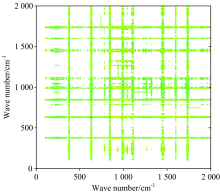
图5为在02 000 cm-1拉曼波段下的二维相关异步图, 图5中交叉峰(992, 842), (1 044, 842), (1 044, 992), (1 604, 1 442), (1 735, 1 442)和(1 735, 1 604)均为正值, 可以判断敏感性1 044 cm-1> 992 cm-1> 842 cm-1, 1 735cm-1> 1 604 cm-1> 1 442 cm-1, 根据交叉峰(1 735, 842)为负值, 可以判断842 cm-1> 1 735 cm-1, 即1 044 cm-1> 992 cm-1> 842 cm-1> 1 735 cm-1> 1 604 cm-1> 1 442 cm-1, 所以随着氯吡脲浓度的变化, 各个官能团灵敏度的顺序为苯环的环伸缩振动> 吡啶环的环呼吸振动> C— O— N假对称的伸缩振动> C=O伸缩振动> 多个耦合峰的C=C伸缩振动> C— H的变形振动。
 | 图5 氯吡脲的拉曼二维相关异步谱图Fig.5 2D-correlation Raman asynchronous spectroscopy of Forchlorfenuron |
利用拉曼光谱技术对乙酸乙酯中的氯吡脲进行检测, 得到4002 000 cm-1的波谱信息, 获得一些明显的吸收峰, 结合二维相关光谱进行分析, 得到拉曼光谱中1 044 cm-1(苯环的环伸缩振动)、 992 cm-1(吡啶环的环呼吸振动)、 842 cm-1(C— O— N假对称的伸缩振动)和1 735 cm-1(C=O伸缩振动)对氯吡脲浓度变化比较敏感。 拉曼光谱技术与二维相关技术结合能够较准确地分析氯吡脲, 这不仅为检测氯吡脲提供了理论依据, 也为检测果蔬中氯吡脲残留提供了新的思路和方法。
The authors have declared that no competing interests exist.
| [1] |
|
| [2] |
|
| [3] |
|
| [4] |
|
| [5] |
|
| [6] |
|
| [7] |
|
| [8] |
|
| [9] |
|