


样品温度对纳秒激光诱导Cu等离子体特征参数的影响
[王莉 , 傅院霞, 徐丽, 宫昊, 荣长春]
, 傅院霞, 徐丽, 宫昊, 荣长春]
|
|


作者简介: 王 莉, 女, 1987年生, 蚌埠学院理学院讲师 e-mail: wangli8710@163.com
为了研究样品温度对激光诱导击穿Cu等离子体特征参数的影响, 以黄铜为研究对象, 在优化的实验条件下采用波长为532 nm的Nd∶YAG纳秒脉冲激光诱导激发不同温度下的块状黄铜, 测量了Cu等离子体的特征谱线强度和信噪比; 同时在局部热平衡条件下利用Boltzmann斜线法和Stark展宽法分析计算了不同的样品温度条件下等离子体电子温度和电子密度。 实验结果表明, 在激光功率为60 mW时, 随着样品温度的升高, Cu的特征谱线强度和信噪比逐渐增加, 样品温度为130 ℃时达到最大值, 然后趋于饱和。 计算表明, 黄铜样品中Cu元素Cu Ⅰ 329.05 nm, Cu Ⅰ 427.51 nm, Cu Ⅰ 458.71 nm, Cu Ⅰ 510.55 nm, Cu Ⅰ 515.32 nm, Cu Ⅰ 521.82 nm, Cu Ⅰ 529.25 nm, Cu Ⅰ 578.21 nm八条谱线在130℃的相对强度相较于室温(18 ℃)下分别提高了11.55倍、 4.53倍、 4.72倍, 3.31倍、 4.47倍、 4.60倍、 4.25倍、 4.55倍, 光谱信噪比分别增大了1.35倍, 2.29倍、 1.76倍、 2.50倍、 2.45倍、 2.28倍、 2.50倍, 2.53倍。 分析认为, 升高样品温度会增大样品的烧蚀质量, 相对于温度较低状态增加了等离子体中样品粒子浓度, 进而提高等离子体发射光谱强度。 所以, 适当升高样品温度能够提高谱线强度和信噪比, 从而增强LIBS技术检测分析光谱微弱信号的测量精度, 改善痕量元素的检测灵敏度。 同时研究了改变样品温度时等离子体电子温度和电子密度的变化趋势。 计算表明, 当样品温度从室温上升到130 ℃的过程中, 等离子体的电子温度由4 723 K上升到7 121 K时基本不再变化。 这种变化规律与发射谱线强度和信噪比变化趋势一致。 分析认为, 这主要是由于在升高样品温度的初始阶段, 激光烧蚀量增大, 等离子体内能增大, 从而导致等离子体电子温度升高。 当激光烧蚀样品的量达到一定值后不再变化, 激光能量被激发溅射出来的样品蒸发物以及尘粒的吸收、 散射和反射, 导致激光能量密度降低, 电子温度趋于饱和, 达到某种动态平衡。 选用一条Cu原子谱线(324.75 nm)的Stark展宽系数计算激光等离子体的电子密度, 同时研究改变样品温度时等离子电子密度的变化趋势, 计算表明在样品温度为130 ℃时, Cu Ⅰ 324.75 nm对应的等离子电子密度相较于室温(18 ℃)条件下增大了1.74×1017 cm-3。 该变化趋势与电子温度的变化趋势一致。 适当升高样品温度使得电子密度增大, 从而提高电子和原子的碰撞几率, 激发更多的原子, 这是增强光谱谱线强度的原因之一。 由此可见, 升高样品温度是一种便捷的提高LIBS检测灵敏度的有效手段。
To investigate the influence of sample temperature on the characteristic parameters of laser-induced Cu plasma, brass was used as the study object. A Nd: YAG nanosecond pulsed laser with 532 nm wavelength was adopted under optimized experimental conditions to excite and to induce the breakdown of massive brass under different sample temperatures, and the characteristic spectral line intensity and signal-to-noise ratio of the Cu plasma were measured. The Boltzmann diagonal line and Stark broadening methods were used to analyze and calculate the electron temperature and electron density of the plasma under different sample temperatures. When the laser power was 60 mw, the characteristic spectral line intensity and signal-to-noise ratio of Cu gradually increased as the sample temperature increased and tended to be saturated after reaching maximum values under 130 ℃. The relative intensities of eight spectral lines—Cu Ⅰ 329.05, Cu Ⅰ 427.51, Cu Ⅰ 458.71, Cu Ⅰ 510.55, Cu Ⅰ 515.32, Cu Ⅰ 521.82, Cu Ⅰ 529.25, and Cu Ⅰ 578.21 nm—of Cu in the brass sample increased 11.55, 4.53, 4.72, 3.31, 4.47, 4.60, 4.25, and 4.55 times under 130 ℃ compared with those under room temperature (18 ℃), and the spectral signal-to-noise ratios increased 1.35, 2.29, 1.76, 2.50, 2.45, 2.28, 2.50 and 2.53 times respectively. Elevating the sample temperature would increase the ablation mass of the sample and plasma particle concentration compared with those under relatively low temperature and consequently would enhance the plasma emission spectral intensity. Therefore, appropriately elevating the sample temperature could increase the spectral line intensity and signal-to-noise ratio to enhance the measurement accuracy of LIBS technology in detecting and analyzing weak spectral signals and to improve its detection sensitivity for trace elements. The variation tendency of the electron temperature and electron density with the change of sample temperature was investigated. In the calculation, the electron temperature of the plasma was basically unchanged when it was increased from 4 723 to 7 121 K when the sample temperature increased from room temperature to 130 ℃. This change law was consistent with the variation tendency of the emission line intensity and signal-to-noise ratio. This condition was mainly due to the increase in the laser ablation quantity and internal energy of the plasma at the initial phase of the sample temperature rise, which increased the electron temperature of the plasma. No additional change in the sample quantity under laser ablation was observed after reaching a certain value, and the laser energy was absorbed, scattered, and reflected by excited and sputtered sample evaporants and dust particles; such process reduced the laser energy density. As a result, the electron temperature tended to be saturated, and several dynamic balances were reached. The Stark broadening coefficient of the 324.75 nm Cu atomic spectral line was selected in this study to calculate the electron density of the plasma. The variation tendency of the plasma electron density with the change of sample temperature was evaluated. The plasma electron density that corresponded to Cu Ⅰ 324.75 nm when the sample temperature was 130 ℃ increased by 1.74×1017 cm-3 compared with that under room temperature (18 ℃). This variation tendency was consistent with that of electron temperature. Appropriately elevating the sample temperature increased the electron density and the probability for electron and atom collision, which excited many atoms. This process was one of the reasons for the enhancement of spectral line density. Thus, elevating the sample temperature is a convenient and effective means to improve LIBS detection sensitivity.
激光诱导击穿光谱(laser induced breakdown spectroscopy, LIBS)是一种灵敏度高、 而且能够快速对物质的成分和含量进行检测分析的技术手段。 相较于传统的光谱测量技术, LIBS无需对样品进行预处理就可以实现对多种元素在线快速测量分析。 LIBS凭借自身独特的优势受到国内外学者的高度重视, 目前其主要应用于环境检测[1, 2, 3, 4]、 金属材料分析[5, 6, 7, 8]、 食品检测[9, 10, 11, 12]、 生物医学[13, 14, 15]等领域。 虽然该技术已被广泛用在各大领域, 但是目前LIBS在分析检测低含量元素时面临提高检测灵敏度的挑战。
为了进一步提高LIBS的检测灵敏度和精确度, 陈金忠等[16]在LIBS实验中加入了平面反射镜装置约束等离子体来增强发射光谱强度, 结果表明加入平面反射镜后元素Cr和Pb的含量测定相对标准偏差有所降低, 灵敏度也得到了提高。 王莉等[17]采用双脉冲激光诱导等离子体技术检测AlCl3水溶液中的Al元素的检测限, 实验结果表明DP-LIBS的检测限较于SP-LIBS检测限提高了一倍。 Banerjee等[18]利用飞秒激光烧蚀样品时发现样品表面形成的等离子强度大于样品内部的等离子体强度, 说明了飞秒激光诱导击穿光谱技术适用于检测样品表面的污染物。
目前有研究表明, 对待测样品加热能够增强激光诱导等离子体光谱线的强度和信噪比, 降低元素检测限[19, 20, 21, 22], 但是较少同时研究在加热待测样品的过程中等离子体的光谱强度和信噪比以及等离子体的电子温度和电子密度。 本工作以黄铜为研究对象, 优化实验参数后, 研究了样品温度对激光诱导等离子体的光谱强度和信噪比的影响, 同时分析了样品温度变化对等离子体的电子温度和电子密度的影响, 讨论了激光诱导等离子体光谱增强的机理。
自建的LIBS装置如图1所示。 其基本组成包括激光器、 光谱仪、 增强型电荷耦合器件(intensified charge coupled device, ICCD)、 耦合光纤, 计算机采集与保存系统。 激光为Nd∶ YAG调Q脉冲激光二倍频532 nm输出, 单脉冲最大输出120 mJ, 脉冲宽度8 ns, 重复频率10 Hz。 样品被放置在JF-956A型恒温加热板平台进行加热, 可以根据需要调节温度, 同时利用红外温度采集器监控样品温度。 脉冲激光(Spectra-Physics, LAB170-10)经过焦距为25 cm透镜垂直聚焦在样品上, 产生的LIBS信号被与样品表面成45° 角、 焦距为15 cm的凹面镜收集并耦合到光纤探头, 再由光纤传输到光谱仪(波长范围: 200~950 nm, 光栅常数为1 200 l· mm-1, 焦距为195 mm, 分辨率0.023 nm)。 信号经光谱仪分光后由ICCD(Princeton, PIMAX1024)把光信号转变成电信号传输到计算机上, 最后由计算机完成信号的处理。
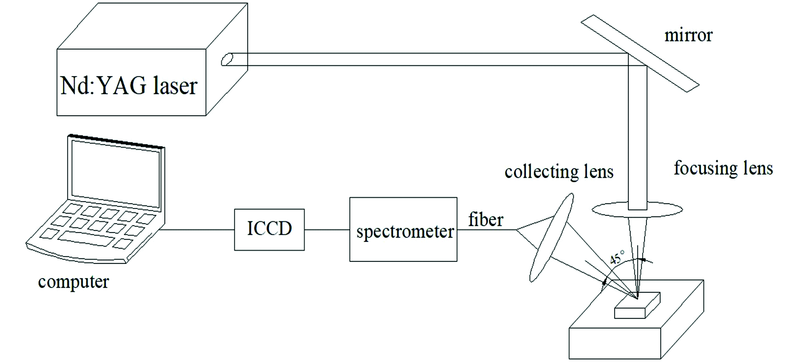 | 图1 LIBS实验装置示意图Fig.1 LIBS experimental setup |
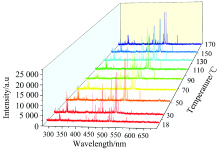
影响LIBS技术灵敏度的两个重要参数是光谱强度和信噪比, 它们是描述等离子体特性的重要指标。 实验中激光脉冲能量密度60 mw, ICCD门宽500 ns, ICCD门延迟1 000 ns, 待测样品温度为30 ℃时获得光谱图如图2所示。 该实验条件下改变样品温度, 获得了波长为300~700 nm的等离子体光谱图如图3所示。 从图3可以看出, 随着样品温度的升高, Cu的特征谱线强度逐渐增加然后趋于饱和。
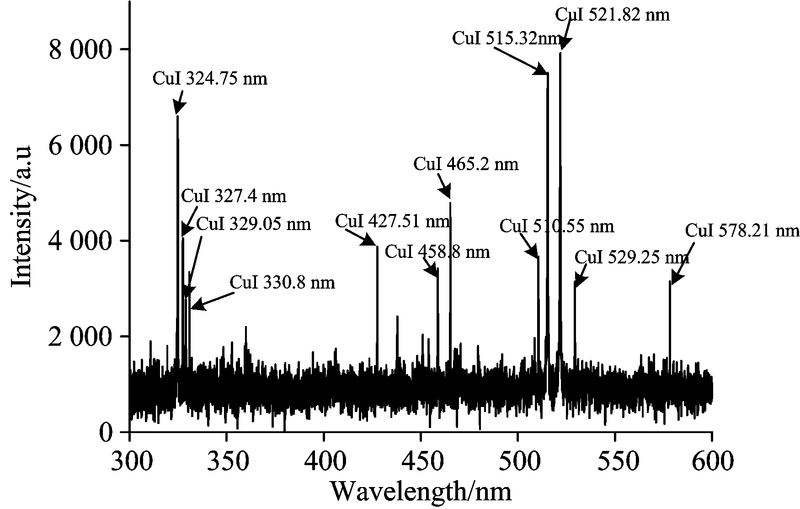 | 图2 样品温度为30 ℃的激光诱导Cu等离子体光谱Fig.2 Emission spectra of Cu plasma at 30 ℃ |
 | 图3 不同样品温度条件下激光诱导Cu等离子体光谱Fig.3 Emission spectra of Cu plasma under different sample temperatures |
定量分析了样品分别在室温(18 ℃), 30, 50, 70, 90, 110, 130, 150和170 ℃条件下, 黄铜样品中Cu元素Cu Ⅰ 329.05 nm, Cu Ⅰ 427.51 nm, Cu Ⅰ 458.71 nm, Cu Ⅰ 510.55 nm, Cu Ⅰ 515.32 nm, Cu Ⅰ 521.82 nm, Cu Ⅰ 529.25 nm, Cu Ⅰ 578.21 nm八条谱线的相对强度和信噪比受样品温度变化的影响, 结果如图4所示。
 | 图4 样品温度对光谱强度和信噪比的影响Fig.4 Influence of sample temperatures on spectral intensity and SNR |
分析图4可知, 在样品温度从常温上升到170 ℃的过程中, 等离子体的谱线强度和信噪比先逐渐增大, 样品温度达到130 ℃时达到最大值, 然后趋于饱和。 计算表明, 谱线强度比室温样品条件下的分别提高了11.55倍、 4.53倍、 4.72倍, 3.31倍、 4.47倍、 4.60倍、 4.25倍、 4.55倍, 光谱信噪比分别增大了1.35倍, 2.29倍、 1.76倍、 2.5倍、 2.45倍、 2.28倍, 2.5倍。 分析认为, 升高样品温度会增大样品的烧蚀质量[19], 相对温度较低状态增加了等离子体中样品粒子浓度, 进而提高等离子体发射光谱强度。 由此可见, 适当升高样品温度能够提高谱线强度和信噪比, 从而增强LIBS技术检测分析光谱微弱信号的测量精度, 改善痕量元素的检测灵敏度。
假设不考虑等离子体的自吸收效应, 同时激光等离子体在演化的过程中满足局部热平衡(LET)条件, 通过测量等离子体中八条元素谱线的相对强度, 利用Boltzmann斜线法求解电子温度[23], 公式为
式(1)中, a和b分别表示特征谱线对应的电子跃迁的上能级和下能级, λ ab和Aab分别是从a能级向b能级的跃迁波长, 跃迁几率, g是a能级的权重因子, I是所测得的发射谱线的相对强度, Ea为a能级激发能量, KB为玻尔兹曼常数。 本实验中选用谱线均为一价离子产生, ln
| 表1 Boltzmann斜线中选用的Cu Ⅰ 谱线的物理参数[24] Table 1 Physical parameters for Cu Ⅰ trasitions used to generate Boltzmann plot[24] |
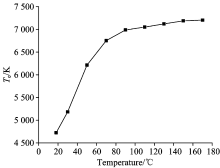
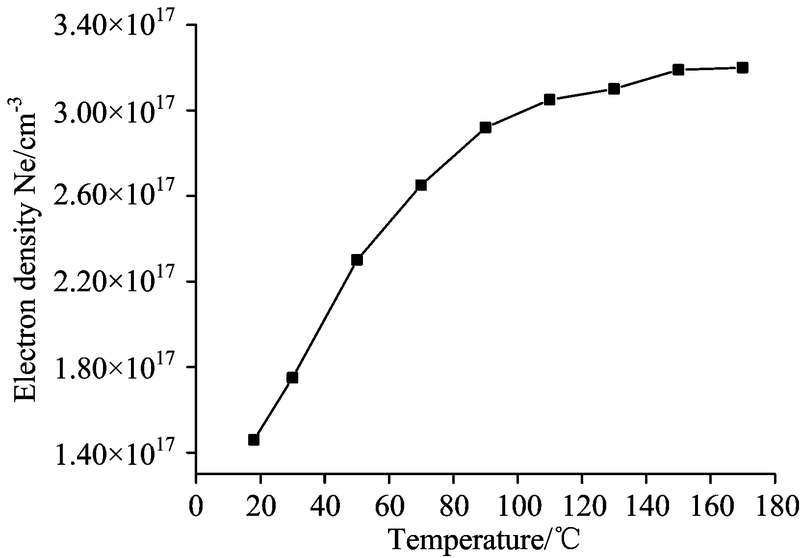
不同样品温度下等离子体电子温度的变化趋势如图5所示。 由图5可知, 升高样品温度时等离子体电子温度也逐渐升高, 当样品温度从18 ℃升到130 ℃的过程中, 等离子体的电子温度由4 723 K上升到7 121 K后基本不再变化。 这种变化规律与前面求得的发射谱线强度和信噪比变化趋势一致。 分析认为, 这主要是由于在升高样品温度的初始阶段, 激光烧蚀量[19]增大, 等离子体内能增大, 从而导致等离子体电子温度升高。 当激光烧蚀样品的量达到一定值后不再变化, 激光能量被激发溅射出来的样品蒸发物以及尘粒的吸收、 散射和反射, 导致激光能量密度降低, 电子温度趋于饱和, 达到某种动态平衡[25]。
 | 图5 样品温度对电子温度的影响Fig.5 Influence of sample temperatures on electron temperarures |
表征等离子体特征的另外一个参数是电子密度, 谱线产生的Stark展宽与等离子体中电子密度有关, 可以通过测量谱线的Stark展宽求解等离子体的电子密度, 公式为[26]
式中: Δ
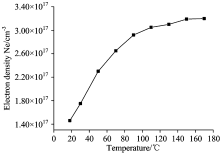
 | 图6 样品温度对电子密度的影响Fig.6 Influence of sample temperatures on electron density |
通过光谱法对等离子体电子温度和电子密度进行计算时, 我们曾假设等离子体在演化的过程中满足局部热平衡条件。 按照McWhirter的标准[27], 建立局部热平衡需要的最小电子密度
式(3)中, Ne为电子密度, Te是电子温度, Δ E原子谱线的最大上下能级差。 利用McWhirter标准判断所得的不同样本温度下等离子体密度最小值均在1015 cm-3数量级, 而实验用Stark展宽所测得的电子密度在1017 cm-3数量级, 远大于McWhirter判据的极限值, 因此整个实验过程处于局部热平衡状态。
在优化的实验条件下适当改变待测样品的温度能够改善光谱质量, 提高谱线强度和信噪比, 从而加强LIBS技术对微弱信号的探测能力; 同时还能够提高等离子体的电子温度、 电子密度, 增强对痕量元素的检测分析能力。 LIBS技术在各大领域都有着广泛的应用, 升高样品温度作为一种便捷的提高LIBS检测灵敏度的有效手段, 将会进一步促进LIBS技术的发展。
The authors have declared that no competing interests exist.
| [1] |
|
| [2] |
|
| [3] |
|
| [4] |
|
| [5] |
|
| [6] |
|
| [7] |
|
| [8] |
|
| [9] |
|
| [10] |
|
| [11] |
|
| [12] |
|
| [13] |
|
| [14] |
|
| [15] |
|
| [16] |
|
| [17] |
|
| [18] |
|
| [19] |
|
| [20] |
|
| [21] |
|
| [22] |
|
| [23] |
|
| [24] |
|
| [25] |
|
| [26] |
|
| [27] |
|