

可调谐半导体激光器的瞬时光谱测量方法研究
[安颖1  , 王春磊
, 王春磊2 ]
, 王春磊|
|


作者简介: 安 颖, 1969年生, 河北科技师范学院机电工程学院副教授 e-mail: ananying@126.com
可调谐半导体激光器在调谐过程中的瞬时光谱特性, 如瞬时的波长、 调谐率、 功率、 线型和线宽等参数影响着以激光器为光源的光学测量和光相干通信系统的精度。 然而, 能够同时测量这些瞬变参数的技术至今未见报道。 提出了一个基于时频分析的测量半导体激光器在调谐过程中瞬时光谱参数的方法, 利用一个短时延外差测量系统, 利用激光器瞬时光谱参数与差拍信号瞬时参数的关系, 最终获得了半导体激光器在连续电流调谐过程中的瞬时光谱。 测量系统采用了10 cm光程差的Mach-Zehnder干涉仪, 调谐电流是幅度为20~120 mA、 频率是1 kHz的锯齿波, 差拍信号可视为直流信号、 载波信号与噪声的叠加, 按照短时延相干光测量原理, 差拍信号中的直流分量幅度的大小反映了激光器输出光信号的功率; 载波信号是一种多项式相位信号, 由其频率可以推算激光器输出光谱的中心频率或波长; 噪声信号则与激光器输出光谱的线型和线宽相关, 通过对噪声信号进行时频分析, 可以获知激光器在连续电流调谐过程中每一时刻或每个电流下的瞬时线型、 线宽。 采用了趋势局部均值分解方法对差拍信号进行了准确分离, 并对分离信号分别进行处理, 同时获知了半导体激光器在调谐过程中的瞬时输出光功率、 光波长、 调谐率及线型、 线宽。 在去掉弛豫部分后截取的整周期差拍信号对应的调谐电流60~115 mA变化范围内, 半导体激光器(FRL15DDR0A31-18950, Furukawa)瞬时输出光功率变化范围是5.16~10.6 mW, 瞬时光波长变化范围为1 579.2~1 579.6 nm; 激光器的瞬时调谐率在0.004 8~0.011 5 nm·mA-1范围内单调变化; 线宽是852.55~954.95 kHz, 呈非线性随机分布。 基于短时延、 局部均值分解和时频分析方法的瞬时光谱参数测量系统可以准确得到各瞬时光谱参数, 测量结果与激光器的静特性相符, 且测量系统结构简单, 使我们更深入地理解激光器的工作原理, 具有广阔的应用前景。
The instantaneous spectral characteristics of semiconductor lasers during the tuning process, such as the instantaneous wavelength, tuning rate, power, line shape, and linewidth, affect the accuracy of optical precision measurements and coherent optical communication systems that use tunable lasers as their light sources. Nevertheless, a method that can measure their performance simultaneously has not yet been reported. The purpose of this paper is to provide a novel method for the measurement of the instantaneous spectral performance of a semiconductor laser using time-frequency analysis. We designed a short-delayed self-heterodyne measuring system, described the time-frequency distributions of a laser’s optical field and the beat signal, determined the relationship between a laser’s instantaneous spectral performance during tuning and the parameters of the beat signal, and obtained the time-varying optical power spectrum of a semiconductor laser under continuous injection current tuning. The proposed short-delayed self-heterodyne measuring system used a Mach-Zehnder interferometer (MZI) with an optical path difference (OPD) of 10 cm. The tunable semiconductor laser (FRL15DDR0A31-18950, Furukawa) was tuned using a sawtooth injection current with an amplitude of 20 to 120 mA and a frequency of 1 kHz. According to the principle of coherent measurement, we considered a beat voltage as a superposed oscillation signal consisting of three components: the DC voltage signal, the noise, and the pure beat signal. The DC signal is directly proportional to the power of the laser. The noise generated from the laser’s phase variation can be used to calculate the linewidth and the line shape of the semiconductor laser. The pure beat signal is a mono-component amplitude and frequency modulation (AM-FM) signal, which can be named the carrier; its frequency is closely related to the wavelength of the laser. Using the trend local mean decomposition method, the instantaneous power, wavelength, tuning rate, and linewidth of a semiconductor laser were confirmed simultaneously during the continuous tuning process. The beat signal cut off the relaxation section is an oscillation with an increasing trend in the voltage as the injection current increases from 60 to 115 mA, in this range of changes, the power grows linearly from 5.16 to 10.6 mW, the wavelength changed linearly from 1 579.2 to 1 579.6 nm during the tuning process, the tuning rate increased from 0.004 8 to 0.011 5 nm·mA-1 and the instantaneous linewidth of the semiconductor laser ranges from 852.55 to 954.95 kHz during the entire duration. The results indicated that the time-varying spectral performance of a semiconductor laser can be obtained more accurately and conveniently. This instantaneous spectral performance measurement method based on the short-delayed self-heterodyne measuring system and time-frequency analysis can help in precisely obtaining the instantaneous characteristics of a semiconductor laser during the tuning process and requires only a simple optical system. This method makes possible a deeper and more fundamental understanding of the dynamic workings of a tunable laser, and we believe it should be widely applied.
可调谐半导体激光器的瞬时调谐光谱特性是指激光器在电流调制过程中光谱随电流变化的瞬时动态特性, 包括瞬时的功率、 波长、 线宽和调谐率, 测量瞬时调谐光谱特性的方法研究对获知半导体激光器的工作特性、 提高以其为光源的系统性能具有非常重要的意义。
近年来, 光外差测量系统被广泛用于激光器的线宽和线型测量, 线宽可以通过差拍信号的功率谱得到, 线型则依赖于差拍信号的相位噪声, 处理差拍信号的方法是傅里叶变换[1, 2, 3, 4, 5, 6, 7, 8, 9]。 然而, 傅里叶变换是忽略时间信息的全局变换, 只能得到给定时间周期上的平均值, 得不到瞬时信息。 实际上, 时频分析方法更适合于处理非线性、 非平稳的差拍信号, 也只有时变功率谱才能反映激光器调制过程中的瞬时光谱信息。 利用时频分析方法, 采用10 cm短光程差的相干光测量方法, 我们已经得到了分布反馈式半导体激光器在50 mA脉冲电流下的瞬时线宽[10]; 随后采用3 km长光程差的非相干光测量技术, 我们也得到了激光器在0~100 mA锯齿波电流调谐过程中的瞬时线宽[11], 尽管两者测量原理原理不同, 但精度都高于傅里叶谱。 但是, 要测量瞬时调谐光谱, 需要同时获知在连续电流调谐过程中的瞬时光功率、 光波长、 光线宽及线型, 现有的测量仪器无法满足要求。 为此, 改进了短时延测量系统, 通过对差拍信号及半导体激光器输出光场信号进行处理, 得到了两者瞬时参数之间的关系, 最终得到了激光器输出光信号的瞬时光谱。
激光器在电流调谐过程中的瞬时输出光谱是一个以瞬时波长为中心频率, 有一定线宽的钟形线型信号, 其幅度、 中心波长均受电流调谐, 是电流的函数, 线宽则呈现随机性, 厘米级短光程差的相干测量中, 谱线线宽与差拍信号中的携带的噪声密切相关。
差拍信号可视为直流信号、 载波信号与噪声的叠加, 需要采用局部均值分解方法[11]进行分离。 其中, 直流分量幅度的大小反映了激光器输出光信号的功率; 载波信号是调幅调频信号, 是一种多项式相位信号, 由其频率可以推算激光器输出光谱的中心频率或波长; 噪声信号则与激光器输出光谱的线宽相关, 通过对噪声信号进行时频分析, 可以获知激光器在连续电流调谐过程中每一时刻或每个电流下的瞬时线宽值。
光程差为10 cm时, 时延是0.33 ns, 此时, 时延产生的锯齿波电流的变化量为Iτ =3.3× 10⁻⁴ mA[12], 半导体激光器的电流调频系数α (i)可以近似为
式(1)中, fB(i)为与电流对应的差拍频率值。 由此, 激光器输出光频率为
式(2)中, f0是在i=i0时, 激光器输出的光频率值。 进一步, 瞬时的调谐率为
将激光器的输出光信号在时频域上表示为E(f, t), 有
式(4)中, ω 0是激光器输出瞬间角频率的中心值; E0为光场强度的稳定数值; α (f, t)表示光场强度的随机波动, 可以忽略不计; (ω 0t+φ (f, t))表示激光器输出光脉冲的相位, φ (f, t)是随机相位波动, 对每个频率是一个均值为零的Gaussian随机过程。
激光器输出信号的能量可以用二阶矩来描述
同时, 差拍电流的时频分布如式(6)
式(6)中, R是探测器的响应度, E为光纤臂输出信号的光场强度的稳定数值, ω r是参考臂在干涉时刻的角频率, ω b(f, t)是差拍载波信号角频率的时频分布, Δ φ (f, t, τ d)=φ (f, t)-φ (f, t-τ d)是时延τ d下差拍信号的相位噪声起伏的时频分布。 短时延时, 两光纤臂输出的信号为完全相干信号, 由此得到的Δ φ (f, t, τ d)可以近似代替式(5)中的Δ φ (f, t, τ ), 即可获知激光器输出光的瞬时线宽。
测量系统中, 差拍信号是经过光电放大探测器转换成电压信号由示波器采样得到的, 接收到的差拍信号的直流电压与输入信号功率之间的关系为
式(7)中, R(λ )是探测器的响应度, GT是转换增益, Fa是输出负载电阻决定的比例系数, 这三个参数是光电放大探测器的固有参数, 而PIN则是输入到光探测器上的功率。 由于时延小于1 ns, 参考臂与干涉臂的激光信号完全相干, 故而每一瞬间探测器上探测的差拍信号功率可以替代同时刻的激光器的输出光功率。
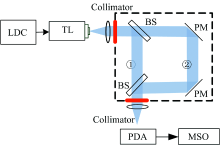
在利用超短时延测量线宽的实验中, 我们发现利用光纤长度差产生时延时, 光纤中的色散会对差拍信号产生一定的影响, 因此采用固定长度的光路产生时延。 测量系统原理图如图1所示。 激光器输出的激光经一个会聚透镜投射在分束器(分光比50∶ 50)上被分成两路光, 其中一路经过两个平面反射镜进行延时, 最后两束光再经一个会聚透镜恰好投射在激光探测器的光敏面上, 光程差为10 cm。
 | 图1 短时延自外差测量系统Fig.1 Short-delayed self-heterodyne measuring system |
光电放大探测器采用PDA10CS-EC, 在1 579~1 582 nm时转换系数约1.03 A/W, 半导体激光器采用FITEL公司的分布反馈半导体激光器, 型号为FRL15DDR0-A31-18950, 中心波长为1 582 nm。 调谐锯齿波电流的频率是1 kHz、 幅值为20~120 mA。
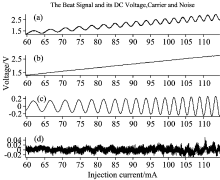
图2(a)是采样得到差拍信号后, 去掉弛豫部分后, 为避免端点效应而截取的整周期的差拍信号, 对应调谐电流变化范围是60~115mA; 图2(b)和图2(c)是采用局部均值分解分离出的直流电压和载波信号; 图2(d)是分离后的噪声。
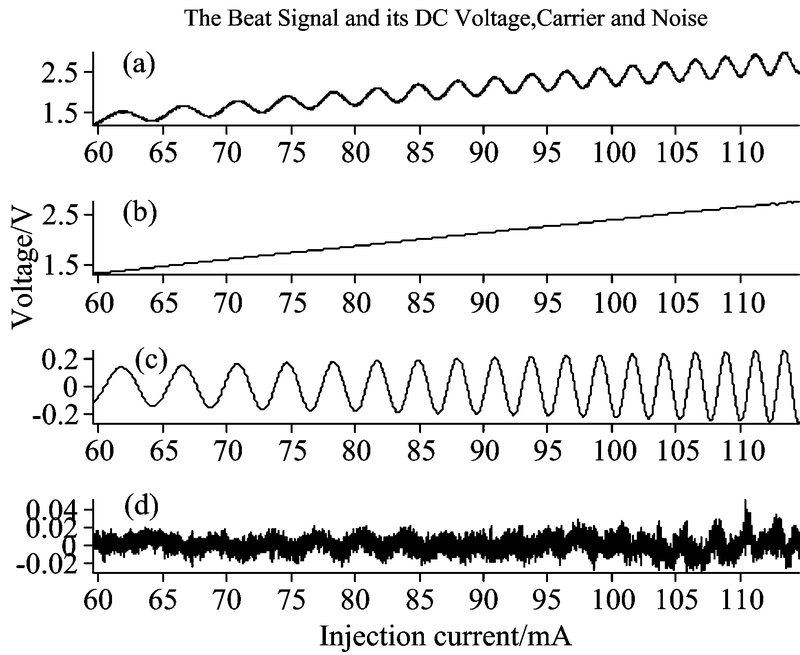 | 图2 差拍信号(a)、直流电压(b)、载波(c)和噪声(d)Fig.2 The beat signal (a), DC voltage (b), carrier (c), and noise (d) |
对噪声进行时频分析, 取归一化时变功率谱的中间-30~30 kHz带宽上的部分如图3所示, 在整个调谐电流上, 中心频率变化范围近6 000 GHz, 为了显示全部电流变化范围内的光谱, 图3中每一时刻的光谱都以零值为中心点。 为了获知瞬时线宽, 将瞬时光谱进行洛伦兹拟合, 图4是80 mA时, 归一化功率谱的光谱分布及其洛伦兹拟合曲线, 得到的瞬时线宽为918 kHz, 光谱分布与洛伦兹函数的相关系数是0.95, 中心波长为1 579.295 5 nm。 其他任意调谐电流上具有相同的形状, 说明在整个电流调谐过程中, 光谱呈洛伦兹线型变化。
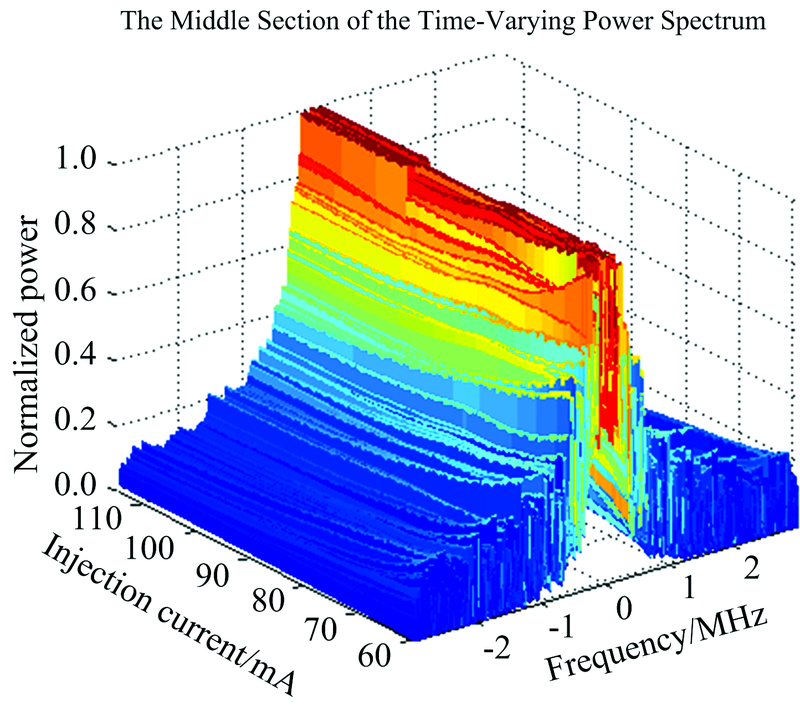 | 图3 时变功率谱的中间部分Fig.3 The middle section of the time-varying power |
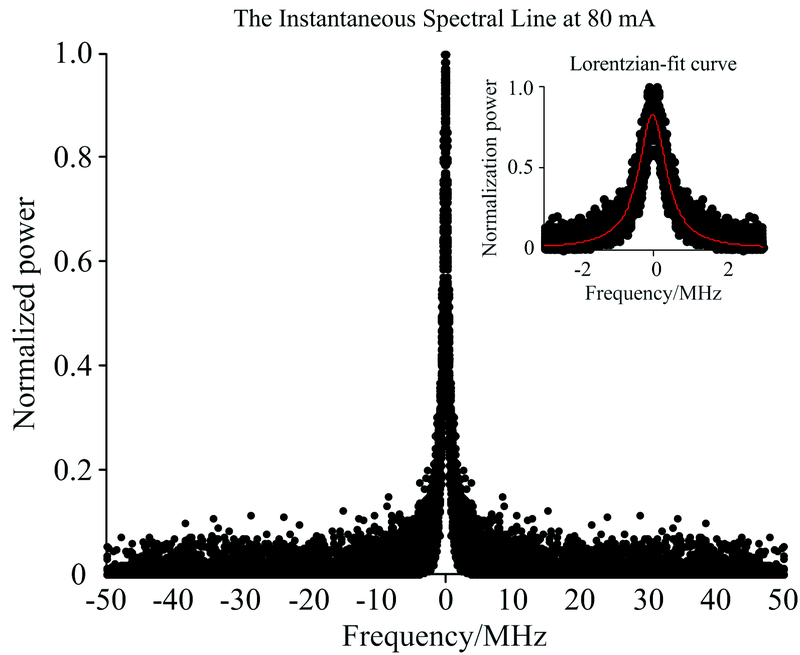 | 图4 80 mA时的瞬时光谱线Fig.4 The instantaneous spectral line at 80 mA |
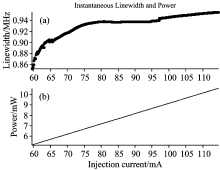
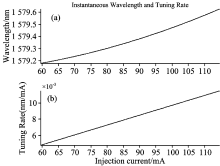
将全部调谐电流上的光谱进行洛伦兹拟合, 线宽是852.55~954.95 kHz, 呈非线性随机分布, 如图5(a)所示。 利用差拍信号的直流电压, 依据式(7)及PDA10CS-EC使用手册计算出的激光器瞬时功率如图5(b)所示, 输出光功率变化范围是5.16~10.6 mW。 瞬时光波长变化范围为1 579.2~1 579.6 nm; 激光器的瞬时调谐率在0.004 8~0.011 5 nm· mA-1范围内单调变化; 分别如图6(a)和(b)所示。 上述数值及变化特征与我们先前实验所得的静态特性相符。
 | 图5 瞬时线宽(a)与功率(b)Fig.5 The instantaneous linewidth (a) and power (b) |
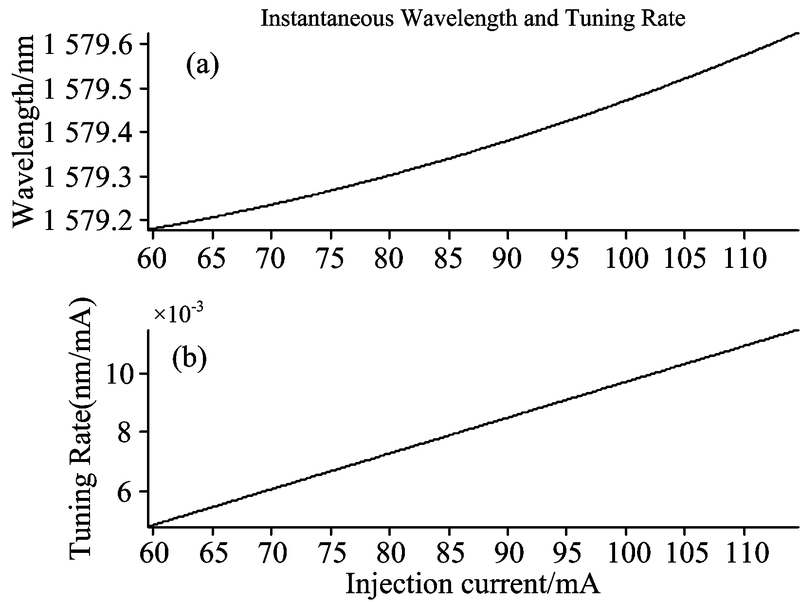 | 图6 瞬时波长(a)与调谐率(b)Fig.6 The instantaneous wavelength (a) and tuning rate (b) |
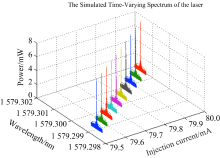
 | 图7 瞬时光谱Fig.7 The time-varying spectrum of the laser |
由瞬时波长、 功率、 线宽和线型, 可以得到全部电流调谐过程中, 半导体激光器输出光信号的时变光谱图, 图7是79~80 mA时的一部分, 此时, 波长变化范围是1 579.295~1 579.302 nm, 对应的光功率是7.1~7.2 mW。
可调谐半导体激光器在调谐过程中的瞬时光谱, 需要将差拍信号分离成直流电流、 载波与噪声信号三部分, 这样既可得到准确的光输出波长和功率值, 又可以提高噪声时变相位功率谱的精度, 使得到的线宽数值更为精准。 应用短时延和时频分析方法, 可以得到激光器在调谐过程中的瞬时光谱, 获知激光器在调谐过程中的时变信息, 进而提高其工作系统的精度, 这项工作对精密测量和光相干通信有着重要的意义。
The authors have declared that no competing interests exist.
| [1] |
|
| [2] |
|
| [3] |
|
| [4] |
|
| [5] |
|
| [6] |
|
| [7] |
|
| [8] |
|
| [9] |
|
| [10] |
|
| [11] |
|
| [12] |
|