
三亚鹿回头海域盾形陀螺珊瑚和精巧扁脑珊瑚反射率光谱分析
[陈永强1, 2  , 陈标
, 陈标3 , 雷新明1 , 谢强4 , 黄晖1, 2, * ]
, 陈标]
|
|


作者简介: 陈永强, 1982年生, 中国科学院热带海洋生物资源与生态重点实验室助理研究员 e-mail: yqchen@scsio.ac.cn
为了进一步深入研究不同形状和不同颜色珊瑚的光谱特征, 选择三亚湾鹿回头海域两种常见造礁石珊瑚(褐色片状珊瑚: 盾形陀螺珊瑚( Turbinaria peltata)和蓝灰色块状珊瑚: 精巧扁脑珊瑚( Platygyra daeda))为样本进行测量和分析。 于2015年7月22日上午采集两种珊瑚样品各7组。 样品块大小6 cm, 并将其暂养于中国科学院海南热带海洋生物重点实验站岸基实验室珊瑚养殖缸, 养殖缸内水温控制在26 ℃。 待样品块暂养≥4小时后用光纤光谱仪测量其反射率, 光谱采集条件为无云遮挡的晴天。 所用光纤光谱仪(海洋光学USB2000+), 波段为200~850 nm, 光谱分辨率1.34 nm, 步长0.6 nm, 视场角为25°。 珊瑚样品置于缸内的平台上, 过滤后恒温26 ℃的海水持续注入以保证缸内水温恒定; 多余的海水自动从养殖缸上壁溢出以排除因光线折射入水体后引起的“汇聚现象”; 养殖缸内壁采用黑色尼龙布贴壁, 以避免玻璃缸壁光线反射对测量结果的影响。 光纤光谱仪的探头与样品间距保持在5 cm, 每个样品重复测量10次取平均值以代表该样品的光谱反射率。 测量光源为太阳光, 每次测量前校正一次光谱仪, 选用可见光波段的反射率光谱进行数据分析。 反射率光谱导数分析可以放大光谱间的差异, 四阶导数光谱法在提高检测灵敏度、 改善分辨率和加强抗干扰力等方面具有独特的优点, 故此对所测珊瑚光谱反射率数据进行反射率光谱数据一阶导数、 二阶导数和四阶导数分析, 根据盾形陀螺珊瑚和精巧扁脑珊瑚反射率光谱导数之间的差异确定两种珊瑚光谱的敏感可区分波段。 分析结果发现, 可见光范围内两种珊瑚反射率差异明显; 后者反射率光谱明显高于前者, 仅700 nm出现类似较高反射率。 盾形陀螺珊瑚反射率介于4%~15%之间, 波峰和波谷明显。 400~450 nm反射率相对较低约为4%~5%; 480 nm后急升至10%, 502, 578, 604和652 nm附近为明显波峰; 随后激增至700 nm的36%。 精巧扁脑珊瑚反射率介于6%~16%之间; 400~420 nm波长附近反射率值相对较低, 为6%; 420~470 nm急剧升高至15%, 486 nm附近出现宽大波峰, 为该珊瑚的特征峰; 486, 577, 607和650 nm处也存在四个明显波峰; 随后剧增至700 nm的37%。 光谱反射率导数分析结果表明盾形陀螺珊瑚和精巧扁脑珊瑚可区分波段为: 一阶导数483.7~492.6, 496.2~500和533.5~540.5 nm。 二阶导数414~422.7, 499.4~504, 520.2~523.3, 534.2~536.6, 557.5~561和671.8~675 nm。 四阶导数414~417.6, 427.4~430.3, 433.4~436.5, 452.3~455.5和657.1~659.1 nm。
In order to further understand the spectral characteristics of different shapes and different colors of scleractinian coral, reflectance spectra of two common scleractinian coral species (brown schistose Turbinaria peltata and blue gray massive Platygyra daeda) were measured using a fiber spectrometer in the sea area of Lu Huitou Sanya Bay in the north-western South China Sea (SCS). On the morning of July 22, 2015, 7 samples for each species were collected. The size of the samples was 6 cm, and was fostered to laboratory reef aquariums, in which water temperature was controlled 26 ℃. The reflectance spectra were measured after the samples were fostered for more than 4 hours in the reef aquarium, and weather condition was sunny day without clouds. Using a spectrometer (USB2000+), band 200~850 nm, resolution 1.34 nm, step length 0.6 nm, and field angle 25 degrees, the sample was placed on the cylinder platform, and 26 ℃ seawater was continuously injected to ensure the water temperature was constant. The extra seawater automatically spilt from the upper edge of the aquarium to exclude the “converging phenomenon” of the refraction of light into the water body. The black nylon cloth was adhered to the inter side wall of the aquarium to avoid the reflection effect. The distance between the probe and the sample was 5 cm, and the reflectance was the average of repeated 10 times measurements. The light source was the sun light, and the calibration of the spectrometer was carried out every time before the measurement, and reflectance spectrum in the visible light band was used to analyze the character of the reflectance of the samples. Then for spectral reflectance analysis, derivative spectroscopy was used to study the difference of the reflectance spectrum of them. The results showed that the reflectance of two kinds of coral is obviously different from each other in the visible wavelength range. The reflectance of Platygyra daeda was significantly higher than that of Turbinaria peltata with significant differences, and a similar high reflectance appeared only near 700 nm. The reflectance of Turbinaria peltata was between 4% and 15% with significant peak and trough. In 400~450 nm area reflectance of Turbinaria peltata showed a relatively lower value of about 4%~5%; after 480 nm it soared to around 10%, and obvious peaks appeared at 502, 578, 604 and 652 nm, and the main peaks at 604 nm, and 578 and 652 nm were the two shoulders; obviously the trough appeared at 670 nm, then surged to 36% at 700 nm. The reflectance of Platygyra daeda was between 6% and 16% with no obvious peak and trough. The reflectance values were relatively lower around 6% near 400~420 nm, increased sharply to about 15% with large characteristic peaks near 486 nm, at 486, 577, 607 and 650 nm there were four distinct peaks; with 607 nm as the main peak, 577 and 650 nm were the two shoulders; a significant trough appeared near 415 nm, and a less obvious trough appeared at 667 nm, then the reflectance increased significantly to about 37% at 700 nm. Derivative analysis results showed that the distinguishable bands of Turbinaria peltata and Platygyra daeda were as follows: first order derivatives are mainly in 483.7~492.6, 496.2~500 and 533.5~540.5 nm bands. The second order derivatives are mainly in 414~422.7, 499.4~504, 520.2~523.3, 534.2~536.6, 557.5~561 and 671.8~675 nm bands. The fourth order derivatives are mainly in 414~417.6, 427.4~430.3, 433.4~436.5, 452.3~455.5 and 657.1~659.1 nm.
珊瑚礁生物多样性媲美“ 热带雨林” [1, 2, 3]。 因虫黄藻和色素不尽相同, 致其反射率光谱存在差异[4, 5, 6]。 利用光谱反射率不同可以识别不同珊瑚[7, 8, 9, 10, 11, 12]。 本研究分析不同表观类型珊瑚光谱反射率的差异与可区分性, 标出两种珊瑚反射率光谱之间的区别, 列出识别两种珊瑚的敏感波段。 一阶导数、 二阶导数和四阶导数分析, 确定两种珊瑚的可区分波段。
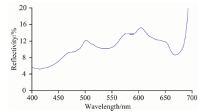
图1为盾形陀螺珊瑚反射率光谱, 波峰和波谷明显。 400~450 nm相对较低, 在4%~5%之间; 480 nm以后由4%急升至10%, 502 nm为明显特征波峰。 共四个明显波峰, 分别为502, 578, 604和652 nm处; 670 nm为明显波谷, 后激增至700 nm处的36%。
 | 图1 盾形陀螺珊瑚反射率光谱Fig.1 Reflectance spectrum of Turbinaria Peltata |
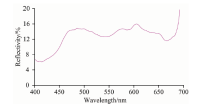
图2为精巧扁脑珊瑚反射率光谱, 波峰和波谷不明显。 400~420 nm反射率较低> 6%; 420~470 nm由6%急升至15%, 486 nm附近为宽大特征波峰。 四个波峰在486, 577, 607和650 nm处; 415 nm为波谷, 667 nm为弱波谷, 后增至700 nm处的37%。
 | 图2 精巧扁脑珊瑚反射率光谱Fig.2 Reflectance spectrum of Platygyra daeda |
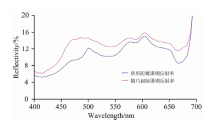
图3为盾形陀螺珊瑚和精巧扁脑珊瑚反射率光谱对比, 二者均有一峰两肩的特征, 但部分波段差异明显; 前者整体相对较低, 后者部分波段较低, 如400~420和570~650 nm差别较小2%。 420~570 nm后者起伏较大, 明显大于前者, 650~685 nm前者存在明显波谷。 两者只在700 nm存在交叉。 400~700 nm两者整体上小于16%; 470~670 nm后者起伏平缓, 前者变化相对剧烈, 但整体小于后者。
 | 图3 盾形陀螺珊瑚和精巧扁脑珊瑚反射率光谱Fig.3 Reflectance spectra of Turbinaria peltata and Platygyra daeda |
一阶导数存在九个信号相反波段405.3~408.2, 483.7~492.6, 496.2~500, 533.5~540.5和663.8~667.8 nm; 其中483.7~492.6, 496.2~500和533.5~540.5 nm间隔较宽易于分辨(图4)。
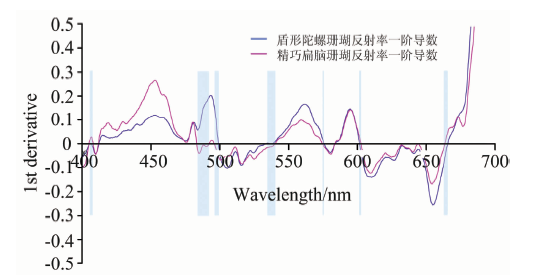 | 图4 盾形陀螺珊瑚和精巧扁脑珊瑚反射率光谱一阶导数Fig.4 First-order derivatives of Turbinaria peltata and Platygyra daeda reflectances |
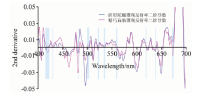
二阶导数可区分波段为414~422.7, 429.2~430, 482.3~484.1, 499.4~504, 520.2~523.3, 534.2~536.6, 557.5~561, 619~619.4, 638.2~638.6, 671.8~675和695.3~696.6 nm; 其中以414~422.7, 499.4~504, 520.2~523.3, 534.2~536.6, 557.5~561和671.8~675 nm等波段易于分辨(图5)。
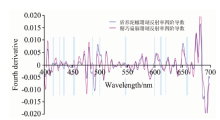
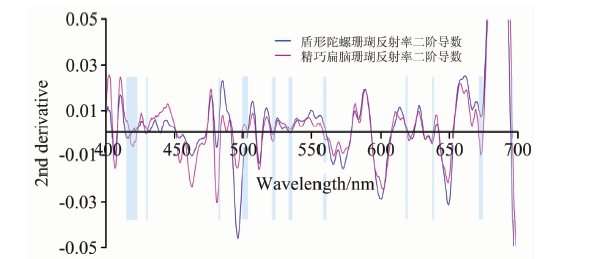 | 图5 盾形陀螺珊瑚和精巧扁脑珊瑚反射率光谱二阶导数四阶导数分析结果表明, 414~417.6, 427.4~430.3, 433.4~436.5, 452.3~455.5, 486.2~488.4, 500.4~501.1, 545.4~548.6, 598.6~599.6, 609.5~612.5, 619.3~621.4, 657.1~659.1和685~686 nm波段, 二者四阶导数信号相反, 能够区分两种珊瑚(图6)。Fig.5 Second-order derivatives of Turbinaria peltata and Platygyra daeda reflectances |
 | 图6 盾形陀螺珊瑚和精巧扁脑珊瑚反射率光谱四阶导数Fig.6 Fourth-order derivatives of Turbinaria peltata and Platygyra daeda reflectances |
盾形陀螺珊瑚反射率光谱在486, 577, 607和650 nm处为波峰; 其中486 nm处为特有波峰, 607 nm处为主峰, 577和650 nm处为两肩的特征; 415 nm为明显波谷, 667 nm为不明显波谷。 精巧扁脑珊瑚反射率光谱也存在四个明显波峰486, 577, 607和650 nm; 具备607 nm处为主峰, 577和650 nm处为两肩的特征; 415 nm为强波谷, 667 nm为弱波谷。 盾形陀螺珊瑚反射率光谱整体相对低于精巧扁脑珊瑚, 400~420和570~650 nm差别较小, 仅2个百分点。 420~570 nm精巧扁脑珊瑚反射率光谱波峰起伏较大, 明显大于盾形陀螺珊瑚, 650~685 nm盾形陀螺珊瑚存在明显的波谷。
一阶导数主要可区分波段为483.7~492.6, 496.2~500和533.5~540.5 nm波段。 二阶导数414~422.7, 499.4~504, 520.2~523.3, 534.2~536.6, 557.5~561和671.8~675 nm等波段; 四阶导数414~417.6, 427.4~430.3, 433.4~436.5, 452.3~455.5和657.1~659.1 nm波段。
The authors have declared that no competing interests exist.
| [1] |
|
| [2] |
|
| [3] |
|
| [4] |
|
| [5] |
|
| [6] |
|
| [7] |
|
| [8] |
|
| [9] |
|
| [10] |
|
| [11] |
|
| [12] |
|