木材种类的近红外光谱和模式识别
[郝勇1  , 商庆园
, 商庆园1 , 饶敏2 , 胡远2 ]
, 商庆园|
|


作者简介: 郝 勇, 1978年生, 华东交通大学机电与车辆工程学院副教授 e-mail: haonm@163.com
木材的种类识别是木材加工和贸易的一个重要环节, 传统的木材种类识别方法主要有显微检测法和木材纹理识别法, 其操作繁琐, 耗时长, 成本高, 不能满足当前需求。 本研究利用木材的近红外光谱(NIRS)结合模式识别方法, 以期实现木材种类的快速准确识别。 采用近红外光谱结合主成分分析法(PCA)、 偏最小二乘判别分析法(PLSDA)和簇类独立软模式法(SIMCA)三种模式识别对58种木材进行种类鉴别研究; 5点平滑、 标准正态变量变换(SNV)、 多元散射校正(MSC)、 Savitzky-Golay一阶导数(SG 1st-Der)和小波导数(WD)五种光谱预处理方法用于木材光谱的预处理; 校正集和测试集样品的正确识别率(CRR)用于模型的评价。 采用PCA方法, 通过样品的前三个主成分空间分布图分辨木材种类的聚类情况。 在建立PLSDA模型, 原始光谱的正确识别率最高, 分别为88.2%和88.2%; 5点平滑处理的光谱校正集和测试集的CRR分别为88.1%和88.2%; SNV处理的光谱校正集和测试集的CRR分别为84.4%和84.5%; MSC处理的光谱校正集和测试集的CRR分别为83.1%和84.2%; SG 1st-Der处理的光谱校正集和测试集的CRR分别为81.8%和82.7%; WD(小波基为“Haar”, 分解尺度为80)处理的光谱校正集和测试集的CRR分别为87.3%和87.2%。 可知, 在PLSDA模型中, 木材光谱未经预处理种类识别效果最后好。 在建立SIMCA模型过程中, 原始光谱的校正集和测试集的CRR分别为99.7%和99.4%; 5点平滑处理的光谱校正集和测试集的CRR分别为100%和100%; SNV处理的光谱校正集和测试集的CRR分别为99.5%和99.1%; MSC处理的光谱校正集和测试集的CRR分别为99.0%和98.4%; SG 1st-Der的光谱校正集和测试集的CRR分别为81.8%和82.7%; WD处理的光谱校正集和测试集的CRR分别为100%和100%。 可知, 在SIMCA模型中, 木材光谱经平滑和小波导数处理后的识别效果最好, 且光谱的校正集和测试集CRR都为100%。 采用三种模式结合五种不同的预处理方法对木材近红外光谱进行定性建模识别时, 由于木材样本属性复杂, 主成分分布图相互交织, PCA无法识别出58种木材; 原始光谱的PLSDA模型可以得到较好的判别模型, 但校正集和测试集的CRR只有88.2%和88.2%; 木材光谱经过5点平滑或WD预处理后的SIMCA模型可达到最好的识别效果, 校正集和测试集的CRR均为100%, 且WD-SIMCA模型因子数比5点平滑SIMCA模型小, 模型更为简化, 故WD-SIMCA为58种木材种类识别的最优模型。 研究表明光谱预处理方法可以有效的提高木材种类识别精度, 有监督模式识别方法SIMCA可以用来建立有效的木材识别模型, 近红外光谱结合模式识别可以为木材种类的识别提供一种快速简便的分析方法。
Identification of wood species is an important part of wood processing and commerce. The traditional methods of wood species identification mainly include microscopic detection and wood texture recognition which are complex, time-consuming and costly. They cannot meet the current needs. Near infrared spectroscopy (NIRS) of wood combined with pattern recognition methods were used to identify wood species. NIRS combined with three kinds of pattern recognition methods including principal component analysis (PCA), partial least squares discriminant analysis (PLSDA) and soft independent modeling of class analogy (SIMCA) were used to identify fifty-eight wood species. Five spectral preprocessing methods including 5 point smoothing, standard normal variable (SNV), multiplicative scatter correction (MSC), Savitzky-Golay first derivative (SG 1st-Der) and wavelet derivative (WD) were used to spectral transform. The correct recognition rate (CRR) of calibration and test sets were used for evaluation index of models. The results showed that the wood species could not be identified by using the first three principal components. In PLSDA model, the CRR values of calibration and test sets for original spectra model were the highest, which were 88.2% and 88.2%, respectively. The CRR values of calibration and test sets for 5 points smoothing model were 88.1% and 88.2%. The CRR values of calibration and test sets for SNV model were 84.4% and 84.5%. The CRR value of calibration and test sets for MSC model were 83.1% and 84.2%. The CRR values of calibration and test sets for SG 1st-Der model were 81.8% and 82.7%. The CRR values of calibration and test sets for WD (the wavelet basis is “Haar” and the decoposition scale is 80) model were 87.3% and 87.2%. In PLSDA models, the original spectra model had the best results compared to others. In SIMCA model, the CRR values of calibration and test sets for original spectra were 99.7% and 99.4%. The CRR values of calibration and test sets for 5 points smoothing were 100% and 100%. The CRR values of calibration and test sets for SNV model were 99.5% and 99.1%. The CRR values of calibration and test sets for MSC model were 99.0% and 98.4%. The CRR values of calibration and test sets for SG 1st-Der model were 98.4% and 99.0%. The CRR values of calibration and test sets for WD model were 100% and 100%. Compered to others spectra processed by 5 points smooting and WD had a best results in SIMCA models, the CRR values of calibration and test sets were 100%. Three kinds of pattern recognition methods combined with five spectral preprocessing methods were used to classify 58 kinds of wood. It could be concluded that the PCA method can’t explicitly classify 58 wood species because of complex properties of wood leading to the scatters of each wood species interwined with each other in PCA distribution diagram. The PLSDA model of original spectra could get a better result with the CRR value of 88.2% and 88.2% for calibration and test sets, respectively. The best SIMCA models were constructed by 5 point smoothing or WD preprocessing methods with the CRR of 100% for calibration and test sets. However, the factor of the WD-SIMCA model was smaller than 5 point smoothing method, and the model was more parsimonious, so WD-SIMCA model was an optimal model. The paper showed that spectral preprocessing methods can improve the accuracy of identificationof wood species, and SIMCA supervised pattern recognition method can be used to build effective identifying model and NIR combined with pattern recognition method can provide a rapid and simple method for identification of wood species.
我国木材资源丰富且种类繁多, 然而人均占有率较低, 每年需要进口大量的木材。 木材种类识别是加工和贸易的一个重要环节。 现阶段木材种类识别方法主要有显微检测法和图像纹理识别法[1, 2], 此两种方法易受环境的干扰, 操作步骤繁琐, 处理较复杂。 近红外吸收谱带可以反映出大多数有机物分子的结构信息, 近红外光谱具有快速、 非破坏性以及精度高等优势被广泛应用[3, 4, 5, 6]。 近年来, 近红外光谱检测技术逐渐被应用到木材检测领域, 主要包括树木的化学成分分析[7]、 木材种类识别[8, 9, 10]、 树木物理特点的检测等[11, 12, 13], 都得到较好的检测结果。
利用近红外光谱结合主成分分析法(principal component analysis, PCA)、 偏最小二乘判别分析法(partial least squares discriminantanalysis, PLSDA)和簇类独立软模式法(soft independent modeling of class analogy, SIMCA)三种模式识别方法对不同种类木材进行鉴别研究, 期望探索一种快速简便的木材种类鉴别方法。
实验所用58种标准木材样品由张家港出入境检验检疫局制作提供。 每种木材由不同日期和批次的80块长21 cm、 宽10 cm和厚2 cm的长方体木块构成, 共有4640块木材样本。
美国JDSU公司的MicroNIRTM 1700型便携式近红外光谱仪用于木材光谱的采集, 光谱波长范围为950~1 650 nm, 光谱分辨率近似6 nm, 每条光谱包含128个数据点。 光谱采集时, 首先将光谱仪进行预热, 待达到40 ℃左右时进行采集。 每块木材样本随机采集三个不同部位的光谱, 平均光谱作为该样品的最终分析光谱。 每类木材得到80条光谱, 58类木材样本最终得到4 640条光谱用于建模和预测分析。 采用Kennard-Stone算法将每类木材样品按照3∶ 1的比例进行校正集和测试集的划分[14]。 光谱实验室温度和湿度分别为(25± 2)℃和57%± 2% RH。
木材样品的近红外光谱不仅反映了自身的组分信息, 同时包含了探测器电噪声、 木材样品纹理不均匀和其他杂散光等。 因此, 需要对光谱进行预处理以减小无用信息干扰, 提高信噪比。 分别采用5点平滑、 标准正态变量变换(standard normal variable, SNV)、 多元散射校正(multiplicative scattering correction, MSC)、 Savitzky-Golay一阶导数(SG 1st-Der)和小波导数(wavelet derivative, WD)五种方法对木材光谱进行预处理。
近红外光谱技术反映的是有机分子含氢基团的特征信息, 因此, 对于属性相近的木材样品具有相似的光谱, 需要借助于定性算法才能进行样品种类分析。 采用PCA, PLSDA和SIMCA三种模式对木材进行种类鉴别研究[15, 16, 17]。 采用校正和测试集样品的正确识别率(correct recognition ratio, CRR)对模型进行评价, CRR越接近于100%, 模型的精度越高。 CRR计算见式(1)所示
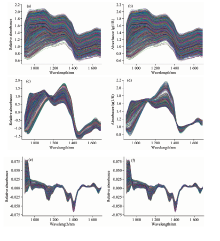
图1所示为58种木材的原始和五种方法预处理后的近红外光谱图。 从图可知, 原始光谱与平滑处理的光谱基本相同, 而经其他几种方法预处理后, 光谱的谱形发生了不同程度的变化; 四种预处理方法都使得光谱的纵向聚集度提高, 从而使得平移误差得到有效消除; 58种木材的原始和预处理光谱变化趋势基本相同且相互交叉, 通过肉眼观察很难分出木材种类。 因此, 需借助于模式识别方法对木材的近红外光谱进行建模分析, 最终实现木材种类的有效鉴别。
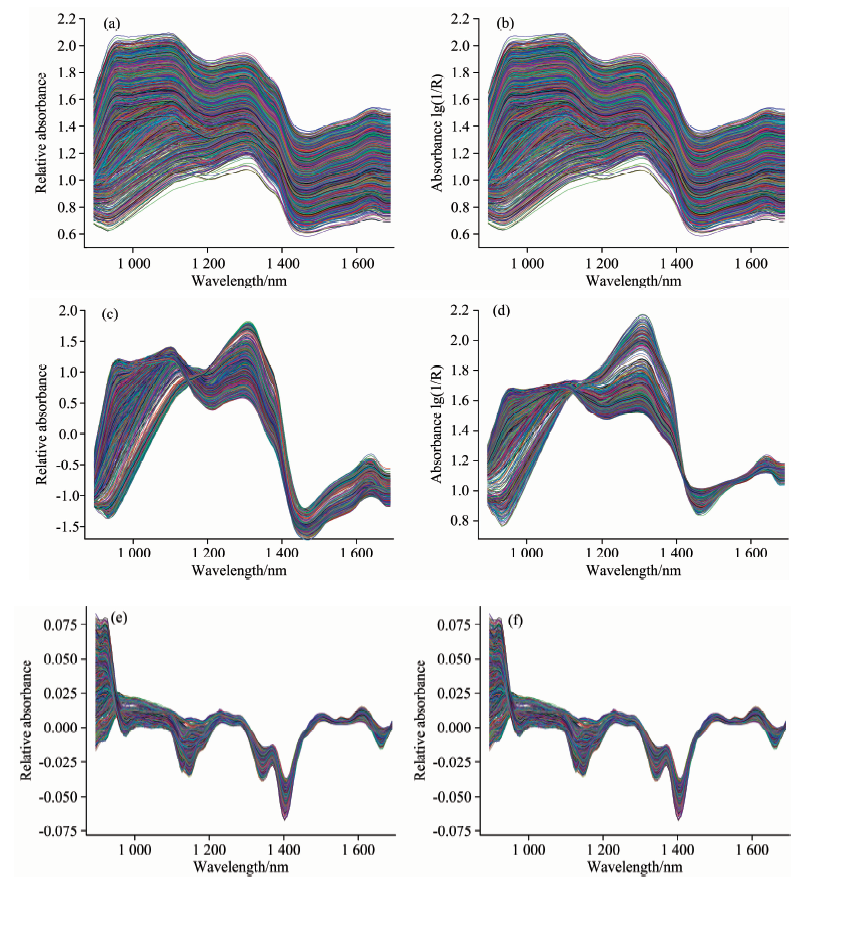 | 图1 58种木材的近红外光谱图 (a): 原始光谱; (b): 5点平滑; (c): SNV预处理; (d): MSC预处理; (e): S-G导数; (f): 小波导数Fig.1 Near-infrared spectra of fifty-eight wood species samples (a): Original; (b): 5-point smooth; (c): SNV; (d): MSC; (e): S-G derivative; (f): Wavelet derivative |
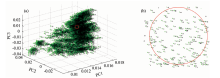
采用PCA方法对不同种类木材样品光谱的空间分布情况进行分析。 图2所示(PC1, PC2, PC3)为58种木材样品的前三个主成分分布图及其局部放大图。 图中数字编号代表木材种类, 每种木材包含80个点(80个样品), 共计4 640个样本点。 从图中各种木材的光谱点相互交织在一起, 表明采用近红外光谱结合PCA方法对不同种类的木材样品进行定性鉴别具有一定难度。
 | 图2 58种木材的前三主成分分布图(a)及局部放大图(b)Fig.2 Distribution of the first three principal components (a) and local enlargement (b) for fifty-eight wood species samples |
应用PLSDA进行木材种类识别时, PLS分解因子数是非常重要的模型参数。 PLS分解因子数表示有效的分类特征数, 因子数较高就会携带噪声信息, 干扰模型的准确性; 因子数较低, 则不能实现有效信息的提取, 导致分类失败。 表1所示为不同预处理方法下的PLSDA模型的因子数、 校正集和测试集样品的正确识别率结果。 从表可知, 不同的处理方法其PLS因子数不尽相同, 原始光谱的PLSDA模型的校正集和测试集正确识别率最高, 分别为88.2%和88.2%。
| 表1 不同预处理方法的木材种类定性识别PLSDA模型结果 Table 1 The results of PLSDA models for wood species qualitative identification with different kinds of preprocessing methods |
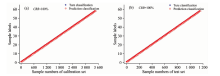
图3为原始光谱的PLSDA模型校正集和测试集样品实际类别和预测类别的比较图。 从图中可知, 校正和测试集样品集中很多样品的预测类别和实际类别相差较大, 错误识别的样品无规律可循。 因此需要探讨其他的定性判别方法用于木材种类的识别。
 | 图3 木材样品实际类别与原始光谱PLSDA模型预测类别比较图Fig.3 The comparison graphs of actual and prediction classification of PLSDA model with original spectra |
在应用SIMCA进行木材种类识别时, 首先需要对每一类木材样品的光谱数据进行主成分分析, 因此需要对主成分数(principal component numbers, PCs)选择优化。 采用校正集样品的正确识别率作为选择主成分因子数的标准建立回归模型。 表2所示为不同预处理方法下的SIMCA模型的主成分数、 校正集和测试集样品的正确识别率结果。 从表中可知, 不同的处理方法其主成分数不尽相同, 木材光谱经过5点平滑或WD预处理后的SIMCA模型可达到最好的识别效果, 校正集和测试集的CRR均为100%, 光谱经小波导数预处理后的SIMCA模型因子数比5点平滑SIMCA模型小, 模型相对更为简化。
| 表2 基于SIMCA模型木材校正集和测试集识别率 Table 2 The recognition rate of calibration and test sets based on SIMCA |
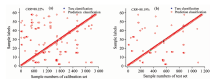
图4为小波导数光谱的SIMCA模型校正集和测试集样品实际类别和预测类别的比较图。 图中样品的实际类别和模型的预测类别完全相同, 校正集和测试集的CRR均为100%。 WD-SIMCA方法是一种准确快速简便的木材种类识别方法。
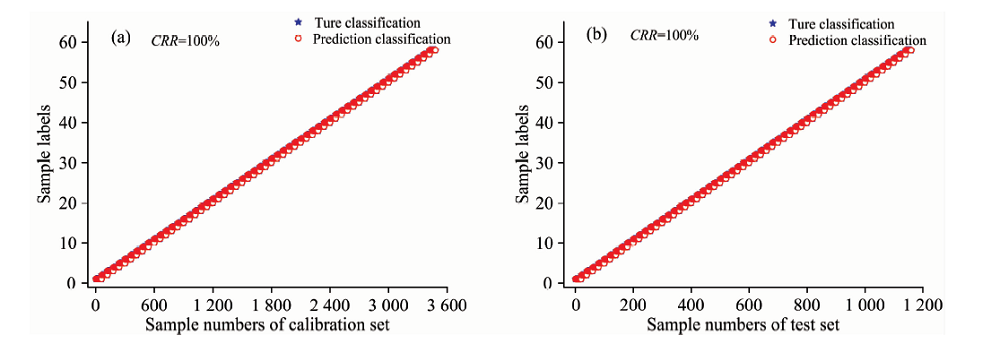 | 图4 木材样品实际类别与小波导数预处理光谱的SIMCA模型预测类别比较图Fig.4 The comparison graphs of actual and prediction classification of SIMCA model with wavelet derivative spectra |
近红外光谱分析结合PCA, PLSDA和SIMCA方法用于58种木材样品的分类判别, 原始光谱和5种预处理光谱结合PLSDA和SIMCA方法用于木材种类模型的建立和优化。 结果表明: PCA方法无法在主成分空间将木材种类进行有效区分; 原始光谱的PLSDA模型可以得到较好的判别模型, 模型的校正集和测试集正确识别率分别为88.2%和88.2%; 木材光谱经小波导数预处理后, 其SIMCA模型最优, 模型的校正集和测试集正确识别率为100%。 近红外光谱结合WD-SIMCA方法可用于木材种类的准确鉴别, 是一种快速简便的木材种类鉴别方法。
The authors have declared that no competing interests exist.
| [1] |
|
| [2] |
|
| [3] |
|
| [4] |
|
| [5] |
|
| [6] |
|
| [7] |
|
| [8] |
|
| [9] |
|
| [10] |
|
| [11] |
|
| [12] |
|
| [13] |
|
| [14] |
|
| [15] |
|
| [16] |
|
| [17] |
|