


超光谱红外卫星资料同步反演不同地表类型的大气廓线、 地表温度和地表发射率
[赵强 , 邓淑梅, 刘常瑜, 舒莹, 李卫华, 杨婉清]
, 邓淑梅, 刘常瑜, 舒莹, 李卫华, 杨婉清]
|
|


作者简介: 赵 强, 1981年生, 安徽建筑大学环境与能源工程学院副教授 e-mail: rommel99@163.com
大气温度、 水汽、 地表温度和地表发射率是大气和地表的本征信息量。 利用卫星红外资料精确反演大气温湿廓线有利于准确预报天气和研究气候变化, 同时地表温度和地表发射率光谱的反演为研究植物生长与作物产量、 地表水分蒸发与循环、 能量平衡、 地表成分及物理性质、 气候变迁与全球环境提供重要参数指标。 把大气和地面作为一个整体系统来考虑, 建立一种能同步反演大气温度廓线、 大气水汽廓线、 地表温度和地表发射率的反演方法, 利用超光谱红外卫星资料(atmospheric infrared sounder, AIRS), 针对我国新疆地区沙漠和雪地两种典型发射率地表同步反演大气温度廓线、 水汽廓线、 地表温度和地表发射率。 反演方法首先线性化地球-大气系统红外辐射传输方程, 提出通过经验正交函数构建大气廓线和地表发射率光谱, 有效减少反演变量数, 建立同步物理反演模式, 然后以美国国家环境预报中心(National Centers for Environmental Prediction, NCEP)的预报结果(初始大气温度、 水汽廓线以及地表参数)作为初始值, 最后通过牛顿迭代得到最优化解。 反演观测区域覆盖我国新疆塔克拉玛干沙漠和准噶尔盆地, 分别选择位于塔克拉玛干沙漠腹地的塔中探测站(纬度38.98°, 经度83.64°)和准噶尔盆地的阜康荒漠生态系统国家野外科学观测研究站(纬度44.2°, 经度87.9° )为反演地面验证点。 反演结果表明, 塔克拉玛干沙漠地表温度明显高于准噶尔盆地地表温度, 与实际情况相一致; 根据反演的8.6和13.4 μm处的地表发射率分布情况, 可以看出在8.6 μm处沙漠地表发射率明显低于雪地发射率, 在6~15 μm范围内, 反演的沙漠地区(塔中站)地表发射率和雪地地区(阜康站)地表发射率与美国喷气推进实验室测量的沙漠发射率光谱和雪地发射率光谱相一致。 研究表明, 把大气和地面作为一个整体系统来考虑, 把地表发射率加入到反演中, 通过比较和分析沙漠地区(塔中)和雪地地区(阜康)的大气廓线反演结果与当地气象探空值和传统反演方法反演值, 改进了大气温度廓线和水汽廓线反演精度, 特别是边界层温度和水汽改进尤为明显; 同时分析表明在发射率光谱变化较大的沙漠地区, 大气廓线反演精度的改进比雪地要高, 这是由于地表发射率光谱在沙漠、 戈壁地区变化较大, 而雪地的发射率光谱变化不大。 用该方法针对地表发射率光谱变化较大的地区(沙漠)同步反演大气廓线、 地表温度和地表发射率, 可以更有效的提高大气温度廓线、 水汽廓线的反演精度。 该研究结果可以为数值天气预报和我国未来超光谱红外卫星应用提供服务和有力支持, 具有十分重要的意义。
Atmospheric temperature, water vapor, surface skin temperature and surface emissivity are the intrinsic information of the atmosphere and surface of earth. Retrieval of atmospheric temperature profile and water vapour profile is important for accurate weather forecasting and climate change research by using satellite infrared data, at the same time, the retrieved surface skin temperature and surface emissivity spectra were used to study the growth of plant and crop yield, evaporation and circulation of surface water, energy balance, surface composition and physical properties, climate change and global environment. In this paper, considering the atmosphere and the ground as a whole system, the retrieval method for simultaneous retrieval of atmospheric temperature profiles, water vapour profiles, surface emissivity, and surface skin temperature was established. simultaneous retrieval were performed by using hyperspectral infrared satellite Atmospheric Infrared Sounder data (AIRS) in China’s Xinjiang region for two typical desert and snow features. Firstly, infrared radiation transmission equation of earth-atmosphere system was linearized. Then, it was proposed that atmospheric profile and surface emissivity can be structured by Empirical Orthogonal Functions (EOF) to effectively reduce the inversion variables. The physical simultaneous retrieval algorithm could be developed finally. In the retrieval process, the first guess values were obtained through National Centers for Environmental Prediction (NCEP), and the optimum solution could be obtained by Newton iteration method. The observation area covered the Taklamakan desert and Junggar basin in Xinjiang, China. The latitude of the Tazhong observation station is 38.98 degrees and the longitude is 83.64 degrees, which is located in the hinterland of the Taklimakan desert in central tarim basin. The latitude of National field science observation station of fukang desert ecosystem is 44.2 degrees and the longitude is 87.9 degrees, which is located in Junggar basin. The Tazhong observation station and National field science observation station of Fukang desert ecosystem were selected to be the retrieval of the ground verification point. These stations were selected to be the retrieval of the ground verification point. The results showed that the surface temperature in the Taklamakan desert is significantly higher than that in Junggar basin, which is consistent with the actual situation. According to the retrieval of the surface emissivity distribution at 8.6 and 13.4 μm, it could be seen that the desert surface emissivity is significantly lower than the emissivity of snow at 8.6 μm, and retrieval of the two kinds of ground infrared emissivity spectrum is consistent with the laboratory measurement of emissivity spectra by comparing the retrieved surface emissivity and the jet propulsion laboratory measurement of desert and snow emissivity data between 6~15 μm. The atmosphere and ground were considered as a whole system, the surface emissivity was added in the retrieval in this paper. Through comparison and analysis of retrieved two kinds of ground atmospheric profile with the local meteorological sounding values and traditional method retrieval, the research showed that the retrieval accuracy of atmospheric temperature and water vapour profile is improved, especially the improvement is obvious in the boundary layer. At the same time, the analysis showed that the improvement of the retrieval precision of the atmospheric profile in the desert region is higher than that in the snow region. Because the surface emissivity changes within the spectrum is larger in the desert area, while the surface emissivity changes within the spectrum is smaller in the snow area. It is important that using the proposed approach can simultaneously retrieve atmospheric temperature profiles, water vapour profiles, surface emissivity and surface skin temperature. The retrieval precision of the atmospheric temperature profile and water vapour profile in the desert area can be improved more effectively compared with snow region. This paper can provide the service and support for the numerical weather forecast and the future hyperspectral infrared satellite application in China, which is of great significance.
众所周知, 大气温度、 水汽、 地表温度和地表发射率等物理参数是大气和地面的本征信息量。 超光谱红外卫星的出现, 使得探测大气垂直结构的能力和精度大大加强[1]。 在红外反演中, 大气廓线的反演精度容易受到地表特性的时空变化的影响[2]。 针对这一问题, 把大气和地面作为一个整体系统来考虑, 建立一种能同步反演大气温度廓线、 大气水汽廓线、 地表温度和地表发射率的反演方法, 基于AIRS红外卫星资料, 针对我国新疆地区沙漠和雪地两种典型发射率地表开展反演研究。
晴空下地球-大气系统卫星红外探测器的辐射量为[3]
红外辐射传输式(1)可近似为数学上扰动形式[4]
其中Tbv是亮温, WT和Wq分别是大气温度和水汽的权重函数,
其中δ X=Xn-X0, δ Yn=Ym-Y(Xn), X是要反演的大气廓线参数(温度和水汽廓线)和地表参数(地表温度和地表发射率), X0是初始值, Ym是卫星观测的通道亮温。 根据最优化思想, 求解辐射传输方程, 即
相关研究表明, 用经验正交函数来表示大气廓线和地表发射率可以有效减少反演的变量数[5]。 假定:
其中特征向量A=(α 1, α 2, …, α M),
式中, Φ T, Φ lnq和Φ ε 分别是温度、 水汽混合比、 地表发射率的经验正交函数矩阵,
获得下列迭代形式[7]
通过求解特征向量A, 根据式(9)迭代反演得到大气温度廓线、 水汽廓线、 地表温度和地表发射率。
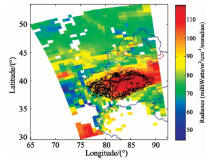
根据NCEP的预报结果得到初始大气和地表参数。 地表发射率经验正交函数通过国外实验室测量的不同类型地物发射率数据库(http://speclib.jpl.nasa.gov/)构建得到。 AIRS资料观测时间为2017年2月28日UTC时间0741, 观测面积约为607.5 km× 405 km, 通过对AIRS图像云像元识别和处理[8], 得到无云像元的AIRS辐亮度图, 如图1所示, 反演区域覆盖我国新疆塔克拉玛干沙漠、 天山山脉和准噶尔盆地。
 | 图1 11.08 μ m处AIRS晴空辐亮度图像, 覆盖塔克拉玛干沙漠(黑色标识线)、 天山山脉(白色标识线)和准噶尔盆地(红色标识线)Fig.1 AIRS images of Cloud-cleared radiances at 11.08 μ m. The white line denote Tianshan Mountains, the black lines denote Taklimakan desert, the red lines denote Junggar Basin |
选择位于新疆塔克拉玛干沙漠腹地塔中探测站(纬度38.98° , 经度83.64° )和准噶尔盆地的阜康荒漠生态系统国家野外科学观测研究站(纬度44.2° , 经度87.9° )为反演地面验证点, 经查询, 2017年2月28日, 阜康地区地面有积雪, 为雪地。
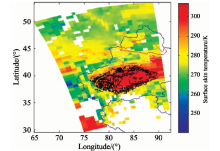
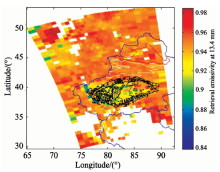
图2给出了反演的地表温度分布情况, 可以看出当地时间中午时刻的位于塔里木盆地的塔克拉玛干沙漠地表温度明显高于准噶尔盆地, 与实际相符。 图3和图4分别给出了反演的8.6和13.4 μ m处的地表发射率分布情况, 可以看出在8.6 μ m处沙漠地表发射率明显低于雪地发射率。 图5给出了基于AIRS资料反演的沙漠地区(塔中站)发射率和雪地(阜康站)地表发射率分别与美国喷气推进实验室测量的沙漠发射率和雪地发射率数据比较。 由于塔克拉玛干沙漠地区土壤类型单一, 以粉沙为主, 地表成份主要由含硅酸盐的矿物质石英组成, 其发射率在8.2~9.4 μ m处有一个明显的低值区, 而积雪地区的发射率一般为0.99[9, 10]。 可以看出在6~15 μ m范围内, 反演的两种地物发射率光谱与实验室测量的发射率光谱相一致。
 | 图2 基于AIRS资料反演的地表温度分布Fig.2 Distribution of retrieved surface skin temperature (K) from AIRS |
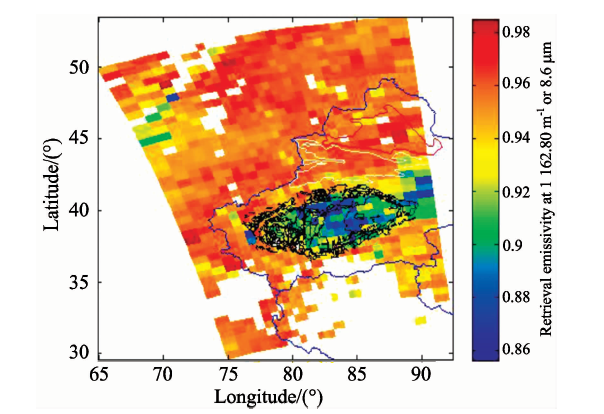 | 图3 AIRS资料反演的8.6 μ m地表发射率分布Fig.3 Distribution of retrieved emissivity at 8.6 μ m from AIRS |
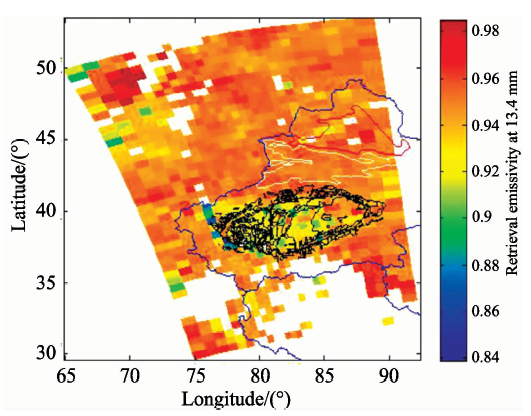 | 图4 基于AIRS资料反演的13.4 μ m地表发射率分布Fig.4 Distribution of retrieved emissivity at 13.4 μ m from AIRS |
 | 图5 反演的沙漠地区地表发射率光谱(蓝色实线)和雪地地表发射率光谱(绿色虚线)分别与实验室测量的沙漠发射率光谱(红色虚线)和雪地发射率光谱(黄色虚线)比较Fig.5 The retrieved desert surface spectral emissivity (blue lines) and snow surface spectral emissivity (green dotted line) compare with laboratory measurement of desert spectral emissivity (red dotted line) and snow spectral emissivity (yellow dotted line) respectively |
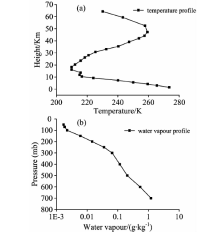
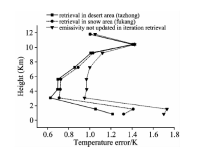
沙漠地区塔中站和雪地地区阜康站的大气温度廓线和水汽廓线反演结果(如图6和图7)可以很好的展现大气廓线的垂直结构。 由于在以往的反演中, 忽略了地表发射率对大气廓线和地表温度的影响以及不同的地表发射率随光谱变化的特点, 把发射率反演从大气廓线和地表温度反演中分离出来, 从而降低了大气廓线的反演精度。 通过对沙漠和雪地的大气温度水汽廓线反演误差与传统反演方法反演误差比较分析(如图8和图9), 结果表明把地表发射率加入到反演中, 提高了大气温度和水汽廓线反演精度, 尤其是边界层温度和水汽改进尤为明显。
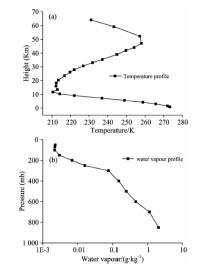
 | 图6 塔中站大气温度廓线(a)和水汽廓线(b)反演结果Fig.6 Retrieval of temperature profile (a) and water vapour profile (b) at Tazhong station |
 | 图7 阜康站大气温度廓线(a)和水汽廓线(b)反演结果Fig.7 Retrieval of temperature profile (a) and water vapour profile (b) at Fukang station |
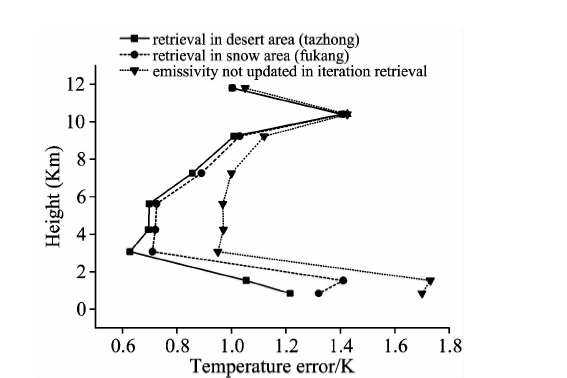 | 图8 不同地表(沙漠和雪地)的大气温度廓线误差Fig.8 The error of retrieval of temperature profile for desert area and snow area |
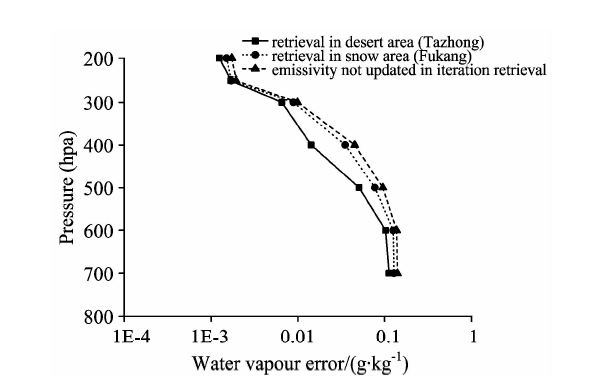 | 图9 不同地表(沙漠和雪地)的大气水汽廓线误差Fig.9 The error of retrieval of water vapour profile for desert area and snow area |
分析表明在沙漠地区大气廓线的反演精度的改进比雪地要高, 这是由于地表发射率光谱在沙漠、 戈壁地区变化较大, 而雪地的发射率光谱变化不大。 利用本方法对发射率时空变化较大的沙漠地区同步反演大气廓线、 地表温度和地表发射率, 可以更有效的改进大气温度廓线、 水汽廓线的反演精度。 也就是说本方法适用于地表发射率光谱时空变化较大的地区(例如城市区域)。
利用AIRS红外卫星资料, 针对我国新疆地区沙漠和雪地两种典型发射率地表, 把地表发射率加入到反演中, 同步求解大气廓线参数(温度廓线、 水汽廓线)和地表参数(地表温度、 地表发射率)。 结果表明, 反演的塔克拉玛干沙漠地表温度明显高于准噶尔盆地地表温度, 与实际情况相一致; 提高了大气温度廓线和水汽廓线反演精度, 特别是边界层温度和水汽改进尤为明显。 分析表明在沙漠地区大气廓线的反演精度的改进比雪地要高; 同时反演的沙漠和雪地发射率光谱与实验室测量的发射率光谱相一致。 研究结果可以为数值天气预报和我国气象卫星应用提供服务和有力支持。
致谢: 感谢寒区旱区科学数据中心(http: //westdc.westgis.ac.cn)提供的新疆塔克拉玛干沙漠分布GIS数据。
The authors have declared that no competing interests exist.
| [1] |
|
| [2] |
|
| [3] |
|
| [4] |
|
| [5] |
|
| [6] |
|
| [7] |
|
| [8] |
|
| [9] |
|
| [10] |
|