

基于分子光谱图像识别的食用油快速分类研究
[曹玉婷1 , 赵众1, *  , 袁洪福
, 袁洪福2 , 李彬1 ]
, 袁洪福|
|


分子光谱分析技术结合化学计量学已成为一种非常活跃的食用油鉴别方法。 然而, 当不同类型的样本之间的光谱差异极其微小时, 利用传统的分类技术也很难将其分开。 为了完成相似品种食用油的快速识别和分类, 收集了包括芝麻油、 玉米油、 油菜籽油、 调和油、 葵花油、 花生油、 橄榄油七种食用油的衰减全反射红外光谱, 在此基础上, 采用图像识别的方法对七种食用油进行快速分类。 在所提出的图像识别方法中, 首先, 将通过多元散射校正预处理后的红外光谱吸光度矩阵进行自相关运算, 利用等高线原理根据吸光度强度值的不同生成光谱图像, 以扩大的光谱差异并提高光谱可视化。 然后, 根据图像膨胀的原理找到光谱图像的局部特征点, 将其作为图像特征。 最后, 使用BP神经网络对特征点进行训练和分类预测。 为了对比所提出的方法, PCA-BP和KL-BP的方法被用于与图像识别的方法进行比较, 实验结果表明, 图像识别方法的正确识别率为94.4%, 高于PCA-BP的66.7%和KL-BP的83.3%。 所提方法为实现食用油的快速识别和检测提供了一条新的有效途径。
Molecular spectra analysis combined with the chemometrics is becoming a popular method for rapid classification of edible oil. However, when the molecular spectral differences among the different types of samples are tiny, it is usually difficult to identify them with the traditional classification techniques. In this work, a method of molecular spectra analysis based on image recognition for rapid classification of edible oil is proposed. In order to accomplish recognition of different types of edible oil, the attenuated total reflectance infrared spectra of seven types of edible oil are scanned on ATR-FTIR. To enhance the spectral differences among different types of samples and visualize the identification process, the pretreated IR spectra are transformed into two-dimensional spectral image with auto correlation operation. Then, the local extrema are extracted with the method of image expansion and are used as the classification features. The back propagation (BP) neural network is chosen as the classifier to identify the extracted local extrema of the two-dimensional spectral image. Comparative experiments to identify the same samples with the proposed method, PCA-BP and KL-BP have also been done. Comparative experiment results have verified that the classification results with the proposed method (correct classification rate is 94.4%) are obviously better than those with PCA-BP (correct classification rate is 66.7%) and with KL-BP (correct classification rate is 83.3%). The proposed method has provided a new way to classify the edible oil rapidly based on molecular spectra analysis.
Edible oil is a necessity of daily life, and it is very important to ensure the safety of edible oil because its quality greatly affects people’ s health. There are many kinds of edible oil such as the peanut oil, rapeseed oil, soybean oil, corn oil, tea seed oil, sesame oil and olive oil in the market. The nutritional valuesand prices of different kinds of edible oil in the market are different due to their different ingredients. To avoid spurious activities in the market, it is necessary to establish effective detection methods to classify the quality of the edible oil in the market.
There are some methods which have been reported to detect the quality of edible oil, such as the detection methods based on gas chromatography (GC)[1], GC combined with mass spectrometry (GC-MS)[2], thin-layer chromatography (TLC)[3] and high performance liquid chromatography (HPLC)[4]. However, detection methods mentioned above are usually time-consuming and require complex pre-treatment[4]. Spectral analysis based detection methods[5], including near infrared spectroscopy (NIR) and Fourier transform infrared spectroscopy (FTIR) based recognition methods have been developed to analyze theedible oils with the advantages of fast speed and non-destructive testing. In most spectra analysis methods[6, 7], the dimension of spectral data need to be compressed to extract the classification features. Principal component analysis (PCA)[8], Karhunen-Loeve transform (KL)[9] and cluster analysis (CA)[10]are of ten applied for data compression. PCA is probably the most widely applied method among the existing methods of data compression. PCA has been proved to be an effective data compression method. Usually, the main components of unclassified samples for edible oil identification are very similar, such as the samples of the peanut oil, rapeseed oil, soybean oil, corn oil, tea seed oil, sesame oil and olive oil. When PCA is applied to extract the classification features from the samples with similar components, the number of principal components could be very large in order to include the classification information. Then, the classification information could be hidden by other principal components. It is usually difficult to identify the hidden classification information even with the nonlinear classification method. Therefore, the key step for edible oil identification based on molecular spectra analysis is extracting the effective classification features that can enhance the difference among the samples. Transforming the one-dimensional molecular spectra data into two-dimensional molecular spectral image data is an effective way to improve the visualization of the molecular spectra data and enhance the differences among the samples. Image processing techniques[11] can be applied to extract the classification features from the two-dimensional molecular spectra image dataand classify the two-dimensional molecular spectral image. In this work, a method of molecular spectra analysis based on image recognition for rapid classification of edible oil is proposed. In order to accomplish recognition of the different types of edible oil, the IR spectra of seven types of edible oil are scanned on ATR-FTIR. To enhance the spectral differences among different types of samples and visualize the identification process, the pretreated IR spectra are transformed into two-dimensional spectral image with auto correlation operation. Then, the local extrema are extracted with the method of image expansion and are used as the classification features. The back propagation (BP) neural network is chosen as the classifier to identify the extracted local extrema of the two-dimensional spectral image. Comparative experiments to identify the same samples with the proposed method, PCA-BP and KL-BP have also been done. Comparative experiment results have verified that the classification results with the proposed method (correct classification rate is 94.4%) are obviously better than those with PCA-BP (correct classification rate is 66.7%) and with KL-BP (correct classification rate is 83.3%). The proposed method has provided a new way to classify the edible oil rapidly based on molecular spectra analysis.
Due to the environment factors (
Step 1: Calculate the average spectra of the sample
where n is the number of the samples and m is the number of the wavelengths.
Step 2: Do linear regression between each sample spectra xi and average spectra
where ai, bi are linear regression coefficients.
Step 3: Do multiple scattering correction for each sample spectra as
where I∈ Rn× 1 is unit vector.
The infrared spectra can reflect the vibration of the molecule. When different frequencies of infrared lights are projected to the molecule in proper order, the different absorption can be obtained. Let Zi denotes the absorbance matrix of spectra as
where [A1A2 … Ai-1Ai] are the infrared light absorbance vector. The one-dimensional infrared spectra are obtained by plotting the absorbance T% versus frequency λ . To transform the one-dimensional spectrum into 2D spectral contour map, the absorbance matrix is multiplied by its transpose as
The different correlation coefficient values are represented with different color.
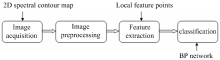
Image recognition is a technology to identify a variety of different patterns in the field of computer application, which uses computer to process and analyze the image. Generally, the system of image recognition mainly includes the information acquisition of image, preprocessing of image, feature extraction and classification [12]. In this work, the local extrema of image are extracted as classification features and the BP neural network is applied as the classifier. The procedure of molecular spectra analysis based on image recognition is illustrated in Fig.1.
 | Fig.1 The procedure of molecular spectra analysis based on image recognition |
Feature extraction is a very important step in the procedure of image recognition. The extracted features need to be stable and can represent the typical characteristics to ensure the accuracy of the classification. The features for image recognition include color feature, edge feature, shape feature and local extrema feature. The local extrema feature is usually not affected by the disturbance of external environment. In this work, the local extrema feature is chosen as the classification feature for edible oils.
The local extrema are extracted by the image dilation with the two dimensional data. The image dilation is an image processing method based on the dilation element operator in mathematical morphology. In the image dilation, target image X and structural elements S are looked as two sets of pixels, move structure element S from the origin to Sxy, if Sxy hit or is included in X, then form the coordinates of the dilation set as
where x, y are the horizontal and vertical coordinate respectively of the structural elements moved to.
Comparing the original data and image dilation, only a relatively large value can overlap with the result after the dilation. According to this principle, the local extremacan be extracted. In this work, the classifier of back propagation (BP) neural network is designed based on the supervised learning.
72 edible oil samples are provided by the National Institute of Metrology (NIM) of China. They belong to nine types of edible oil of sesame, corn, canola, blend, sunflower, peanut and olive. 54 samples are chosen as calibration set and the remaining 18 samples are chosen as the validation set. The number of calibration set and validation set for eachtypes of samples is shown in Table 1.
| Table 1 Statistics of samples |
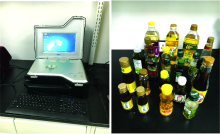
In this work, the infrared spectra of the samples are scanned by Attenuated Totalinternal Reflectance Fourier Transform Infrared (ATR-FTIR) spectrometer. The samples of edible oil and spectrometer are shown in Fig.2. The spectra are collected from 650 to 4 000 cm-1 with a resolution 4 cm-1 and with 10 scans. Each sample is scanned three times and the average is used for analysis. The spectra of all samples measured on ATR instrument are shown in Fig.3.
 | Fig.2 ATR spectrometer and edible oil samples |
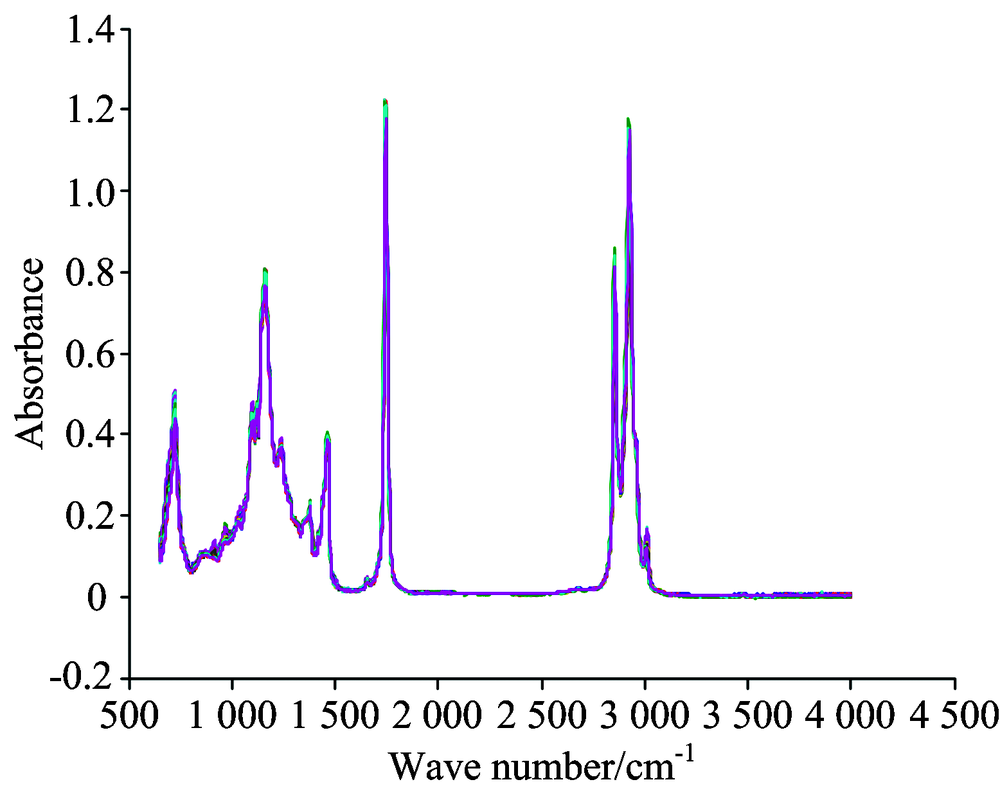 | Fig.3 The spectra of all samples measured on ATR spectrometer |
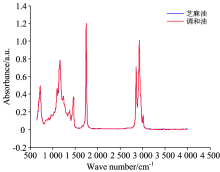
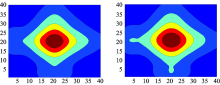
2D spectra contour map is used to generate the spectra image based on autocorrelation analysis. The spectra of two samples belong to sesame oil and blend oil respectively are shown in Fig.4. The shapes of spectra of edible oils are almost the same in Fig.4. The spectra from 558 to 598 cm-1 are processed into a spectral image by the visualization method. The spectral images of two kind edible oil are shown in Fig.5. Obviously, the spectral difference after visualization becomes apparent and it is easier to classify the visualized spectra of edible oils.
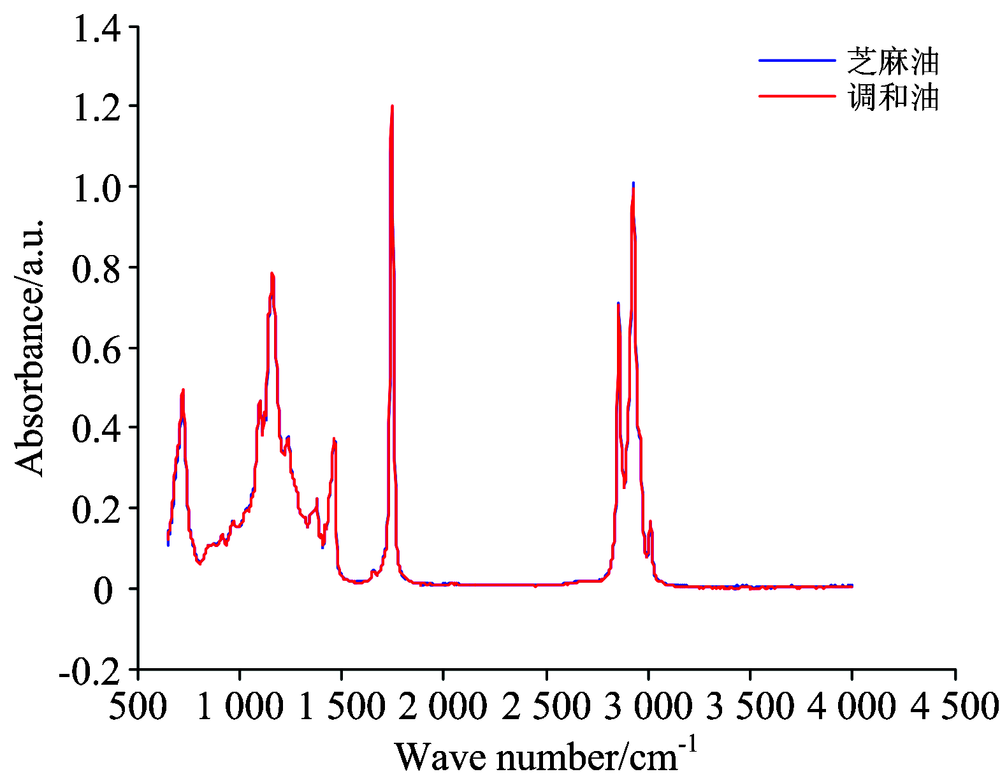 | Fig.4 The IR spectra of sesame and blend oil |
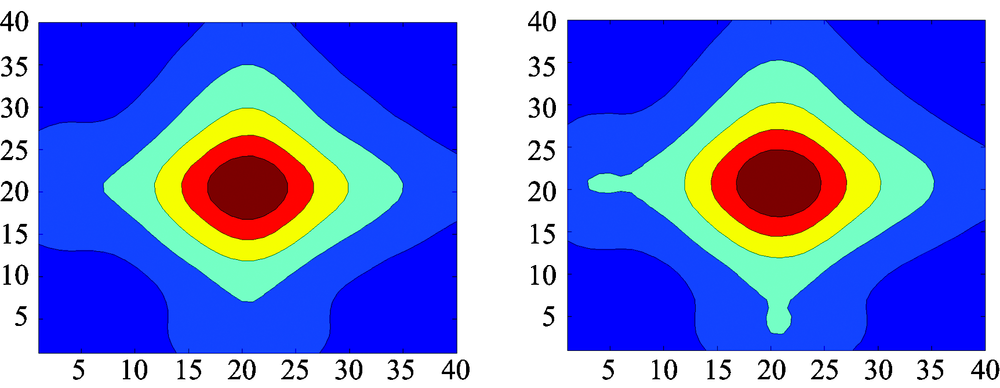 | Fig.5 The IR spectral images of sesame (a) and blend oil (b) |
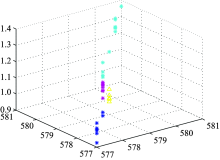
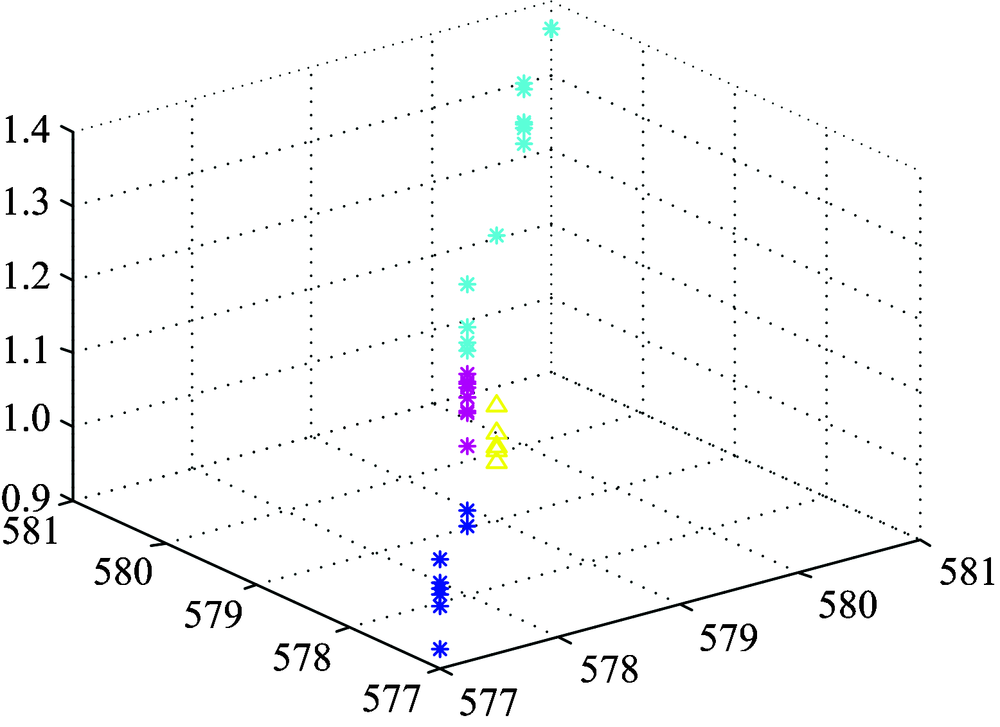
The characteristic absorption band in IR is caused by vibration of molecular groups and appears as the local extrema, which can be extracted by the image dilation in the visualized spectra image. Choose the local extrema of the spectra image and then observe the distribution of the extrema. The distribution of the first extreme is more representative, as shown in Fig.6.
 | Fig.6 The distribution of the first extreme (four kinds of edible oil) |
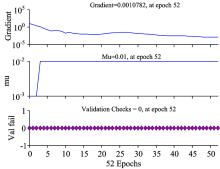
In this work, BP neural network with supervised learning is applied to classify the local extrema in the spectra image of edible oil, and the minimum training rate of the BP neural network is 0.1, and the error is 0.01, and the number of iterations is 800, and the training process is shown in Fig.7, and the BP classification model is established.
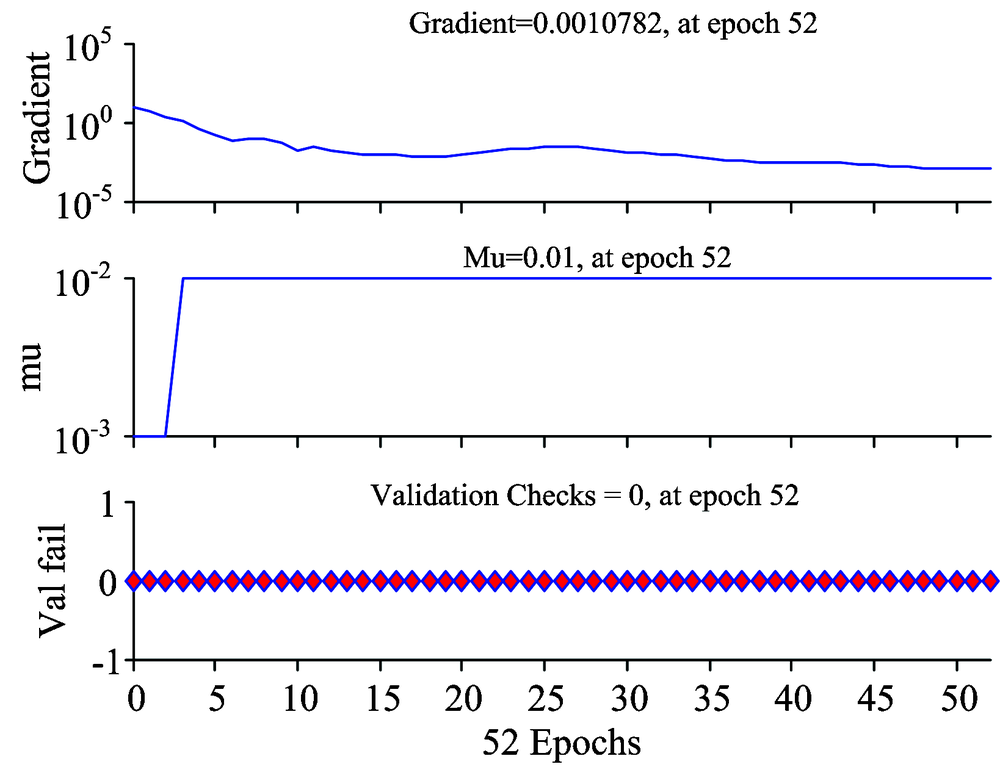 | Fig.7 The trainingstate of BP neural network |
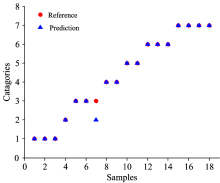
18 validation samples are predicted by the established BP classification model, and the results are shown in Fig.8 and the accuracy are shown in Table 2.
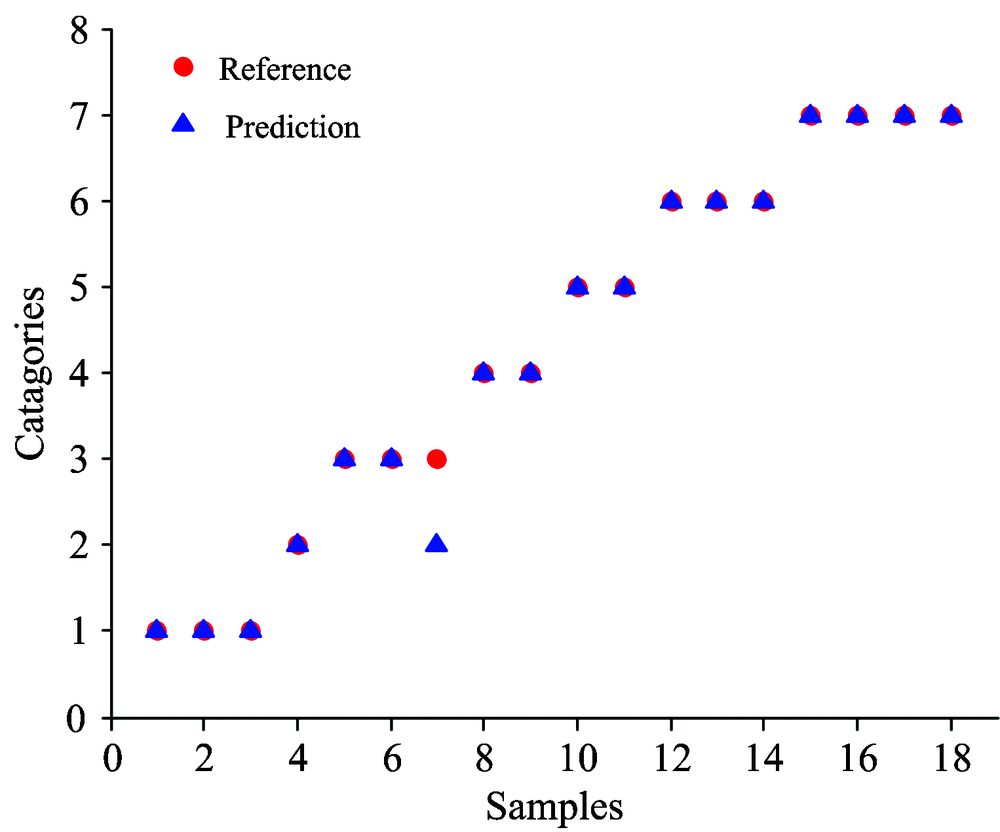 | Fig.8 The prediction results of with the trained BP classification model |
| Table 2 Classification results based on molecular spectra image recognition |
PCA is applied to analyze the calibration set of edible oil. The principle component number is chosen as 3 and the first three principal components score graphic of IR spectra is shown in Fig.9. From Fig.9, it can be seen that the projections of the IR spectra overlap on the principal component subspaces, therefore it is difficult to classify them directly.
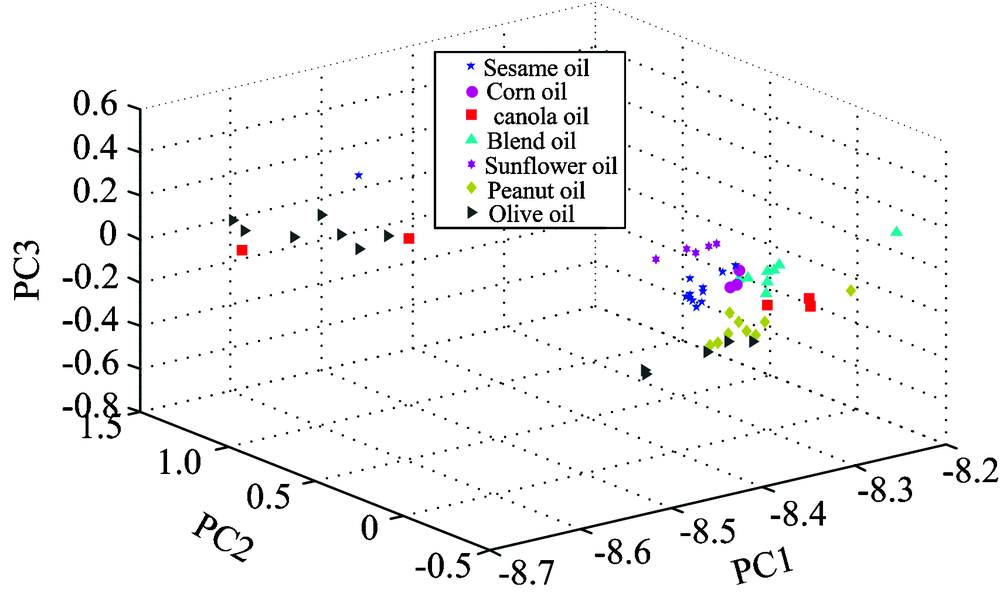 | Fig.9 Spatial distribution of IR spectra PCA for different edible oils |
Let the IR spectra data compressed by PCA and KL decomposition as the input of the neural networks to establish the classifiers of PCA-BP and KL-BP. The classification results are shown in Table 3. Since IR spectra projections of edible oils overlap on the principal component subspaces, and the nonlinear classifiers such as the neural networks are needed to classify them.
| Table 3 Classification results of PCA, PCA-BP and KL-BP |
In this work, a method of molecular spectra analysis based on image recognition for rapid classification of edible oil is proposed. The proposed method can not only increase the degree of visualization of the molecular spectra, but also enhance the differences between the spectra. The comparative experiment results have verified that the proposed method hadbetter classification of edible oils than that of traditional methods such as PCA, PCA-BP and KL-BP. The proposed method has provided a new way to classify the edible oil rapidly based on molecular spectra analysis.
The authors have declared that no competing interests exist.
| [1] |
|
| [2] |
|
| [3] |
|
| [4] |
|
| [5] |
|
| [6] |
|
| [7] |
|
| [8] |
|
| [9] |
|
| [10] |
|
| [11] |
|
| [12] |
|
| [13] |
|