


涤棉混纺织物近红外定量分析模型的建立及相关问题探讨
[时瑶1 , 李文霞1, *  , 赵国樑
, 赵国樑1 , 李书润2 , 王华平3 , 张朔4 ]
, 赵国樑|
|


在废旧纺织品回收再利用中, 纤维类型和含量的快速、准确测定是回收方案的关键部分。以598个废旧涤棉混纺织物为研究对象, 采用便携式近红外(
In waste textile recycling, the rapid and accurate determination of fiber type and content is a key part of the recovery program. In this paper, 598 waste cotton-polyester blended fabrics were used as the research object, and the raw near infrared spectra (
As type and composition of textile is very complicated, during the waste cotton-polyester blend fabric recycling, a key issue is how to identify fiber type and determinate its content accurately. At the factory, most textiles are sorted manually, but the disadvantage of this way is obvious, such as low recognition accuracy, high manpower and financial input. In the laboratory, the two mainly quantitative analysis methods of textile fiber are chemical dissolution and microscopic observation[1]. Due to long testing time, complicated analysis process and sample damage etc. shortcomings, the development of recycling waste textiles has been seriously hampered. Therefore, to explore a rapid, non-destructive and non-polluting quantitative method is very urgent. The NIR spectroscopy has many advantages mentioned above, at the same time since its equipment are able to adapt to the environment, easy to maintain and easy to operate, it has been widely used in many fields, including agriculture, petrochemicals, textile and pharmaceuticals[2, 3]. The application of NIR diffuse reflectance spectroscopy in the analysis of textile materials is mainly used to identify the material composition and predict the content of unknown samples[4], to verify the feasibility of quantitative analysis of fiber content in blended fabrics[5]. In 2015, Geng Xiang et al[6] established a quantitative analysis model of orientation degree of cotton and hemp fiber using PLS method. The model could predict the degree of orientation of unknown samples and identify cotton and hemp according to the degree of orientation obtained. James Rodgers[7] established the quantitative model of NIR for dyed cotton-polyester blended fabrics and explored the feasibility of NIR spectroscopy for quantitative analysis of dyed fabrics, but these studies could not be applied to on-site analysis.
A total of 598 cotton-polyester blend fabric samples were studied in this paper, and 252 samples of wide blend content range were used in calibration set (were pretreated by OSC and derivative etc.) to establish the quantitative analysis model[8], and the remaining 346 fabrics were used for prediction set to validate the accuracy and robustness of the model. The experiment results showed that sample analysis time was less than 10 seconds. In this article, results of initial assessment on accurately measuring the fibers content of waste cotton-polyester blend fabrics using NIR have been proved applicable.
All of 598 cotton-polyester blend fabrics were supplied by Jinghuan Textile Recycling Handan Co., Ltd. and Zhejiang Green Environmental Protection Co., Ltd. The sample set had a wide range of blended fabric content (
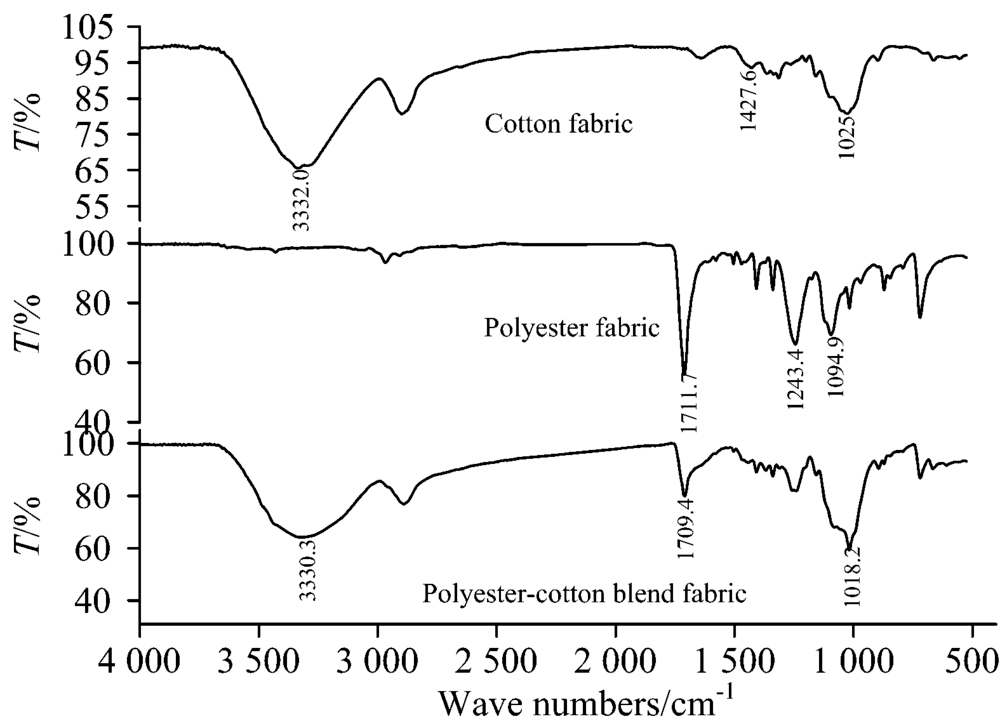 | Fig.1 MIR absorption spectra for cotton, polyester and cotton-polyester fabrics |
In the laboratory, temperature and humidity were 25 ℃ and 50%~70% of the conditions. NIR spectra of 252 cotton-polyester blend fabrics were measured on a portable SupNIR-1550 diffuse-reflection NIR spectrometer (Focused Photonies Inc. Hangzhou, China) with co-adding 30 scans ranging from 1 100 to 2 500 nm at 11 nm resolution. Each sample spectrum was produced by three-times-averaging, and the best thickness of tested samples was thicker than 3mm, which could prevent NIR light from passing through the sample and collecting background information. All of 598 cotton-polyester blend fabric samples had been washed to remove surface oil based stains, among which 252 samples were used in calibration set, and the other 346 swatches were used for validation set to verify the accuracy of the model. 100% cotton and 100% polyester fibers spectra were measured and compared. Fig.2 demonstrated that significant spectral differences of 100% cotton and 100% polyester were readily observed in several spectra regions, especially in the 1 400~1 700 and 1 900~2 200 nm, and these distinctive features could be used as a mark of the qualitative analyses of waste cotton-polyester blend fabrics. The NIR quantitative analysis calibration model was established by using PLS method and the model was validated by the parameters of RC, SEC, RP and SEP.
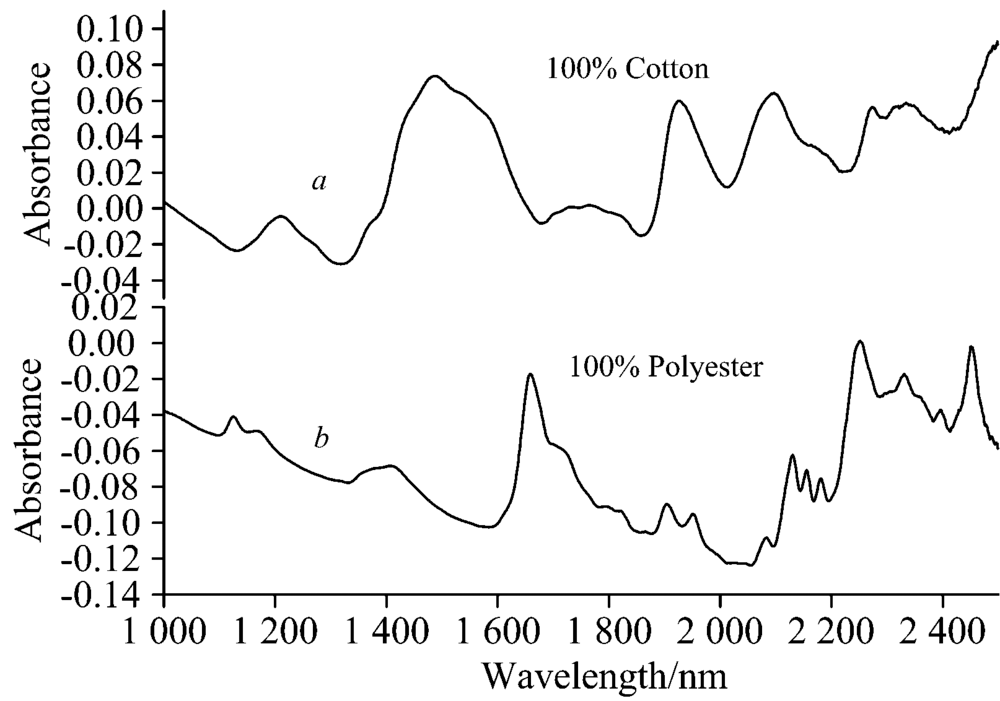 | Fig.2 The NIR absorbance spectra for cotton (a) and polyester (b) |
The primary NIR spectra (between visible and MIR spectral regions) were generally concerned with the region of 1 100~2 500 nm[10, 11] and were mainly the combinations of band and overtone band of several hydrogen-containing groups (
The reference value of the content of polyester-cotton blended samples was determined by acid dissolution method, in which cotton-polyester blend fabric was dissolved with 75% sulfuric acid, and the amount of cotton in the sample was calculated from the insoluble polyester. The reaction could be carried out in a water bath at 50 ℃ for about 1 hour, and the content of each sample was measured twice in parallel and the absolute error of the two measurement results did not exceed ± 3%. The average was used as a reference for the sample content established by the model.
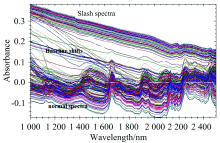
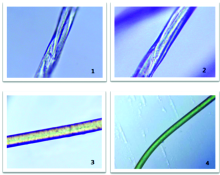
The NIR spectra of 252 training samples were shown in Fig.3. As could be seen from the spectrum, which presented two different types, one was normal spectrums, and the other one was slash spectra (spectral features disappear completely). At the same time, a few samples showed different baselines than most of the modeling samples (Fig.3). These baseline drift area was normally in 1 100~1 955 nm. It was possible that these baseline drifts were caused by differences in fabric stitch structure, delusterant or dyeing method. Samples of different stitch structure normally generate slightly difference to NIR spectra, and the baseline drift was usually produced by darker colored fabrics, as shown in Figure 4. Fabric surface effects (e.g. decolorant, delusterant) often led to slash spectra, so did the fine particles, which were attached to the surface of the fiber. A photograph of the microscope was shown in Figure 5, which documented the microstructure of the fiber. As these microscopic photographs showed, the fiber surface of slash spectra samples was rough compared to most of the modeling samples and the fiber surface was distorted, as shown at 1, 2 in Fig.5, which could reduce the light reflection of the fiber due to the loss of their luster. It was much more probable that these features brought about the formation of slash spectra[9]. While the fiber surface of normal NIR spectroscopy tended to be smooth with no other particles on its surface, as shown at 3, 4 in Fig.5.
 | Fig.3 NIR absorption spectra for calibration set |
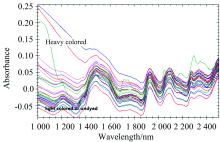
 | Fig.4 NIR absorption spectra for different colored cotton fabrics |
 | Fig.5 Microscope photo for 100% polyester fiber |
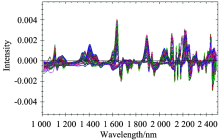
As could be seen from Figure 3, the baseline drift could not completely affect the position of the main absorption wavelength, however, they could seriously impact the intensity of absorbance in these spectral regions[12]. To eliminate the baseline drift, 1st derivative was applied to the original spectra combined with S-G smoothing with second-order polynomials and 13-point windows. During the spectra preprocessing, derivative Math was often used to minimize spectral differences and to eohance small differences between similar samples. These spectra were pretreated by derivative and the results were presented in Fig.6. The results showed that compared with other samples, the extinction effect did not impact the intensity of the derivative spectrum in each spectral region, abd the broad spectra turned into sharp’ s, and the spectrum signal became very strong compared to the original NIR spectrum. In general, For NIR spectroscopy baseline drifts, the influence of fabric stitch structure on the NIR spectra was less significant than that of color, meanwhile, and slash spectra were also emerged features like normal spectrums after preprocessing.
 | Fig.6 NIR 1st derivetive spectra for all calibration set |
2.3.1 Establishment of quantitative calibration model
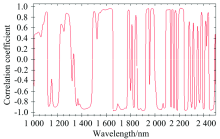
As could be seen from Fig.2, the greater spectral differences between cotton and polyester in waste cotton-polyester blend fabrics gave a good basis for establishment of NIR quantitative calibration model. The preprocessing method was an important part to NIR pretreated. Derivative, standardization and signal correction were often used to handle the NIR spectrum for all training sample, and derivative normally was utilized to minimize the spectral difference and baseline drifts, and signal correction generally was used to handle the other disadvantage factors. In a word, preprocessing methods were applied to deduct the non-objected spectra affect on the target one. According to the literature, OSC could remove orthogonal part of spectral matrix X and appropriate value matrix Y. As a newly developed processing method, however, there was an easily ignored disadvantage that spectral noise was not absolutely orthogonal to matrix Y when OSC method was used to handle the NIR data. Therefore, OSC could only eliminate the orthogonal part, but the residuals of noises also could affect robustness of the calibration model seriously, and might be a reason for over fitting. So a series of wavelength selection methods were applied to process NIR data before OSC, and unrelated points to models were removed to eliminate noises interference to some extent. In addition, characteristic wavelength filtered could reduce the cost of computation, and the robustness of calibration model would be improved, and correlation coefficient method was used to select wavelength in this paper. The correlation coefficient method was a correlation calculation for spectral matrix of calibration set, absorbance vector xi for each wavelength to components underdetermined yi array of concentrate vector, and obtained a figure of wavelength-correlation coefficient such as Fig.7. The r was obtained by the following formula.
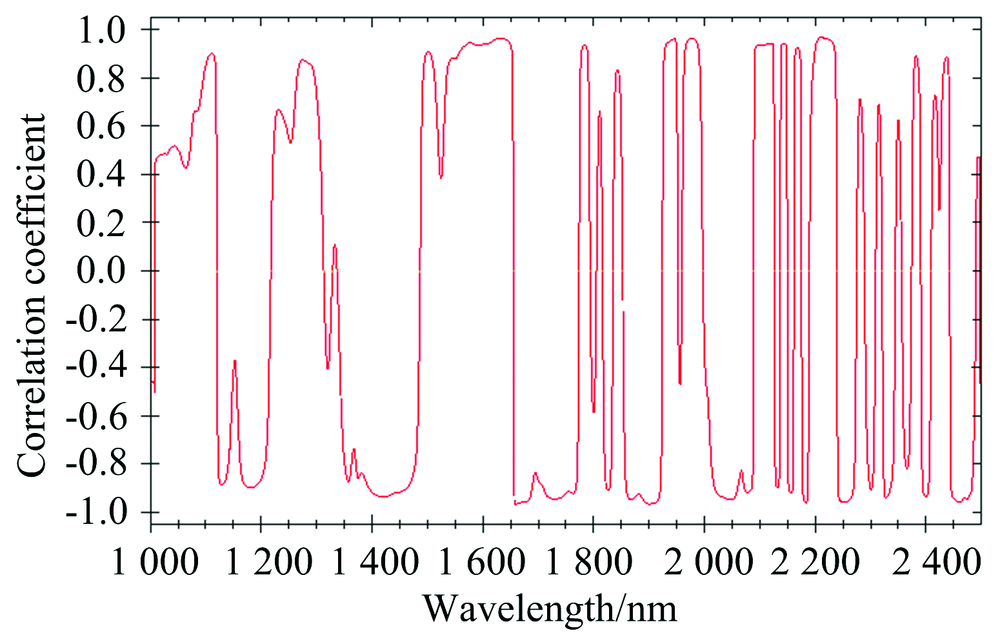 | Fig.7 Wavelength-correlation coefficient |
The NIR quantitative calibration model was established by fiber content of 252 calibration samples (containing samples with a wide polyester content range and diverse colors), combined with chemometrics.
The spectra were pre-processed by 1st derivative, S-G smoothing, mean centering and other signal correction method in the region of 1 400~2 500 nm, and the results were shown in Table 1. The statistical data indicated that the model established by OSC combined with 1st derivative and mean centre preprocessed showed the best result (prediction accuracy was 97.6%) for the quantitative analysis of cotton or polyester content in waste cotton-polyester blend fabrics.
| Table 1 Calibrated results and predicted results of polyester-content by different pretreated methods |
The correlation coefficient plot for LAB and NIR polyester content in best model as described in Fig.8, which had a strong correlation (R2 was 0.995 8). From the figure we could see some abnormal samples, which were called “ outlier samples” . There are two kinds of outliers. One was the error of reference value measured or spectrum scanned, which could seriously influence the accuracy of the model, so it must be removed in the optimized model. The solution to this problem was that each sample was re-measured or scanned, and the results were compared with the previous one. The other one was that there was significant difference between outliers and the major modeling samples, and the accuracy of the model would be improved if these samples were removed, but adaptability of model would be reduced simultaneously because of the particularity of their properties. The common method used to solve this problem was establishing a new model, but this was not a practical solution since there was substantial cost and time associated with the development of a robust calibration model. At the same time, It had been proved that the part of singular samples also caused baseline drifts.
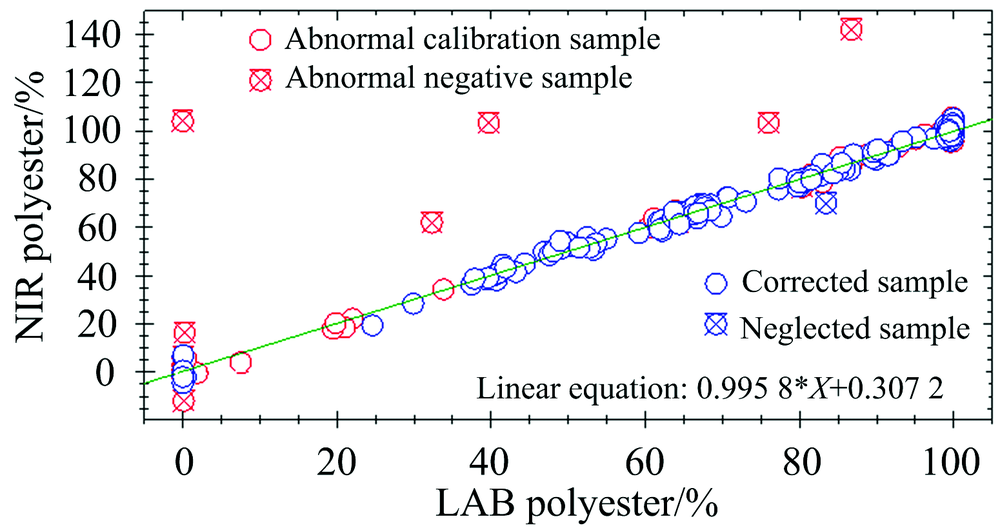 | Fig.8 Correlation coefficient plot for polyester content |
2.3.2 Validation of quantitative model
In order to make the model applied to the actual analysis work, the accuracy and precision of the best model has been tested. Matching samples t-test applied to the LAB polyester content and NIR values of 346 calibration samples to verify the accuracy of the best model, the results were shown in Table 2. The absolute error of the LAB value and NIR value was all within (-3%, 3%), and the matching samples t-test showed that there were no significant difference between LAB and NIR value with 95% confidence bounds and 5% significance level (tpolyester=0.144< t0.05, 345=1.967). At the same time, changing measurement environment (e.g. temperature, humidity), 6 times spectrum scanning for each sample, and the predicted value of polyester was obtained by quantitative calibration model. The result was shown in Table 3, which presented better repeatability.
| Table 2 T-test of LAB and NIR values |
| Table 3 Repeatability test of the model |
Under the optimum test conditions (temperature of 25 ℃, relative humidity of 50%~70%, sample thickness of 3 mm or more), the raw NIR spectra of cotton-polyester blended fabrics were obtained in the range of 1 100~2 500 nm. The causes of the slant spectrum and the reasons for the baseline drift in the shortwave region and the selection of the pretreatment methods were also discussed. Using the PLS method combined with OSC, 1st derivative and mean-center pretreatment method, the NIR quantitative model of cotton-polyester blended fabric was established. RMSECV value of the model was 0.002, and RC value was 0.998, and RP value was 0.997, and SEP value was 1.121, and the model prediction accuracy was up to 97%, and analysis time was less than 10 seconds. The model could be used to predict the content of waste cotton / polyester blended fabric quickly and accurately.
The authors have declared that no competing interests exist.
| [1] |
|
| [2] |
|
| [3] |
|
| [4] |
|
| [5] |
|
| [6] |
|
| [7] |
|
| [8] |
|
| [9] |
|
| [10] |
|
| [11] |
|
| [12] |
|