


TG-2/MAI CCD像元响应特性不一致性的在轨分析及校正
[郭俊杰1, 2, 3, 4 , 姚志刚1, 4, 5, *  , 韩志刚
, 韩志刚1, 4 , 赵增亮1, 4 , 严卫3 , 江军1, 4 ]
, 韩志刚|
|


CCD像元响应特性的差异是制约MAI成像质量及其数据定量化应用的主要因素之一。 为了提高MAI数据质量, 本文基于全量程多段分析与校正法, 利用2016年9月至2018年3月期间共104403帧观测数据, 分别对MAI偏振通道和非偏振通道的像元响应特性的不一致性开展了在轨分析与校正, 并利用GOME-2和MODIS数据产品对校正结果进行了验证。 首先, 假定观测样本足够多, 即每个CCD像元观测的样本具有相同的遍历性, 则各CCD像元对应的所有样本的平均DN值可以代表CCD各像元的响应特性; 其次, 利用104 403帧观测数据构建各个通道的参考图像, 并利用MAI中心5×5像元给出各参考图像对应的标准DN值; 在此基础上分别对MAI偏振通道和非偏振通道开展了像元响应特性的分析, 结果表明, MAI各通道均存在CCD像元响应特性不一致的问题, 各通道的不一致性大约在4%~10%之间, 对偏振通道而言, 同一偏振波段的三个偏振通道之间像元响应特性的不一致性有一定的相似性, 像元响应特性不一致性的差异基本在1%以内。 然后, 将MAI近两年的观测数据分为前后两个时间段进行对比分析。 结果表明:前后两个时间段偏振通道和非偏振通道的图像均具有很好的一致性, 即CCD像元响应特性未随时间发生显著变化, 这也进一步验证了前面MAI数据量充足的假定。 因此, 可以利用全量程多段校正法逐通道逐像元开展CCD像元响应特性不一致性的校正。 基于该方法校正后, MAI图像质量得到显著改善, 图像四周响应偏低的区域明显改善, 基本和周围像元的响应达到了同一水平; 图像更加平滑, 颗粒感基本消除; 部分区域的场景发生了变化, 特别是碎云等反射率介于中低反射率之间的目标。 基于GOME-2的交叉对比结果表明, MAI 565, 670和763 nm波段反射率与GOME-2的参考反射率之间的平均绝对偏差分别由校正前的1.6%, 4.2%和2.2%减小至校正后的0.5%, 2.6%和0.4%; 此外, 基于多通道云识别方法开展的云检测表明, 校正后的MAI云检测结果与MODIS云检测产品一致性更好。 因此, 全量程多段校正方法可以有效解决MAI CCD像元响应特性的不一致性, 显著提高MAI在轨观测的质量, 且该方法也可以应用于其他CCD仪器的在轨校正。
, HAN Zhi-gangThe difference in the response characteristics of charge-coupled device (CCD) pixels is one of the main factors restricting the quality of the Multi-angle Polarization Imager (MAI) and its quantitative application. In order to improve the quality of CCD imaging, this paper used a total of 104,403 frames of observational data from September 2016 to March 2018, based on the full-range multi-section analysis and correction method, to realize the analysis and correction for the inconsistency in the pixel response characteristics of MAI polarized and non-polarized channels. And the results were verified using the Global Ozone Monitoring Experiment 2 (GOME-2) and Moderate-Resolution Imaging Spectroradiometer (MODIS) data. Firstly, assuming there are sufficient observational samples, that is, the objects observed by each pixel have the same ergodicity, and the average Digital Number (DN) value of all samples corresponding to each CCD pixel could represent the response characteristics of each pixel of the CCD. Secondly, constructing reference images for each channel by using 104 403 frames observation data, and the 5×5 pixels in the CCD center are used as standard DN values corresponding to each reference image. Next, the response characteristics of the MAI polarized and non-polarized channels are analyzed respectively. The results show that there is significant inconsistency in the response characteristics in each MAI pixel and each channel. The inconsistency in each channel falls roughly between 4% and 10%. And for polarized channels, the inconsistencies in the pixel response characteristics between the three polarized channels in the same polarization band have some similarities, but there are certain differences, and the difference in pixel response inconsistency is basically within 1%. Then, the observational data for two years are divided into two periods for comparative analysis. The result shows that the CCD pixel response characteristics do not decay over time. This also shows that the amount of reference image data is sufficient, which further rerifies the rationality of the above assumptions. Therefore, the full-range multi-section correction method can be used to correct the inconsistency of each pixel’s response characteristics on a channel-by-channel basis. After correction was performed based on this method, the image quality of MAI is significantly improved. The dependence on the observational zenith angle of the CCD pixel response is significant. The image is smoother, and the graininess is basically eliminated. Also, the scenes of some areas have changed-especially targets with a reflectivity between low and medium reflectivity, such as broken cloud and so on. Compared with GOME-2, the average absolute deviations between the reflectance of the MAI 565, 670, and 763 nm bands and the GOME-2 reference reflectance are reduced from 1.6%, 4.2%, and 2.2% to 0.5%, 2.6%, and 0.4% after correction, respectively. In addition, the cloud detection result based on the multi-band cloud identification method shows that, compared with the MODIS cloud detection product at a similar time, the corrected MAI cloud detection result looks more accurate. Therefore, the full-range multi-section analysis and correction method can realize the monitoring and correction of the inconsistency in the response characteristics of the MAI CCD pixels, which significantly improves the quality of the on-orbit observations of this instrument. And this method can also be applied to the on-orbit calibration of other CCD instruments.
MAI did not carry out laboratory inconsistency calibration for some objective reasons, so only on-orbit inconsistency correction can be performed. The method used to perform the inconsistent pixel response characteristics of Polarization and the Directionality of the Earth’ s Reflectances (POLDER)— an instrument dedicated to the observation of the polarized and directional solar radiation reflected by the Earth-Atmosphere system— is mainly based on the fact that the inconsistencies caused by the optical system and the CCD itself are regarded as low-frequency and high-frequency changes, respectively[10, 11, 12]. Also, for such high-frequency and low-frequency changes, laboratory corrections based on integrating spheres and on-orbit corrections based on cloud scenes and desert scenes have been conducted[13, 14, 15]. However, in fact, as a whole imaging system, the interaction of the optical lens, filters and CCD array area causes inconsistencies in the response characteristics of pixels. Therefore, distinguishing them for consideration may ignore some of the energy transfer process in the imaging system. Subsequently, both the calibration of the integrating sphere in the laboratory and the typical scene correction on-orbit are difficult to achieve the correction of the full range of inconsistencies in the pixel response characteristics, only the correction of high-frequency and low-frequency changes under single irradiation conditions can be achieved.
In order to analyze the inconsistencies of the pixel response characteristics of the MAI on-orbit, improve the quality of the observational data, and present a new approach for the monitoring and correction of the inconsistency in the pixel response characteristics of the on-orbit CCD detector, this paper presents a full-range multi-section analysis and correction method based on on-orbit observational data, and uses the GOME-2 data and the MODIS products to verify the correction results.
The MAI consists of a wide-field-of-view optical system, a filter combination wheel, and a CCD area array detector. The number of effective pixels of the CCD array is 256× 256, and the pixel size is 26× 26 μ m. The MAI contains six observational bands, totaling 13 channels[16, 17, 18]. The specific channel settings are shown in Table 1.
| Table 1 Spectral channel characteristics of the MAI |
A total of 104 403 frames of observational data were acquired by the MAI from September 2016 to March 2018, with each frame containing observational data from the instrument’ s 13 channels. We used all the observational data available during this period for our analysis in this paper.
Assuming there are sufficient observational samples, i.e., the samples observed by each CCD pixel have the same ergodicity; if the response characteristics of each CCD pixel are consistent, the sample mean value obtained by all CCD pixels should be consistent. Otherwise, the results obtained will be non-uniform.
Based on this principle, this paper presents a full-range multi-section analysis and correction method, based on long-term on-orbit observational data, to monitor and correct the inconsistency in the response characteristics of TG-2/MAI CCD pixels.
In order to analyze and correct the inconsistency in the response characteristics of the MAI pixels, the concept of a reference image is introduced. For each channel, the 104 403 data corresponding to each CCD pixel are sorted in ascending order according to the scale of the DN value, and then the 104 403 data are equally divided into 30 parts according to the DN value from the smallest to the largest.Thus, to average the data, each pixel then gets 30 reference DN values. The reference DN value of all pixels in the same part constitutes a layer of the reference image. Similarly, each channel can get 30 reference images with different ranges of DN values.
In addition, since the absolute radiation calibration of the MAI is processed for 5× 5 pixels in the CCD center, and assuming that the CCD center pixels are the standard, the DN value of the 5× 5 pixels in the center of each layer of the reference image is therefore averaged as the standard DN value of the reference image of the layer.
Because the MAI has no onboard correction system, the reference image, instead of the uniform irradiation, was used to quantitatively analyze the inconsistency in the pixel response during the MAI’ s operation on-orbit. In fact, the inconsistency in the pixel response behavior is the horizontal non-uniformity of imaging under uniform irradiation conditions. Therefore, a quantitative evaluation index for the inconsistency in the CCD pixel response is given, combined with the laboratory’ s non-uniformity measurement index. Generally, there are two quantitative assessment method types that can be employed:a task-based metric method, which is less commonly adopted because of the greater degree of subjectivity; or a measurement method, based on objective formulas, for which the method of expression varies. In this paper, we combine the actual demand, based on the standard variance measurement method, to define the inconsistency in the pixel response (ICPR). More specifically, this is the ratio of the root-mean-square value, which is the difference between each pixel’ s DN value and the average DN value of the reference image, corresponding to when the standard DN value is one-half of the saturation exposure, and the average DN value of the reference image, under uniform irradiation conditions. Mathematically, the expression is as follows:
Here,
Due to various objective factors, an onboard correction system was not set up on the MAI. At the same time, in the pre-laboratory calibration stage, an analysis and correction of the non-uniformity of CCD pixels was conducted, for gains and offsets of representative pixels in a limited direction.Therefore, in order to analyze the inhomogeneity of each channel during on-orbit operation, we first examined the response characteristics of the polarized and non-polarized channels using the full-range multi-section analysis method, based on long-term on-orbit observational data.
2.1.1 Polarized channels
Polarization observations have unique advantages for the inversion of parameters such as cloud phase, the effective radius of cloud droplets, and aerosol optical thickness[17, 18, 19, 20, 21]. In order to ensure the accuracy of the inversion of these various physical parameters, it is necessary to carry out quality control on the MAI Level 0 data. Taking the 865 nm band (channels 7, 8 and 9) as an example, the response characteristics of the pixels of the MAI polarized channels are analyzed.
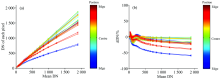
The area array CCD includes a large number of pixels. To simplify the description, the center pixel of each 51× 51 pixel area is taken as a representative pixel, and the calculation results of 25 representative pixels only are given. Figures 1(a), (c) and (e) show the responses of the three channels in the 865 nm band for each pixel under different incident radiation. The abscissa is the standard DN value of each layer of the reference image, and the ordinate is the actual output DN value corresponding to each pixel. In the figure, the line colors represent CCD edge pixels, centric pixels, and edge pixels, in the order from blue to red. Figures 1(b), (d) and (f) show the relative deviation between the DN value of each pixel and the standard DN value of the reference image of the three channels under different incident radiation conditions.
Figure 1 shows that the MAI CCD pixels exhibit a significant nonlinear response, and the nonlinear response characteristics of each pixel are inconsistent. Also, the response of the CCD edge pixel is significantly lower than that of the center pixel. Subsequently, under different irradiation conditions, due to the distinctresponse for each pixel, the horizontal non-uniformity of the MAI imaging is different
 | Fig.1 Pixel response function and relative deviation distribution in the 865 nm band:(a) channel 7; (c) channel 8; (e) channel 9. Panels (b), (d) and (f) show the relative deviation of the pixel response from the standard response for channels 7, 8 and 9, respectively |
under different uniform irradiation conditions. In addition, the response characteristics of three polarization channels with different orientation angles of the same band are similar, but there are also clear differences. By contrast, the distribution of the relative deviation of the channels with a polarizer orientation angle of 0° is more concentrated than that of the other channels.
2.1.2 Non-polarized channels
Taking the 910 nm band (channel 12) as an example, the response characteristics of non-polarized channel pixels are analyzed. Like in Figure 1, Figure 2 shows the response function and the relative deviation distribution of each representative pixel. The results show that, as the standard DN value increases, non-polarized channels also (like polarized channels) have the problem of inconsistent nonlinear pixel response characteristics.
 | Fig.2 The (a) pixel response functions and (b) relative deviation between the pixel response and standard response for the 910 nm band (channel 12) |
Compared with the pixel response characteristics of the polarized band, the non-polarizedchannel pixel response characteristics are more similar to the polarizedchannelswhose polarization plate has an orientation angle of 0° . The distribution of the relative deviation curve of most pixels is more concentrated. In adidtion, the maximum relative deviation of the non-polarized channel is significantly lower than that of polarized channels.
In order to quantify the inconsistency in the pixel response characteristics of each channel during MAI operation on-orbit, this paper approximates the 30th layer of the reference image as the MAI imaging result when onehalf of the saturated exposure is under uniform irradiation conditions. Figure 3 demonstrates quantitatively the inconsistency in the pixel response characteristics of each channel of the MAI.
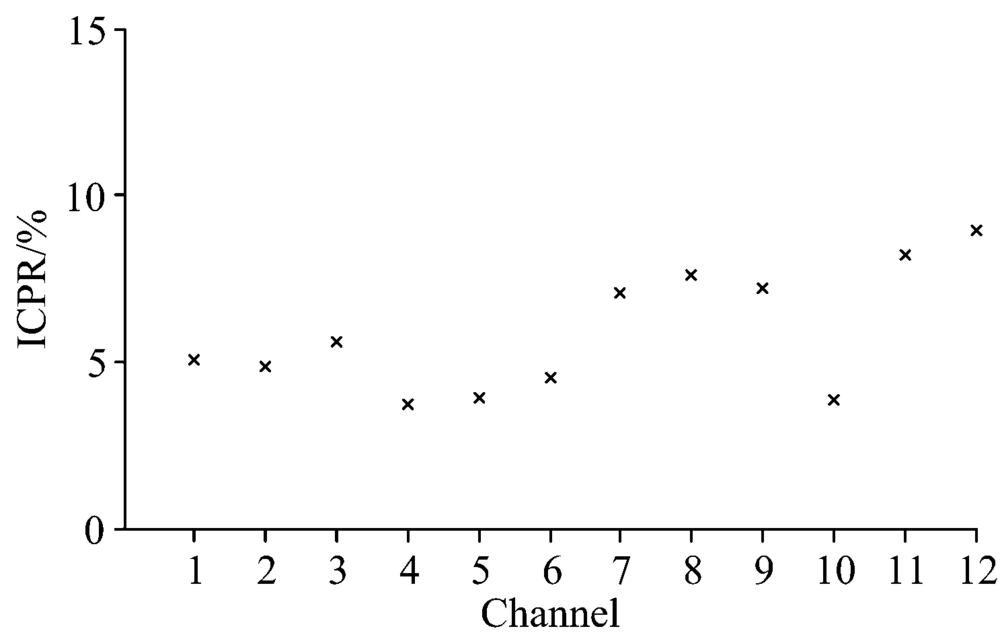 | Fig.3 Inconsistent response characteristics of pixels in each channel of the MAI |
Figures 3 shows that there is significant inconsistency in the CCD pixel response characteristics of each channel. Also, the inconsistency in the pixel response characteristics of channel 4 is the lowest, at about 4%, while channel 12 is the highest, up to about 10%. Therefore, the pixel response characteristics of the polarized channels and non-polarized channels have certain differences. In the polarized channels, the inconsistency in the pixel response characteristics between different polarized bands is quite different. The 565 nm band (channels 4, 5 and 6) is relatively low, at about 4%, while the 865 nm band (channels 7, 8 and 9) is relatively high, reaching about 7%.The inconsistency in the pixel response characteristics between the three polarized channels in the same polarization band have some similarities, although there are certain differences, and the difference in pixel response inconsistency is basically within 1%.For non-polarized channels, the inconsistency in the pixel response characteristics between channels is also very different, with channel 10 being the lowest, at about 4%, and channel 12 the highest, reaching about 10%.
Overall, the nonlinear response characteristics of MAI pixels present significant inconsistencies, and there is clear channel dependence. The three main reasons for these characteristicsmight be as follows:Firstly, there is inconsistency in the nonlinear response of pixels in the MAI CCD itself.Secondly, there are differences in the performance of the filters used in each channel, and this problem is difficult to avoid because even when the same filter from the same manufacturer is used, the problem still exists. Thirdly, in the polarized channels, in addition to the effect of the filter, the difference in the polarization angle of the polarizer results in distinct response characteristics of the different polarized channels in the same polarized band.
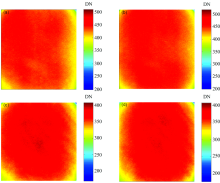
In order to monitor the response characteristics of each CCD pixel during MAI operation on-orbit, the observational data for two years are divided into two periods for comparative analysis:from September 2016 to February 2017, and from June 2017 to March 2018. The amounts of data in the two periods are 55 689 frames and 48 714 frames respectively. Also, from March 2017 to May 2017, the MAI was offline, so no data are available for that period. Figure 4 compares the average MAI images of channel 8 and 12 in the different time periods. Figure 4 shows that the images of the polarized channels and non-polarized channel both have good consistency in the two periods, and the CCD response characteristics do not change significantly with time. This further verifies the earlier assumption that the MAI data volume is sufficient.
 | Fig.4 Comparison of the average MAI images of (a, b) channel 8 and (c, d) channel 12 from (a, c) September 2016 to February 2017 and (b, d) March 2017 to March 2018 |
In this paper, the full-range multi-section correction method is used to correct the inconsistency of the CCD pixel response characteristics. The theoretical model is as follows:
For a p× q area array CCD, the illumination intensity corresponding to the CCD response from zero to saturation is divided into m illumination levels, and the corresponding CCD output image Vref(i, j, k) is measured at the illumination levels φ 1, φ 2, …, φ m, where i=1, 2, …, p, j=1, 2, …, q, k=1, 2, …, m. Vref(i, j, k) are called the reference image corresponding illuminance φ k, which expresses the non-uniform response of the CCD under illumination φ k.
In order to correct the inconsistency of the CCD pixel response characteristics, the response value Vavg(k) of the CCD center pixel under the illumination φ k is used as the standard response.
For any image to be corrected Vd(i, j), it is first determined, pixel-by-pixel, which region of the reference image Vref(i, j, k) the DN value of the pixel Vd(i, j) falls within, according to to determine the k.
Finally, the corrected image Vc(i, j) can be obtained according to the following equation
Based on the actual situation of the MAI, a correction model based on MAI measured data is given.
(1) Construction of reference image
The range of the MAI CCD DN value is 0~4 095. To make it possible to correct the inconsistency in the pixel response characteristics in each illumination range, construct a 30-layer reference image. In the actual correction process on-orbit, the division is directly performed according to the scale of the pixel DN value. In this paper, the observational data of each channel of the MAI from September 2016 to March 2018 are sorted in ascending order, pixel-by-pixel, and divided into 30 equal parts.Each part is averaged for each channel and each pixel to obtain a reference image Vref(i, j, k), 30 layers of reference images can be obtained for each channel.
(2) CCD standard response
Assuming that the CCD center pixel is a standard response.Accordingly, due to the influence of the optical lens, filters, etc., the center of the CCD imaging tends to deviate from its geometric center. Therefore, the center point obtained by the collimated light tube geometry calibration is used as the center of the CCD. The average value of the center of the reference image 5× 5 pixel DN values Vavg(k) is taken as the standard response of the layer.
(3) Correction algorithm of the inconsistent response characteristics
Assuming that the count value of the pixel (i, j) to be corrected is Vd(i, j), and the corresponding corrected count value is Vc(i, j), the value of k is firstly determined according to Vref(i, j, k)≤ Vd(i, j)≤ Vref(i, j, k+1). Then, the corrected count value Vc(i, j) of the pixel of the channel is calculated according to the correction formula given in Section 4.1.
If the DN value of the pixel to be corrected falls outside the 1st or 30th layer of the reference image, extrapolation is performed using the 1st layer and the 2nd layer, and the 29th layer and the 30th layer, respectively.
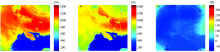
In order to intuitively express the changes before and after correction of the inconsistency in the response characteristics of the pixels of the MAI CCD, Figure 5(a) gives the imaging of channel 7 on September 23, 2016 as a correction example. Figures 5(b) and (c) are the corrected image and deviation image before and after correction, respectively. According to Figure 5(c), the deviations before and after correction are mainly concentrated on the four corners or edge regions of the image. Figures 5(a), (b) and (c) show that, after the correction, the low-response area is obviously improved, which reaches the same level as the response of surrounding pixels. The dependence on the observational zenith angle of the CCD pixel response is significantly reduced. And the image contrast is significantly improved, the cloud and coastline contours are clearer. The image is smoother, and the graininess is basically eliminated. Also, the scenes of some areas have changed— especially targets with a reflectivity between low and medium reflectivity, such as broken cloud, and so on. Therefore, the nonlinear response of CCD pixels will have a considerable impact on the subsequent quantitative product generation.
 | Fig.5 Comparison of channel 7 imaging results before and after correction on September 23, 2016. Panels (a), (b) and (c) are the channel 7 pre-correction image, corrected images, and deviation image, respectively |
In order to verify the correction results, Metop-B/GOME-2 hyperspectral data were used to cross-contrast with the MAI Level 1 products. The specific data-matching method employed is described in[22]. Figure 6 shows the cross-contrast results after the correction, and Table 2 shows the results before and after correction. Analysis of Figure 6 and Table 2 shows that, after the correction, the average absolute deviations of the reflectance of the MAI 565, 670 and 763 nm bands and the GOME-2 reference reflectance were significantly reduced, from 1.6%, 4.2% and 2.2% to 0.5%, 2.6% and 0.4%, respectively. In addition, the relative deviation also reduced, from 12.3%, 27.0% and 26.0 to 1.9%, 11.9% and 3.8%, respectively.
| Table 2 Comparison of cross-contrast results before and after calibration |
 | Fig.6 Calibration results after correction (a):565 nm band; (b):670 nm band; (c):763 nm band |
In addition, the standard deviation of the cross-contrast before and after the correction was also calculated, but the expected improvement was not achieved. The reasons may be as follows:Firstly, there are relatively few areas for matching samples— particularly, in the region corresponding to the CCD edge, with a large amount of correction. Secondly, the difference in the spatiotemporal matching of the sample has a certain influence on the cross-contrast results.
The purpose of quality-controlling the MAI Level 0 products is the quantitative application of data. In order to analyze the influence of the correction on the quantitative application of data, the results of MAI cloud detection are analyzed, and then verified against the MODIS product.
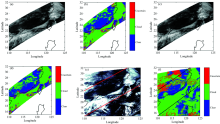
The MAI observational result on January 1, 2017 was selected, and the multi-band threshold method was used to perform cloud detection before and after correction according to the same conditions. Figure 7 shows the visible image and cloud detection results of the MAI and MODIS at a similar time, where in the boxed areas in Figures 7(e) and (f) are the intersection areas of the MAI and MODIS, respectively. Figure 7 shows that, after the correction, the overall effect of the MAI reflectance image did not change significantly, but the cloud detection results did change significantly. Compared with the MODIS cloud detection product at a similar time, the corrected MAI cloud detection result looks more accurate. For example, for the region near (26° N, 117° E), most regions were identified by the MAI as clear sky before correction; but, after correction, they were identified as having the presence of broken clouds. This is in agreement with the MAI visible image, MODIS visible composite image, and MODIS cloud identification products. Therefore, the MAI imaging quality can be significantly improved by full-range multi-section correction, in particular, the accuracy of the target images whose reflectance between the low and medium values(broken cloud, ground surface, vegetation, etc.) can be improved.
 | Fig.7 MAI cloud detection product verification:(a, b) MAI visible image and cloud detection results before correction; (c, d) MAI visible image and cloud detection results after correction; (e, f) three-channel synthesis image and cloud detection products of MODIS at a similar time |
The correction laid the foundation for the target feature recognition and data quantification application for the later period.
However, there are still some differences between the corrected MAI cloud detection results and the MODIS cloud detection products. There are two possible reasons for this:Firstly, the transit time of TG-2 and AQUA differ by 13 minutes. The unstable clouds in the area seem to disappear, move, and so on, which may cause some differences in the targets observed by sensors at the same location. And secondly, the MAI only has visible and near-infrared bands.Without infrared channels, there may be some errors in identifying some targets based on multi-channel cloud detection methods.
Overall, comparison of the cross-contrast and cloud-detection results show that this method can effectively deal with the errors caused by the inconsistency in the response characteristics of the pixels, thereby significantly reducing the error of MAI level 0 data, and at the same time improving the quality of level 1 products.
In order to quantitatively evaluate the pixel response characteristics of each channel during MAI operation on-orbit.Using the full-range multi-section analysis method, we analyze the MAI observation data from September 2016 to March 2018. The results show that there is significant inconsistency in the pixel response characteristics of each channel of the CCD, and the inconsistency in the pixel response characteristics of each channel falls between 4% and 10%. Subsequent segmentation analysis of sequential times shows that the CCD pixel response characteristics do not decay over time. This also shows that the amount of reference image data is sufficient, which further supports the rationality of the above assumptions.
After correction was performed based on the full-range multi-section correction method, the quality of the MAI image was significantly improved. In order to further verify the correction results, GOME-2 hyperspectral data and MODIS cloud detection products were separately compared with the MAI corrected data. The results showed that, after correction, both the average absolute deviation and the relative deviation of the MAI reflectance and the GOME-2 reference reflectance were significantly improved. Compared with the synchronous MODIS cloud detection product, the accuracy of the cloud detection result of the MAI was significantly improved.
In general, based on long-term on-orbit observational data, the full-range multi-section analysis and correction method can realize the monitoring and correction of the inconsistency in the response characteristics of the MAI CCD pixels, and lay a foundation for improving the quality of CCD imaging and the quantitative application of data.
Compared with the processing of the inconsistent pixel response characteristics for the internationally similar instrument, POLDER, the analysis and processing method in this paper achieves a unified correction of the effects of high and low frequencies in the full range. In addition, this method can also be applied to the on-orbit calibration and monitoring of other CCD instruments.
| [1] |
|
| [2] |
|
| [3] |
|
| [4] |
|
| [5] |
|
| [6] |
|
| [7] |
|
| [8] |
|
| [9] |
|
| [10] |
|
| [11] |
|
| [12] |
|
| [13] |
|
| [14] |
|
| [15] |
|
| [16] |
|
| [17] |
|
| [18] |
|
| [19] |
|
| [20] |
|
| [21] |
|
| [22] |
|