引用本文
Revathi Haldorai, M. Thirumalaikumar, S. Sampathkrishnan, C. Charanya, N. Balamurugan. Quantum Chemical Vibrational Study, FTIR and FT-Raman Spectra of1,3-Diphenyl Propenone[J]. Spectroscopy and Spectral Analysis, 2019,39(12): 3932-3939.
Doi:10.3964/j.issn.1000-0593(2019)12-3932-08

Copyright©2019, 《光谱学与光谱分析》期刊社
《光谱学与光谱分析》期刊社 所有
Quantum Chemical Vibrational Study, FTIR and FT-Raman Spectra of1,3-Diphenyl Propenone

Abstract
The Fourier Transform Infrared (FTIR) and Fourier transform Raman (FT-Raman) spectra of 1,3-Diphenyl Propenone were recorded in the regions 4 000~400 and 4 000~100 cm-1, respectively, in the solid phase. Molecular electronic energy, geometrical structure, harmonic vibrational spectra was computed at the DFT/ 6-31G(d,p) and three parameter hybrid functional Lee-Yang-Parr/6-31G(d,p) levels of theory. The vibrational studies were interpreted in terms of potential energy distribution (PED). The results were compared with experimental values with the help of scaling procedures. Most of the modes have wave numbers in the expected range and are in good agreement with computed values and also the molecular properties of Mulliken population analysis have been calculated. Besides, thermodynamic properties were performed.
Keyword:
FTIR; FT-Raman; Vibrational spectra; PED


Introduction
1, 3-Diphenyl Propenone is the derivative of the chalcone moieties have evoked a great deal of interest due to their biological properties and characteristic conjugated molecular architecture. Chalcones have been considered derivatives of the 1, 3-diaryl-2-propene-1-one parent compound composed of two phenolic rings, referred to as the A and B rings. Many of them possess important pharmacological properties, such as analgesic[1], arthritis[2], anti-inflammatory[3], anti-pyretic[4], anti-bacterial[5], anti-viral[6, 7], and anti-cancer[8, 9] effects. They were also potentially useful for many industrial products and phytochemical applications, including food sciences. Nowadays, a number of comparative pharmacological investigations of the chalcones have showed good antioxidant activity with low side effects[10, 11, 12, 13]. In this present study, a complete vibrational analysis of the molecule was performed by combining the experimental (FTIR and FT-Raman) data and theoretical information using Pulay’ s DFT based scaled quantum mechanical (SQM) method. Moreover, the Mulliken population analysis of the 1, 3-Diphenyl Propenone compound has been calculated and the calculated results have been reported. Finally, the thermodynamic properties of the optimized structures were obtained theoretically from the harmonic vibrations.
1 Experimental details
A pure sample of 1DPP was purchased from Sigma-Aldrich Chemical Company, St. Louis, MO, USA, and used as such for spectral measurements. The Fourier transform infrared (FTIR) spectrum of this compound was recorded in the region 4 000~400 cm-1 on a Brucker model IFS 66 V spectrophotometer using the KBr pellet technique. The spectrum was recorded at room temperature, with a spectral solution of 4.0 cm-1. The Fourier transform Raman (FT-Raman) spectrum of 1DPP was recorded using Nd-YAG laser in the region 4 000~100 cm-1 on the same spectrophotometer equipped with FRA 106 FTR module accessory.
2 Computational details
The quantum mechanical calculations were carried out using Gaussian 09W program package[14], invoking gradient geometry optimization[15]. Initial geometry generated from standard geometrical parameter was minimized without any constraint in the potential energy surface at DFT, adopting the standard 6-31G(d, p) basis set. This geometry was then reoptimized at three parameter hybrid functional (B3) Lee-Yang-Parr (LYP) level using 6-31G(d, p) basis set. Vibrational wave numbers and geometric parameters were used in the vibrational frequency calculation at the DFT levels to characterize all stationary points as minima. The vibrationally averaged nuclear positions of 1DPP were used for harmonic vibrational frequency calculations, resulting in IR and Raman frequencies together with intensities and force constants. We have utilized the gradient-corrected DFT[16] with the B3[17] for the exchange part and the LYP correlation function[18], accepted as a cost-effective approach for the computation of vibrational frequencies and energies of optimized structure. To compensate errors arising from the basis set in completeness and to neglect vibrational anharmonicity, we have scaled the frequencies with scaling factor 0.961 4 (B3LYP)[19]. Next, the spectra were analyzed in terms of the potential energy distribution (PED) contributions by using the Vibrational Energy Distribution Analysis program[20]. The contribution a group to a molecular orbital is calculated by using Mulliken population analysis. Finally, the calculated normal mode vibrational frequencies also provide thermodynamical properties through the principle of statistical mechanics.
3 Results and discussion
3.1 Molecular geometry
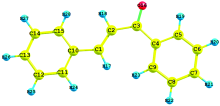
The numbering system adopted in the molecular structure of 1DPP is shown in Fig.1. The optimized geometrical parameter calculated by DFT/B3LYP with 6-31G(d, p) basis set is listed in Table 1. Table 1 compares the calculated bond length and bond angles for 1 DPP with those of experimental data[21]. From the theoretical values, it is found that some of the calculated parameters are slightly deviated from the experimental values, due to fact that the theoretical calculations belong to molecule in the gaseous phase and the experimental results belong to molecule in solid state. By allowing the relaxation of all parameters, the calculations converge to optimized geometries, which correspond to true energy minima, as revealed by the lack of imaginary frequencies in the vibrational mode calculation.
 | Fig.1 The optimized molecular structure of 1, 3-Diphenyl Propenone |
| Table 1 Optimized geometrical parameters for 1, 3-Diphenyl Propenone computed at DFT with 6-31G(d, p) basis set |
3.2 Vibrational band assignments
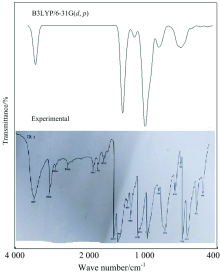
According to the theoretical calculations, 1, 3-Diphenyl Propenone has a structure of C1 point group symmetry. The molecule has 28 atoms and 78 modes of fundamental vibrations. We have taken recourse to the calculation and visualization of contribution of internal coordinates in each normal mode by Gaussian package[15] and chemcraft program. The harmonic vibrational frequencies calculated for the 1, 3-Diphenyl Propenone compound at B3LYP level using 6- 31G(d, p) along with the observed FT-IR and FTR frequencies for various modes of vibrations are presented in Table 2. Some bands found in the predicted FT-IR and FTR spectra were not observed in the experimental spectra of 1-3-Diphenyl Propenone. Therefore, a linearity between the experimental and scaled calculated wave numbers for DFT method of 1, 3-Diphenyl Propenone can be estimated by plotting the calculated versus experimental wave numbers as shown in Fig.2. The correlation coefficients (R2) for experimental and observed wave numbers computed from the DFT method were found to be 0.993 2. It can be noted from the R2 values that the theoretical prediction is in good agreement with the experimental wave numbers. Also Fig.2 reveals the overestimation of the calculated vibrational modes due to neglect of anharmonicity in real system. For the plots of simulated FTIR and FT-Raman spectra, pure Lorentzian band shapes were used with a bandwidth of 40 cm-1. Figs.3 and 4 shows a comparative representation of theoretical and experimental FT-IR and FT-Raman spectra, respectively.
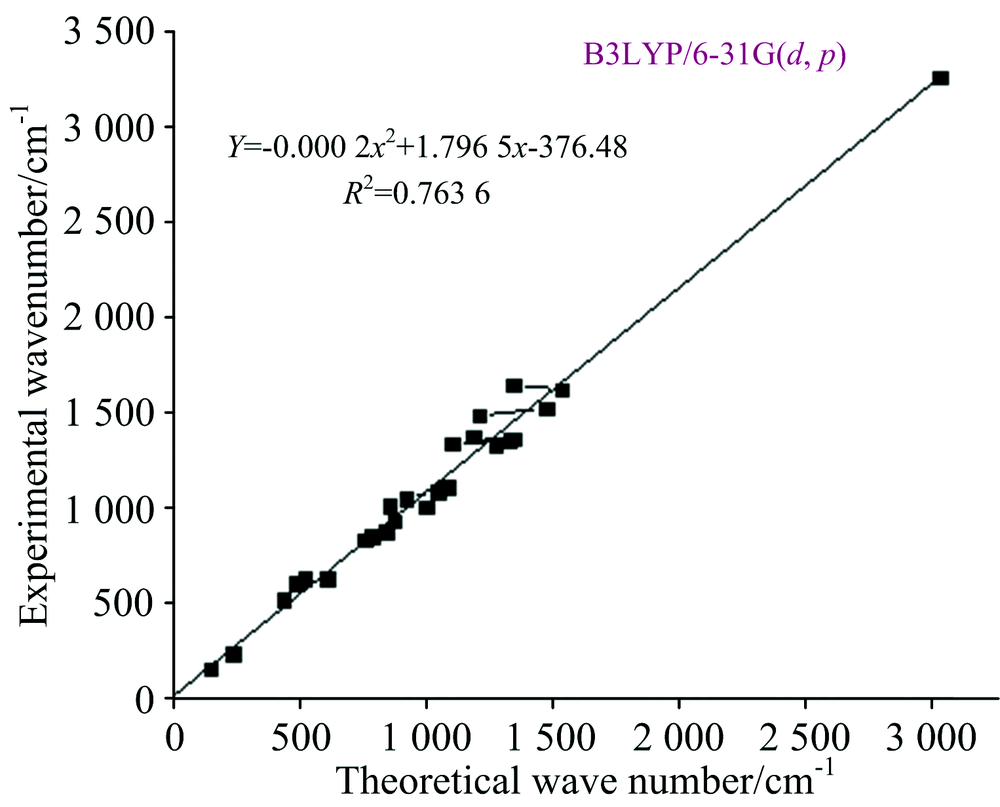 | Fig.2 Correlation diagram for the theoretical and experimental wave number of 1, 3-Diphenyl Propenone |
| Table 2 The experimental FTIR, FT-Raman and calculated frequencies using B3LYP/6-31G(d, p) probable assignments and Potential Energy Distribution (PED) of 1, 3-Diphenyl Propenone |
3.2.1 Aromatic C— H vibrations
The existence of one or more aromatic ring in a structure is normally readily determined from the C— H and C C— C related vibrations. The C— H stretching occurs above 3 000 cm-1 and is typically exhibited as a multiplicity of weak to moderate bands, compared with the aliphatic C— H stretch[22].
The aromatic compounds show the presence of C— H stretching vibrations around 3 100~3 000 cm-1 range. The modes (1~10) are due to C— H stretching of hydrogen bonded carbon atoms of phenyl rings. These modes are pure C— H stretching vibrations with a PED contribution nearly 90%.
The aromatic C— H in-plane bending vibration occurs within the region 1 300~1 000 cm-1 and out-of plane bending vibrations in the region of 700~1 000 cm-1[23]. The C— H in-plane bending vibration computed at 1 339, 1 320, 1 282, 1 242, 1 214, 1 189, 1 188, 1 116, 1 114, 1 091 and 1 057 cm-1 by B3LYP/6-31G (d, p) method shows excellent agreement with FT-IR bands at 1 328, 1 270, 1 085, 1 059 and 1 043 and in FT-Raman bands at 1 235, 1 205, 1 181 and 1 102 cm-1. The bands observed at 866 and 848 cm-1 in FT-IR. The band at 920 and 837 cm-1 in FT-Raman, at 837 and 841 cm-1 in FTIR are assigned to C— H out-of plane bending vibration for 1-3-Diphenyl Propenone. This also shows good agreement with theoretically scaled harmonic wavenumber by B3LYP method. The PED corresponding to this vibration is a mixed mode with C— C stretch with a contribution of 50%.
3.2.2 C— O vibrations
The carbonyl stretching frequency has been most extensively studied by infrared spectroscopy[24]. This multiple bonded group is highly polar and therefore gives rise to an intense infrared absorption band. In the present study the carbonyl-stretching vibrations are found in the region of 1 780~1 700 cm-1[23]. The sharp intense band in the FTIR spectrum at 1 700 cm-1 can be assigned to C— O stretching vibration, which is also observed in FT-Raman at 1 695 cm-1 as a very weak band. The results of computation give the frequencies of these modes at 1 529, 1 522 and 1 482 cm-1 by B3LYP/6-31G (d, p) method with a very strong FTIR predicted intensity and low Raman scattering activity show excellent agreement with our experimental date.
3.2.3 C— C vibrations
The benzene ring possesses six ring stretching vibrations of which the four with the highest wave numbers occurring near 1 600, 1 580, 1 490 and 1 440 cm-1 are good group vibrations[25]. With heavy substituents, the bands tend to shift to somewhat lower wave number and the greater the number of substituents on the ring, the broader the absorption regions[25]. The fifth ring stretching vibration which is active near (1 315± 65) cm-1, a region that overlaps strongly with that of the CH in-plane deformation[26]. In our present work, the frequencies observed in the FT-IR spectrum at 1 610 and 1 471 cm-1 in FT-IR gas phase are assigned to C— C stretching vibration. The theoretically computed C— C stretching vibration by BLYP/6-31G(d, p) method at 1 645~1 371 cm-1 (mode no.15— 23) shows good agreement with recorded spectrum as well as literature data. The same vibration in 6-31G(d, p) shows little bit on the lower side of frequency range at 1 482~1 371 cm-1 (mode no.15— 23). The sixth ring stretching vibration, the ring breathing mode appears as a weak band near 1 000 cm-1 in mono-1, 3-di and 1, 3, 5-tri-substituted benzenes. In the otherwise substituted benzenes, however, this vibration is substituent sensitive and difficult to distinguish from other modes. The ring breathing mode for the para substituted benzenes with entirely different substituents[27] have been reported to strongly FTIR active with typical bands in the interval 780~850 cm-1. For the 1-3-Diphenyl Propenone. compound, this is confirmed by the medium strong band in the FT-IR spectrum at 1 043 cm-1 which finds support from the computational results at 1 043 and 1 010 cm-1 by BLYP method. The ring breathing mode of para substituted benzenes are reported at 804, 792 cm-1 experimentally and at 782, 795 cm-1 theoretically[28, 29]. In asymmetric tri-substituted benzenes, when all the three substituents are light, the frequency interval of the breathing mode[30] is between 500 and 600 cm-1. When all the three substituents are heavy, the frequency appears above 1 100 cm-1. In the mixed substituents the frequency is expectable[30] to appear between 600 and 750 cm-1. The FT-IR bands at 607, 520, 485 and 436 cm-1 are assigned to C— C— C deformation of phenyl ring. The theoretically computed C— C— C deformation vibrations at 607, 518 and 495 cm-1 (mode nos. 62 and 64) by BLYP/6-31G(d, p) method shows good agreement with strong FT-IR gas phase.
3.2.4 Ring vibrations
Many ring modes are affected by the substitutions in the ring of 1-3-Diphenyl Propenone. In the present study the bands predicted at 607, 518, 495, 436, 408, 401, 400, 173, 156, 90, 73, 36, 19 and 15 cm-1 have been designated to ring in plane and out of plane bending modes, respectively, by careful consideration for their quantitative descriptions. The experimental observations at 411, 240 and 156 cm-1 of FT-Raman also coincide with theoretically predicted values with 42%, 50%, 51%, 52%, 55%, 61%, 62%, 63% and 64% of PED contributions respectively.
4 Other molecular properties
4.1 Mulliken atomic charges
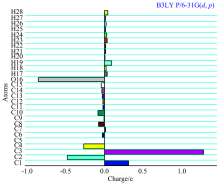
Mulliken atomic charge calculation has an important role for the application of quantum chemical calculation of the molecular system. Atomic charge affects dipole moment, polarizability, electronic structure and other molecular properties as the system. The calculated Mulliken charge values of 1, 3-Diphenyl Propenone are listed in Table 3. It is clearly shown that the carbon atom attached with hydrogen atom is negative, whereas the remaining carbon atoms are positively charged in the 1, 3-Diphenyl Propenone compound. The oxygen atoms have more negative charge whereas all the hydrogen atoms have the positive charges. The more positive charge of carbon is found for the compound for C1, C3 and C7; it is mainly due to the substitution of negative charge of an oxygen atoms. The lone pare of oxygen atom (O16) shows the charge transferred from O to H. Illustration of atomic charge plotted for B3LYP/6-31G (d, p) level have been shown in Fig.5.
| Table 3 Mulliken population analysis of 1, 3-Diphenyl Propenone performed at B3LYP method with 6-31G (d, p) basis set |
 | Fig.3 Comparative representation of FTIR spectra for 1, 3-Diphenyl Propenone |
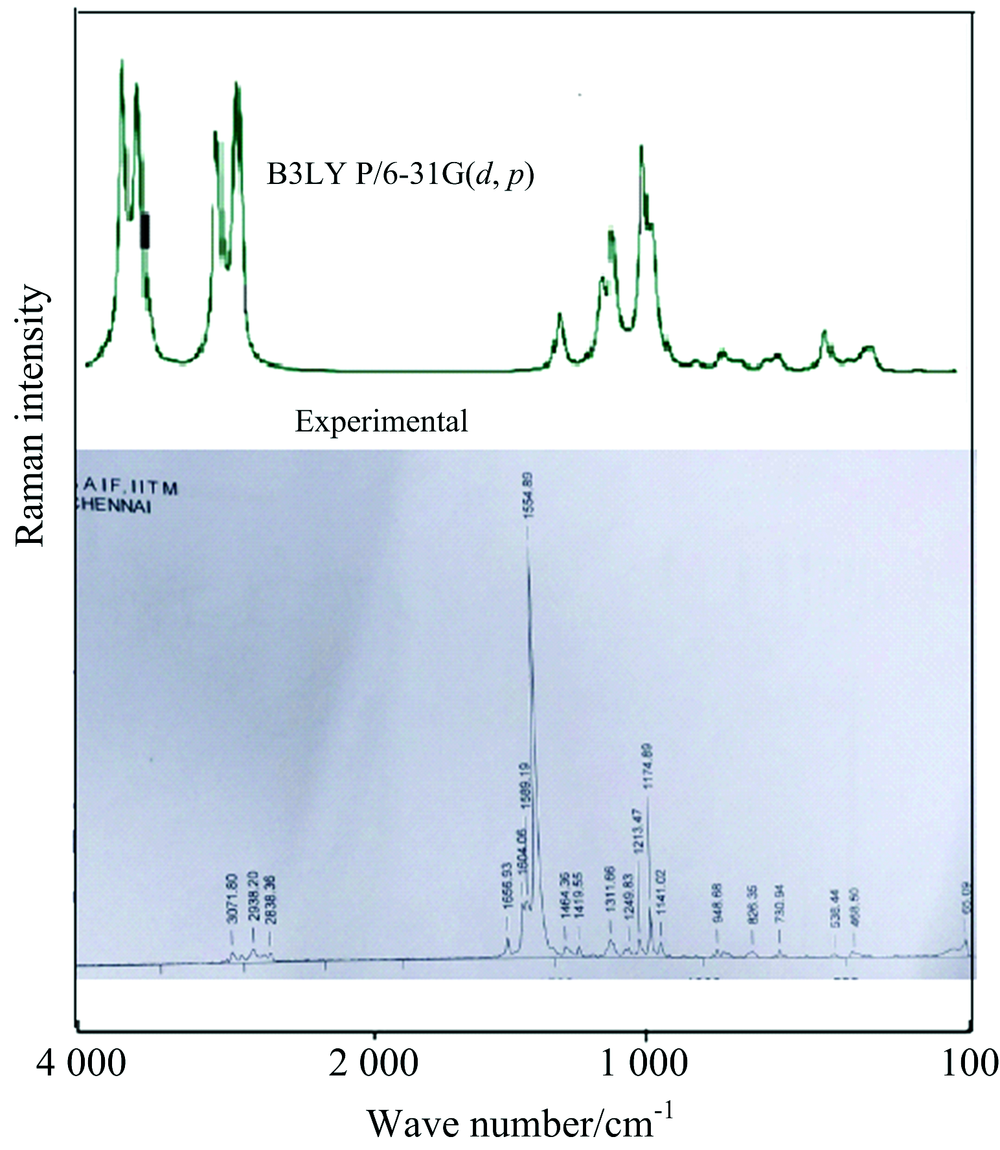 | Fig.4 Comparative representation of FT-Raman spectra for 1, 3-Diphenyl Propenone |
 | Fig.5 The Historam of Calculated Mulliken charge for 1, 3-Diphenyl Propenone molecule |
5 Thermodynamical properties
Entropy of the 1, 3-Diphenyl Propenone compound is presented in (Table 4) the scale factors have been recommended[31] for an accurate predication in determining the Zero-Point Vibration Energies (ZPVE), and the entropy Svit(T). The variation in the ZPVE’ s seemed to be insignificant. The total energies and the changes in the total energy of 1, 3-Diphenyl Propenone at room temperature at different methods are also presented. Dipole moment is a measure of the symmetry in the molecular charge distribution and is given as a vector in the three dimensions. The values of dipole moments and energies for 1, 3-Diphenyl Propenone molecule were also calculated (Table 4).
| Table 4 The calculated thermodynamical parameters of 1, 3-Diphenyl Propenone at 298.15 K for all parameters in ground state at the B3LYP/6-31G (d, p) method |
6 Conclusion
The FT-IR and FT-Raman measurements have been made for the 1, 3-Diphenyl Propenone molecule. The complete vibrational assignment with PED was calculated using SQMF method. The equilibrium geometries and harmonic frequencies of 1, 3-Diphenyl Propenone were determined and analyzed at DFT level of theories utilizing 6-31G (d, p) basis set. The difference between observed and calculated wavenumber values of the most of the fundamental modes is very small. Any discrepancy noted between the observed and the calculated frequencies may be due to the fact that the calculations have been actually done on single molecules in the gaseous state contrary to the experimental values recorded in the presence of intermolecular interactions. Therefore, the assignment made at higher levels of theory with only reasonable deviations from the experimental values seems to be correct. Mulliken charge analysis of the 1, 3-Diphenyl Propenone compound has been studied by B3LYP method. The calculated normal-mode vibrational frequencies provide thermodynamic properties by way of statistical mechanics.
参考文献
| [1] |
|
| [2] |
|
| [3] |
|
| [4] |
|
| [5] |
|
| [6] |
|
| [7] |
|
| [8] |
|
| [9] |
|
| [10] |
|
| [11] |
|
| [12] |
|
| [13] |
|
| [14] |
|
| [15] |
|
| [16] |
|
| [17] |
|
| [18] |
|
| [19] |
|
| [20] |
|
| [21] |
|
| [22] |
|
| [23] |
|
| [24] |
|
| [25] |
|
| [26] |
|
| [27] |
|
| [28] |
|
| [29] |
|
| [30] |
|
| [31] |
|