
基于激光诱导荧光的溢油厚度定量检测实验研究
[陈宇男1, 2, 3  , 杨瑞芳
, 杨瑞芳1, 3 , 赵南京1, 3, * , 祝玮1, 2, 3 , 黄尧1, 2, 3 , 张瑞琦1, 2, 3 , 陈晓伟1, 2, 3 ]
, 杨瑞芳, 祝玮|
|


CHEN Yu-nan, (1992—), female, Ph. D student at the University of Science and Technology of China email:ynchen@aiofm.ac.cn
海上溢油油膜厚度的定量检测是实现溢油量准确估计的重要依据和手段, 为制定石油污染应急响应提供了基础数据。 本文基于激光诱导荧光(LIF)的方法以柴油(0# diesel)、 机油(Mobil motor oil 20w-40)、 润滑油(Shell Helix 15w-40, Shell Helix 10w-40, Shell Helix 5w-40)为研究对象, 重点分析了油膜厚度-荧光发射强度关系, 检出限以及油膜厚度在不同水体中定量检测的准确性。 结果表明: 0#柴油和美孚机油20w-60的荧光光谱特征与润滑油的光谱特征有明显不同, 柴油的荧光峰位于326 nm其FWHM为60 nm, 美孚机油20w-60则具有三个荧光峰分别位于360 nm/375 nm/390 nm其FWHM为100nm。 三种润滑油(壳牌润滑油15w-40、 壳牌润滑油10w-40、 壳牌润滑油5w-40)的荧光光谱重叠明显, 荧光峰分别位于334, 344和343 nm且FWHM分别为75, 45和50 nm。 5种油膜的荧光强度均随油膜厚度的增加而增加, 校正曲线的相关性分别为0.997 8, 0.997 9, 0.996 4, 0.997 8和0.996 0, 均具有较好的相关性, 5种油膜检出限分别为0.03, 0.02, 0.02, 0.03和0.05 μm, 0#柴油在合成海水A和B中的平均相对误差为5.04%和8.73%, 平均相对标准偏差分别为4.37%和8.36%, 美孚机油20w-40在合成海水A和B中的平均相对误差为7.99%和9.97%, 平均相对标准偏差为4.78%和6.23%。 壳牌润滑油15w-40在合成海水A和B中的平均相对误差为8.54%和13.69%, 相对标准偏差为5.05%和9.08%。 壳牌润滑油10w-40在合成海水A和B中的平均相对误差为6.33%和12.38%, 平均相对标准偏差为2.85%和7.92%。 壳牌润滑油5w-40在合成海水A和B中的平均相对误差为4.28%和11.57%, 平均相对标准偏差为3.56%和7.73%。 可见5种油膜在不同水体中定量检测的平均相对误差均小于14%, 平均相对标准偏差均小于10%, 研究结果可以实现对薄油膜的测量, 为海上油膜厚度的在线监测提供了技术手段。
, YANG Rui-fang, ZHU WeiQuantitative detection of oil slick thickness in the ocean is an essential basis to achieve an accurate estimate of oil spills and provides primary data for the development of oil pollution emergency response. In this paper, we use diesel(0# diesel), motor oil (Mobil motor oil 20w-40), Lubricants (Shell Helix 15w-40, Shell Helix 10w-40, Shell Helix 5w-40) as the research objects, using laser-induced fluorescence (LIF) obtains the spectra of materials. The oil film thickness-fluorescence intensity calibration curves are established, and the detection limits of five kinds of oils are calculated. The accuracy of the quantitative detection of different oil film thicknesses in different water is analyzed. The results show that the fluorescence spectra of 0# diesel and Mobil motor oil 20w-40 are significantly different from those lubricants. The fluorescence peak of diesel is at 326 nm, and its FWHM is 60 nm. Mobil motor oil 20w-40 has three fluorescence peaks at 360 nm/375 nm/390 nm, and the FWHM is about 100 nm. The fluorescence spectra of the three lubricants (such as Shell Helix 15w-40, Shell Helix 10w-40, Shell Helix 5w-40) overlap significantly, and the fluorescence peaks are located at 334, 344, and 343 nm, respectively. With the increase of oil slick thickness, the fluorescence intensity of the five kinds of oil films is rising. The calibration curves of oil slicks have good correlation, and the correlation coefficients( r) are 0.997 8, 0.997 9, 0.996 4, 0.997 8, and 0.996 0, respectively. The detection limits are 0.03, 0.02, 0.02, 0.03 and 0.05 μm. It can be seen that the average relative errors of quantitative detection of five kinds of oil films in different water are less than 14%, and the average relative standard deviations are not greater than 10%. The results can be used to measure thin oil films and provide a technical means for on-line monitoring of oil film thickness at sea.
In recent years, oil spills in the ocean have occurred frequently, causing significant damages to the environment of the ocean and generating severe economic losses. How to achieve rapid monitoring of oil spills on the surface of the ocean is the focus of current researches.
Oil slick thickness measurements are in the early stage of development. The current methods for measuring oil slick include hyperspectral, infrared, ultraviolet, laser trigonometry, ultrasonic, galvanic battery principle and laser-induced fluorescence[1]. Hyperspectral has a strong dependence on sunlight, so it cannot be used for the night. The sun glitter is easily mistaken for oil spills, affecting the accuracy of the analysis[2, 3]. The infrared is not expensive for monitoring the oil spills, so it is widely used. However, it is easily interfered by the wrong targets[4]. When the oil slick reaches a certain thickness, the infrared emission of the oil is constant, so the brightness of the infrared image would not vary with the thickness of the oil slicks[5, 6]. The oil has a higher reflectance than seawater in the ultraviolet range, and the feature is used to detect oil spills. The sensor draws the oil map, but the data are susceptible to environmental interferences to produce false images such as sun glitter, phytoplankton[7, 8]. Laser trigonometry belongs to the imaging ranging method. Although the measurement accuracy is good, it is not suitable for the measurement of opaque oil slicks[9, 10]. Laser ultrasonic method uses the time of propagation of the acoustic wave between the upper and lower surfaces to determine the oil slick thickness. Some researchers can use ultrasonic to measure the thickness of oil slick, and the measurement range is 250 μ m~350 mm. It cannot detect oil spills at night and through clouds or fog, however, it is expensive and bulky[11].
Compared with the above methods, laser-induced fluorescence(LIF) has great potential not only to achieve oil slick thickness measurement but also to identify different types of oils[13, 14]. Using a method based on LIF technology to develop oil slick thickness in the ocean and develop automatic monitoring systems for oil spills. In the initial phase of oil spills, it is necessary to accurately and rapidly achieve qualitative and quantitative analysis of oil slicks. Therefore, it will provide response personnel with the required data such as the source of oil spills and the amount of oil spilled to develop emergency plans as early as possible to reduce economic losses and reduce environmental pollution.
In this paper, 0# diesel, Mobil motor oil 20w-40, Shell Helix 15w-40, Shell Helix 10w-40, Shell Helix 5w-40 are the research objects. Based on laser-induced fluorescence technology, the quantitative detection ability of oil slick thickness was studied. We analyzed the oil thickness-fluorescence intensity relationship and detection limits and evaluated the accuracies of quantitative detection in different water.
Since petroleum and its derivatives are hardly soluble in water, the thickness of the added oil slick is calculated according to V=Sd, where V is the volume of the oil, S represents the area where the oil slick is formed, and d represents the thickness of the oil slick[15].
34 g of NaCl are weighed and dissolved in 1 L of deionized water and Dongpu reservoir water, which are called synthetic water A and synthetic water B.
250 mL of synthetic water is added to the petri dish (d=150 mm). By adding different volumes of oil to the surface of the water, oil slicks of different thicknesses are formed on the surface of synthetic water A and synthetic water B with a salt content of 34 g· L-1.
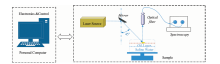
The Laser-induced Fluorescence (LIF) system consists of a laser emission system, an optical receiving system and a computer control system. The Nd:YAG laser emits a pulsed laser. After being reflected by a total reflection mirror (266 nm), the laser acts on the surface of the oil slick in a 45° direction. The motor controls the rotation of the sample stage to ensure that the laser can uniformly act on the surface of the oil slick to improve the stability of the spectrum. The sample is excited to generate fluorescence, which is concentrated by the lens and transmitted to the spectrometer through the optical fiber.
The system uses a quadruple-frequency Nd:YAG laser with a wavelength of 266 nm, an operating frequency of 1~10 Hz, single-pulse laser energy of 100 mJ, a pulse width of 6 ns, a laser beam diameter of 9 mm, the fiber aperture of 500 μ m. The spectrometer is Maya-2000pro with a spectral detection range of 200 to 1 100 nm and a resolution of 1.1 nm.
The fluorescence spectra of five oil slicks (0# diesel, Mobil motor oil 20w-40, Shell Helix 15w-40, Shell Helix 10w-40, Shell Helix 5w-40) are shown in Fig.2(a). The five kinds of oil slicks have characteristic fluorescence spectra in the range of 290~450 nm, while the water Raman has no visible spectral characteristics. Therefore, the spectrum in the range of 290~450 nm is selected for the spectral characteristics analysis of different oil slicks.
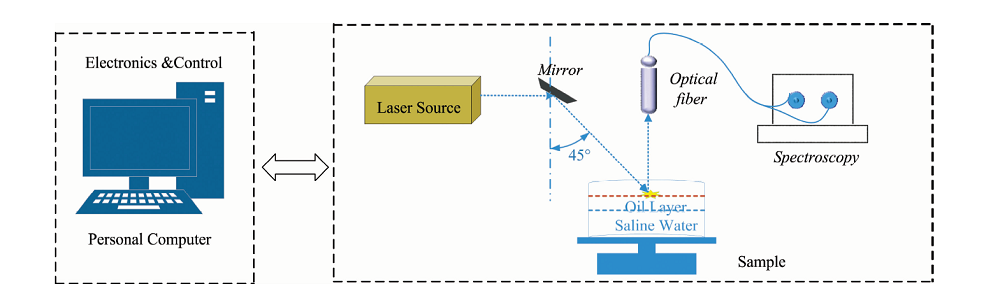 | Fig.1 Schematic diagram of the LIF experimental device |
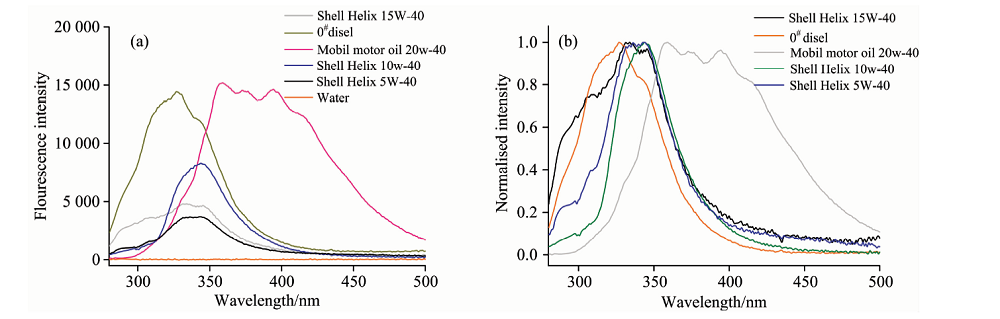 | Fig.2 The original fluorescence spectra (a) and normalized fluorescence spectra (b) of 0# diesel, Mobil motor oil 20w-40, Shell Helix 15w-40, Shell Helix 10w-40, Shell Helix 5w-40 |
To facilitate the spectral comparison of the five samples, the oil spectra are normalized, and then the spectral characteristics are analyzed. The position of the fluorescent peak and the full width at half maximum (FWHM) in the fluorescence spectrum are essential indicators for distinguishing the samples.
As shown in Fig.2(b), the fluorescence spectrum characteristics of Mobil motor oil 20w-40 and 0# diesel are significantly different from those of the other three samples. Mobil motor oil 20w-40 has three fluorescence peaks at 360 nm/375 nm/390 nm and the FWHM is about 100 nm. The fluorescence peak of 0# diesel is at 326 nm, and the FWHM is approximately 60 nm. The fluorescence spectra of the three lubricants have a large range of overlap. The fluorescence peaks of Shell Helix 15w-40, Shell Helix 10w-40, Shell Helix 5w-40 are located at 334 nm/344 nm/343nm, respectively. Their FWHM are 75, 45, and 50 nm, respectively.
In this paper, the laser-induced fluorescence technique (LIF) is used to measure the detection ranges and the detection limits of the five kinds oils such as 0# diesel, Mobil motor oil 20w-40, Shell Helix 15w-40, Shell Helix 10w-40, Shell Helix 5w-40. When the oil slick thickness is close to infinite thickness, the fluorescence intensity is recorded as:
When, (Id/I∞ )≪1 the above equation can be approximated as
Where k and k' are the absorption coefficients of the excitation wavelength and the measured fluorescence wavelength, respectively.
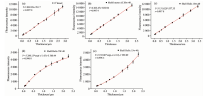
Fig.3 shows the calibration curves of oil slick thickness-fluorescence intensity. Table 1 shows the fitting equations, regression coefficients and detection limits of five kinds of oil slicks.
 | Fig.3 Oil slick thickness-fluorescence intensity curves |
| Table 1 Fitting regression equations and regression coefficients of oil slicks with different thicknesses |
It can be seen from Table 1 that the fluorescence intensity values of the fluorescence peaks at 326 nm/395 nm are selected to be the calibration curves of the oil slick thickness-fluorescence intensity of 0# disel and Mobil motor oil 20w-40. When the oil slick thicknesses are 0.06~2.67 μ m, bothtwo kinds of oils have good linear relationships, the correlation coefficients can reach 0.997 8 and 0.997 9, respectively, and the detection limits can reach 0.03 and 0.02 μ m, respectively. The fluorescence intensity values at 343, 344, and 334 nm were selected to be the calibration curves of the oil slick thickness-fluorescence intensities of Shell Helix 10w-40, Shell Helix 5w-40 and Shell Helix 15w-40. When the thicknesses are 0.06~3.40 μ m, Shell Helix 10w-40 has a good linear relationship, the correlauion coefficient can reach 0.997 8, and the detection limit can reach 0.02 μ m. When the oil slick thicknesses are 0.06~2.67 μ m, the fluorescence intensities of Shell Helix 5w-40 and Shell Helix 15w-40 increase, the correlation coefficients are 0.996 0 and 0.996 4, respectively, and the detection limits are 0.03 and 0.05 μ m.
In order to further analyze the quantitative detection ability of laser-induced fluorescence technology for oil slick thickness, five kinds of oil slicks with different thicknesses are generated on the surface of synthetic water A(deionized water with a salt content of 34 g· L-1) and synthetic water B(dongpu reservoir water with a salt content of 34 g· L-1). The accuracies of quantitative detection of five kinds of oils in different water are evaluated based on two indicators of relative error
We can see from Table 2 that the relative error of quantitative detection of 0# diesel in synthetic water A is 4.03%~8.17%, the average relative error is 5.63%, the relative standard deviation is 2.09%~5.92%, and the average relative standard deviation is 4.37%. The relative error of quantitative analysis of 0# diesel in synthetic water B is 5.45%~15.03%, the average relative error is 8.73%, the relative standard deviation is 4.87%~11.54%, and the average standard deviation is 8.36%.
| Table 2 Quantitative detection of 0# disel in different water |
It can be seen from Table 3 that the relative error of quantitative detection of Mobil motor oil 20w-40 in synthetic water A is 4.52%~11.07%, the average relative error is 8.02%, and the relative standard deviation is 1.38%~8.21%. The standard deviation is 4.71%. The relative error of quantitative of Mobil motor oil 20w-40 in synthetic water B is 6.72%~14.49%, the average relative error is 11.08%, the relative standard deviation is 4.25%~12.21%, and the average relative standard deviation is 6.86%.
| Table 3 Quantitative detection of Mobil motor oil 20w-40 in different water |
It can be seen from Table 4 that the relative error of quantitative detection of Shell Helix 10w-40 in synthetic seawater A is 3.44%~9.08%, the average relative error is 6.33%, and the relative standard deviation is 0.52%~10.28%, the average standard. The deviation is 5.06%. The relative error quantitative detection in synthetic water B is 8.54%~12.96%, the average relative error is 10.56%, the relative standard deviation is 3.34%~16.61%, and the average relative standard deviation is 7.73%.
| Table 4 Quantitative detection of Shell Helix 10w-40 in different water |
It can be seen from table 5 that the relative error of quantitative detection of Shell Helix 5w-40 in synthetic water A is 2.65%~6.34%, the average relative error is 4.28%, and the relative standard deviation is 2.23%~6.16%. The standard deviation is 3.56%. The relative error of quantitative detection in synthetic water B is 7.35%~14.57%, the average relative error is 11.57%, the relative standard deviation is 3.09%~10.32%, and the average standard deviation is 7.73%.
| Table 5 Quantitative detection of Shell Helix 5w-40 in different water |
It can be seen from table 6 that the relative error of quantitative analysis of 15w-40 of Shell Helix 15w-40 in Synthetic Seawater A is 1.87%~19.63%, the average relative error is 8.54%, the relative standard deviation is 2.13%~9.41%, and the average relative standard deviation is 5.05%. The relative error measured in synthetic seawater B is 4.65%~24.52%, the average relative error is 13.69%, the relative standard deviation is 5.25%~14.55%, and the average relative standard deviation is 9.08%.
| Table 6 Quantitative detection of Shell Helix 15w-40 in different water |
It is evident that five kinds of oils can be quantitatively detected in synthetic water A and synthetic water B, but the detection effect in synthetic water B is not as good as in synthetic water A. Probably because the synthetic water B contains some suspended particulate matter. Although these materials do not fluoresce, they will absorb on the surface of oil slick and interfere with the collection of fluorescent signals. Further research on the signal collection system is needed. The composition of water is relatively complex, such as DOM and metal ions, which will affect the oil slick thickness measurement.
Through the calibration curves of the oil slick thickness-fluorescence intensity of the five kinds of oils and the quantitative detection results of different oil slicks in synthetic seawater A and synthetic seawater B, it is found that the correlation coefficients of the five oils are all above 0.99, and the relative errors are less than 20%, relative standard deviations are less than 15%, which proves that laser-induced fluorescence technology can effectively realize the quantitative analysis of thin oil slicks, which can be used as an effective means for on-line monitoring of oil slicks.
| [1] |
|
| [2] |
|
| [3] |
|
| [4] |
|
| [5] |
|
| [6] |
|
| [7] |
|
| [8] |
|
| [9] |
|
| [10] |
|
| [11] |
|
| [12] |
|
| [13] |
|
| [14] |
|
| [15] |
|