


FTIR光谱在润滑油污染物定量监测中的应用研究
[李婧1  , 田洪祥
, 田洪祥1, * , 孙云岭1 , 明廷锋1 , 盛晨兴2, 3 ]
, 田洪祥, 孙云岭|
|


作者简介: 李 婧, 女, 1983年生, 海军工程大学动力工程学院博士研究生 e-mail: leej0820@163.com
柴油机润滑油在使用过程中, 会受到水份、 柴油或冷却液等的污染, 受高温或燃烧室气体的作用还会产生氧化、 硝化、 磺化等产物, 严重时, 这些污染和产物可导致装备的失效。 在用润滑油分析能可靠地反映其工作状态, 从而确定最佳换油时机和故障源, 以避免柴油机在使用过程中产生异常磨损及腐蚀等问题。 目前的传统方法, 是用卡尔菲休法测定石油产品中水份, 气相色谱法测定柴油机油中的柴油稀释剂, 因分析时间长和费用高等因素影响其普及应用。 傅里叶红外(FTIR)光谱法从分子水平分析润滑油, 从而能更有效地监测在用油, 由于光谱的复杂性, 目前尚不普及。 通过在实验室条件下配置多种污染程度的油液样, 分别为润滑油含水份百分比浓度为0.11%, 0.22%, 0.44%和0.88%的油样; 润滑油在230 ℃下的氧化时间为299, 323, 371和395 h的油样; 润滑油被柴油稀释的质量百分比浓度为1.5%, 3%, 6%和12%的油样; 润滑油含乙二醇质量百分比浓度为0.1%, 0.2%, 0.4%和0.8%的油样, 包括配置的润滑油油样共计20个。 实验采用安捷伦Agilent Cary 630红外光谱仪, 使用100 μm厚的液体池, 防潮ZeSe型配置的光谱范围为4 000~650 cm-1。 分析了所有油样, 获得了FTIR光谱图, 确定了水、 氧化产物、 柴油、 乙二醇污染所对应的特征波段范围分别为3 150~3 500, 1 670~1 800, 745~755和1 030~1 100 cm-1; 监测参数包括特征波段的实测中心点、 左边界、 右边界、 左基线、 右基线等。 建立了一种在用润滑油污染物定量分析模型, 通过水份、 柴油、 乙二醇的污染比例和峰面积, 在230 ℃下的氧化时间与峰面积分别建立拟合方程, 水、 柴油、 乙二醇含量百分比与对应峰面积的相关系数分别为0.977 9, 1.000 0和0.989 5, 氧化时间与对应峰面积的相关系数为0.999 6。 分析计算预测值与实际值的相对误差可知: 水份和乙二醇在含量大于0.2%时, 预测的最大相对误差为10%; 氧化时间和柴油预测值的最大相对误差为1%。 通过按比例稀释, 可对在用油进行监测, 对3个日常工作的实际油样进行FTIR光谱分析。 结果表明: 一个油样的水份含量为0.38%, 已经超过标准; 一个油样的燃油稀释为19%, 已经超标; 另外一个油样正常。 水份超过标准门阈值的油样经卡尔菲休法测量, 其相对误差为4.6%。 燃油稀释超过标准的油样经黏度测量, 其相对值变化同样超过了标准要求, 即在判断润滑油是否需要换油方面是一致的。 利用FTIR光谱法分析在用润滑油, 选定适当的吸收峰, 并计算吸收峰的面积, 借助于已经建立的拟合公式, 可快速可靠地监测在用油的污染种类及程度, 该方法可在一定程度上满足工程需要。
Marine diesel engine oil in service will be contaminated by water, fuels, coolants, and other degradation products such as oxidation, nitrification and sulfonation, which can also be produced under the influence of high temperature or combustion chamber gas. In serious cases, these contaminants and products can lead to the failure of equipment. Analyzing the used oils can reveal its condition, therefore determine the optimum oil changed period and fault source, and avoid the abnormal wear and corrosion of diesel engine during operation. At present, the traditional methods are as follows that the coulometric Karl Fischer titration be used to measure the water content in oils and gas chromatography to determine the fuel dilution. Due to long time and high cost for oil analysis, these two methods mentioned above are not widely used in monitoring oils. For analyzing the lubricating oil at the molecular level, Fourier infrared (FT-IR) spectroscopy can be used to monitor oil more effectively. Unfortunately, it is not yet widely used at present because of the complexity of the spectrum. The oil samples sum up to 20, which are contaminated by water, fuel, ethylene glycol coolant, high temperature oxidation as well as new oil. Water concentrations in oil are 0.11%, 0.22%, 0.44% and 0.88%. The durations of high temperature for oil oxidation are 299, 323, 371 and 395 h. The fuel dilutions of oil are 1.5%, 3%, 6% and 12%. Ethylene glycol coolant concentrations in oil are 0.1%, 0.2%, 0.4% and 0.8%. The oil samples were analyzed by the Agilent Cary 630 FT-IR with a factory set pathlength of 100 microns and with the spectral range of 4 000~650 cm-1. FT-IR spectra of all oil samples were obtained with FT-IR spectrometer. It is determined that the corresponding characteristic band ranges of water, oxidizing products, fuel dilutions and ethylene glycol coolant respectively are 3 150~3 500, 1 670~1 800, 745~755, 1 030~1 100 cm-1. Monitoring parameters of FT-IR spectra include center point, left boundary, right boundary, left baseline and right baseline. A quantitative analysis model for contaminants in used oil was established. The fitting equations are about the concentrations of contaminants and the peak area of FT-IR spectra. Correlation coefficients between the contaminants of water, fuel dilutions and ethylene glycol coolant and the corresponding peak area of FT-IR spectra are 0.977 9, 1.000 0 and 0.989 5, respectively. The correlation coefficient between oxidation time and the corresponding peak area of FT-IR spectra is 0.999 6. The maximum relative errors between the predicted from the fitting equations and the actual value are 10% for the content of water and glycol more than 0.2%, and are 1% for oxidation time and fuel dilution. By new oil proportional dilution, 3 routine used oil samples were monitored with FT-IR spectrum analysis. The results showed that the water content of one oil sample was 0.38%, which exceeded the standard; the another oil sample was diluted to 19%, which exceeded the standard, and the other oil sample was normal. In the case of oil samples, which exceeded the threshold of the water, the relative error of the FT-IR measurement is 4.6% when compared with the Karl Fischer method. The fuel dilution of the oil sample, which exceeded the requirement of the standard, was verified by the change of viscosity. The FT-IR spectrum analysis and the change of viscosity are consistent in judging whether the used oil is or not to be changed. FT-IR spectroscopy was used to analyze the lubricating oil in use, the peak absorbances was selected, and the area of peak absorbances was calculated. By means of the established fitting formula, the contaminants types and degrees of oil can be monitored quickly and reliably. FT-IR spectroscopy method can meet the engineering requirements of used oil monitoring to a certain extent.
润滑油分析的主要任务是及早发现和处理油的降解、 污染和磨损问题, 否则将导致二次故障损失、 非计划停机和影响安全运行[1]等。 润滑油的污染既有来自系统外部的, 也有来自系统内部的。 常见的污染类型是: 在初始启动时或大修后的磨屑、 润滑油降解产生的副产物、 磨粒、 空气中的微粒和水(湿气)等。 污染通常是影响润滑油使用寿命的重要因素之一[2]。 污染物有水、 积碳、 乙二醇、 柴油和加错了型号的油等。 同时, 油料的氧化、 硝化和磺化导致在用油的劣化降解。 目前, 每种污染物都有对应的标准测试方法, 如水份测量可用卡尔菲休滴定法[3], 色相谱法用于测量润滑油中混入柴油的百分比含量[4], 试剂法确定乙二醇含量[5]等。 这些方法需在实验室条件下完成, 具有操作时间长, 测试成本高等特点。 通过FTIR光谱的变化反映润滑油因为污染、 衰变、 老化等引起的多种功能团的产生和变化, 可以评估润滑油的状况, 并视情决定是否更换润滑油[6]。 以上这些污染, 理论上可通过FTIR光谱分析法测定出其对应的敏感波段, 并通过峰高法或峰面积法测定其具体的百分比含量[7]。 然而, 不同种类的润滑油, 其对应的敏感波段也有差异[8]。 李龙飞[9]等在实验室条件下, 对某发动机润滑油进行了氧化模拟实验, 并通过粘度和FTIR光谱法分析了样本, 建立了粘度变化与氧化时间的关系。 石新发[10]等对32个油样FTIR光谱信息采用主成分分析法进行了提取, 实现了对油样的状态评价。
参考油液氧化污染的FTIR光谱监测标准[11]及其他相关文献, 研究了四种污染物对应的特征波段, 并求其峰面积, 建立了污染程度相关参数与峰面积的拟合方程, 并对日常在用油进行了监测和分析。
采用安捷伦Agilent Cary 630红外光谱仪, 100 μ m厚的液体池, 防潮ZeSe型配置, 光谱范围为4 000~650 cm-1。
基于Hele-Shaw原理的粘度计和梅特勒-托利多卡尔费休水份测量仪。
柴油机油的牌号是长城CD40-15W。
实验样本分为两大组: Ⅰ 组: 润滑油配置混入水份质量百分比浓度为0.11%, 0.22%, 0.44%和0.88%的油样, 编号分别为A2, A3, A4和A5; 氧化油样由润滑油在230 ℃温度下, 使用油浴锅恒温加热299, 323, 371和395 h后分别得到油样A7, A8, A9和A10; 配置润滑油混入柴油质量百分比浓度为1.5%, 3%, 6%和12%的油样, 编号分别为A12, A13, A14和A15; 配置润滑油混入乙二醇, 质量百分比浓度分别为0.1%, 0.2%, 0.4%和0.8%的油样, 其样本号为A17, A18, A19和A20; A1, A6, A11和A16为空白油样。 Ⅱ 组: 来自某船用主柴油机的日常工作油样3个, 样本号为B1— B3, 具体的污染含量需检测。
对Ⅰ 组样本分别做FTIR光谱实验, 并按不同污染物即如上所述混有一定比例的水、 柴油和乙二醇的润滑油和多种氧化时长下的润滑油所测得的FTIR光谱叠加。
图1是水、 氧化、 柴油、 乙二醇污染的FTIR光谱叠加图, 图1(a)为水浓度分别为0.11%, 0.22%, 0.44%和0.88%的润滑油和空白润滑油的FTIR光谱图, 谱峰的最高点在3 413 cm-1处, 是由氢键拉伸产生的羟基引起。 图1(b)为氧化时间分别为299, 323, 371和395 h和空白润滑油的FTIR光谱图, 谱峰最高点在1 710 cm-1处, 是由于降解产物引起。 图1(c)为柴油浓度分别为1.5%, 3%, 6%和12%的油样和空白润滑油的FTIR光谱图, 谱峰最高点在813 cm-1处, 是由于燃油中芳香基团引起。 图1(d)为乙二醇浓度分别为0.1%, 0.2%, 0.4%和0.8%的润滑油和空白润滑油的FTIR光谱图, 编号为A16— A20, 谱峰最高点在1 075 cm-1处。 需要说明的是由于乙二醇也存在羟基, 在水的特征波数段同样能看到吸收峰值。
 | 图1 水(a)、 氧化(b)、 柴油(c)、 乙二醇(d)污染的FTIR光谱图Fig.1 FTIR spectra of water (a), oxidation (b), fuel dilution (c) and ethylene glycol coolant (d) contaminants |
参考ASTM E2412的污染物特征波段, 结合实际油样的FTIR光谱叠加图所对应的污染物特征波段, 如表1所示。 实测中心点为叠加波形峰值最高点, 实测左边界和实测右边界与对应波形有两个交点, 这两个交点连线, 形成底部基线。 把底部基线、 左基线、 右基线和波形图所围的闭合图形的面积, 定义为峰面积。 图2(a)为水污染的FTIR峰面积法参数选取, 阴影部分为水份含量为0.88%光谱图所对应的峰面积。 图2(b)为不同时长的氧化油样所对应的FTIR峰面积法参数选取图, 阴影部分为空白油样光谱图所对应的峰面积。 图2(c)为柴油污染油样所对应的FTIR峰面积法参数选取图, 阴影部分为柴油含量12%时光谱图所对应的峰面积。 图2(d)为乙二醇污染油样所对应的FTIR峰面积法参数选取图, 阴影部分为空白油样光谱图所对应的峰面积。 图2中4种污染物及选取的特征波段和实测左边界、 右边界、 左基线、 右基线等值如表1所示。
 | 图2 FTIR光谱峰面积法参数选取图 (a): 水污染; (b): 氧化产物; (c): 柴油污染; (d): 乙二醇污染Fig.2 Parameter selection chart of FTIR spectrum peak area method (a): Water contaminants; (b): Oxidation contaminants; (c): Fuel dilution contaminants; (d): Ethylene glycol coolant contaminants |
| 表1 特征波段的选取 Table 1 The selection of feature bands |
基于峰面积得到回归校正曲线, 建立定标方程, 并计算相关系数。 如图3所示。 图3(a)为水污染比例与峰面积的拟合曲线, 相关系数为0.977 9, 拟合方程为y=0.000 58x2+0.004 7x+0.12。
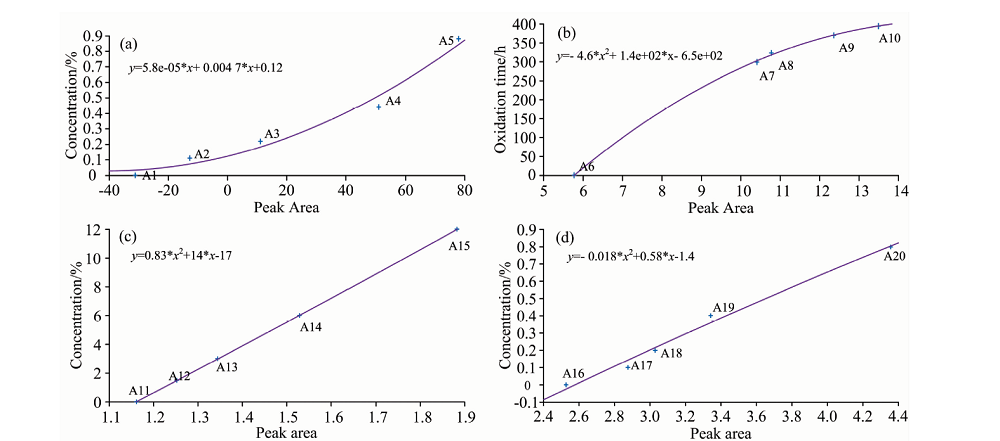 | 图3 水(a)、 氧化(b)、 柴油(c)、 乙二醇(d)污染指标与峰面积的拟合曲线Fig.3 Fitting curves of index and peak area for water (a), oxidation (b), fuel dilution (c), ethylene glycol coolant (d) contaminants |
图3(b)为氧化时间与峰面积的拟合曲线。 相关系数为0.999 6, 拟合方程为y=-4.6x2+140x-650。
图3(c)为柴油污染比例与峰面积的拟合曲线。 相关系数约为1.000 0, 拟合方程为y=0.83x2+14x-17。
图3(d)为乙二醇污染比例与峰面积的拟合曲线。 相关系数为0.989 5, 拟合方程为y=-0.018x2+0.58x-1.4。
结果可知, 通过确定合适的波数段, 并求出波数段嫩对应的峰面积, 能预测实验室油样的污染百分比。 污染比例与峰面积的相关系数分别为0.977 9, 0.999 6, 1.000 0和0.989 5, 预测相对误差如表2所示。 对于水污染, 配比百分比含量小于0.2%时, 预测误差较大; 百分比含量大于0.2%时, 最大预测相对误差的正负偏差均小于10%, 可满足工程需要。 氧化污染物预测的相对误差最大为1%。 燃油污染含量预测的相对误差最大为1%。 对于乙二醇污染, 配比百分比含量小于0.2%时, 预测误差最大为18%; 百分比含量大于0.2%时, 预测误差最大为10%。 根据柴油机油换油指标, 可满足工程需要。
| 表2 Ⅰ 组样品的污染预测值 Table 2 Contaminants forecast of Ⅰ group of oil samples |
对于颜色较深实际油样, 如无法直接测量, 可按比例稀释后, 再进行测量。
把2.3节中求取的定量模型用于Ⅱ 组的3个油样做FTIR光谱分析预测, 其中B1油样的水份含量预测值为0.07%, 柴油百分比含量预测值为2.01%; B2油样的水份含量预测值为0.39%, 柴油百分比含量预测值为9.79%; B3油样的水份含量预测值为0.06%, 柴油百分比含量预测值为19.13%。 通过卡尔菲法测量水份, B1, B2和B3油样的水份含量分别为0.081%, 0.409%和0.070%; 对于含水量超过门阈值(0.2%质量分数), 预测的相对误差值4.6%。 因粘度与柴油稀释比例的相关性, 同时测量B1, B2和B3油样在40 ℃时运动粘度变化率, 计算公式为: (测量粘度-空白润滑油的粘度)/空白润滑油粘度, 分别为7%, 18%和30.7%, 根据柴油机换油指标[11], C2油样水份超过0.20%, B3油样粘度变化超过20%, 需换油。 由以上的应用分析表明, FTIR光谱法分析在用油水份和柴油稀释, 与GB/T推荐的换油指标检测结果, 在定性判断方面是一致的。 FTIR光谱分析结果可满足工程需要。 需要特别提出的是, FTIR光谱分析是在分子水平分析在用油, 揭示变化原因, 对于氧化和燃油稀释同时存在的情况, 具有不可替代的优势。
(1)通过对不同比例混入的水、 柴油、 乙二醇污染油样及不同氧化时间油样的FTIR光谱分析, 确定了所对应的敏感特征波段的具体数值范围。
(2)建立了水、 柴油、 乙二醇污染对应的污染百分比与敏感波段峰面积, 及氧化时间与敏感峰面积的拟合曲线和拟合方程, 并求出水、 柴油、 乙二醇含量百分比与对应峰面积的相关系数分别为0.977 9, 0.989 5和1.000 0, 氧化时间与对应峰面积的相关系数为0.999 6。 水份和乙二醇在含量大于0.2%时, 预测的最大相对误差为10%。 氧化时间和柴油预测的最大相对误差为1%。
(3)利用拟合方程, 通过按比例稀释的方法, 可预测在用润滑油的水、 柴油、 乙二醇污染的百分比含量或氧化时间。
| [1] |
|
| [2] |
|
| [3] |
|
| [4] |
|
| [5] |
|
| [6] |
|
| [7] |
|
| [8] |
|
| [9] |
|
| [10] |
|
| [11] |
|
| [12] |
|