
红外光谱的陆生动物油脂中反刍动物成分鉴别分析
[刘贤 , 徐凌芝, 高冰, 韩鲁佳
* ]
, 徐凌芝, 高冰, 韩鲁佳]
|
|


作者简介: 刘 贤, 1979年生, 中国农业大学工学院副教授 e-mail: lx@cau.edu.cn
为有效应对违法掺加导致的饲料安全隐患, 完善饲用油脂的高效检测手段, 满足饲料质量安全的监管需求, 以来源可靠的不同种属动物油脂为研究对象, 通过在非反刍动物油脂中掺加不同比例(1%, 5%, 10%, 20%, 30%和40% W/W)的反刍动物油脂获得试验样品, 首次系统应用傅里叶变换红外光谱结合化学计量学方法探讨了陆生动物油脂中掺加反刍成分的鉴别分析方法与模型。 研究表明基于掺加比例1%~40%样品集, 偏最小二乘判别分析模型正确判别率为100%, 无假阳性和假阴性样品; 进一步研究发现, 基于陆生动物油脂中反刍成分低掺加比例0.1%~40%, 0.2%~40%, 0.4%~40%, 0.6%~40%和0.8%~40%样品集, 偏最小二乘判别分析模型的正确判别率均低于100%。 且随着最低掺加比例的降低, 假阳性与假阴性样品数明显增多, 其正确判别率逐步降低。 因此, 陆生动物油脂中掺加反刍成分判别分析检量限约为1%; 进一步通过脂肪酸组成与差异性分析、 红外光谱特征波段和特征化学键对比分析探讨其判别分析机理。 非反刍动物油脂光谱3 006 cm-1处吸收峰(代表=C—H(cis-)的拉伸振动)和914 cm-1处吸收峰(代表=HC—CH(cis-)的弯曲振动)明显高于反刍动物油脂样品, 主要表征了顺式脂肪酸和不饱和脂肪酸的显著差异。 非反刍动物油脂光谱965 cm-1处吸收峰(代表—HC=CH—(trans-)的弯曲振动)明显低于反刍动物油脂样品, 主要表征了反式脂肪酸和饱和脂肪酸的显著差异。 掺加比例为1%的混合样品中反式C=C键含量显著高于其他低掺加比例的样品, 而不同掺加比例样品的顺式C=C键含量和C—H(—CH2—)键含量均无显著性差异。 因此, 基于红外光谱的陆生动物油脂中反刍动物成分鉴别分析主要是基于反式C=C键结构的信息表征。 综上所述, 红外光谱可作为一种兼顾检测效率与检测精度的技术应用于陆生动物油脂中反刍成分的鉴别分析。
In order to effectively cope with the feed safety risk caused by illegal additions, improve the detection methods of feeding fat and oils and meet the supervision requirements of feed quality and safety, reliable animal fat and oils were collected, and experimental sample set was obtained by adulterating different proportion (1%, 5%, 10%, 20%, 30% and 40% W/W) of ruminant fats in terrestrial animal fat and oils. Fourier transform infrared spectroscopy (FTIR) combined with stoichiometric analysis was used for discriminant analysis of ruminant constituent in terrestrial fat and oils. Results showed, for the sample set of 1%~40% adulteration proportion, the correct discriminant rate of partial least squares discriminant analysis model was 100%, and no false positive and false negative was found. For the sample set of 0.1%~40%, 0.2%~40%, 0.4%~40%, 0.6%~40% and 0.8%~40% adulteration proportion, the correct discriminant rates were all lower than 100%. With the decrease of the lowest adulteration proportion, the number of false positive and false negative obviously increase, the correct discriminant rate decreases gradually, and the detection limit of FTIR discriminant analysis is proved to be about 1%. The discriminant analysis mechanism was further discussed by comparative analysis of fatty acids, infrared spectral band and chemical bond. It was proved that the absorption peaks at 3 006 cm-1 (representing the tensile vibration of C—H (cis-)) and 914 cm-1 (representing the flexural vibration of —HC=CH—(cis-)) of non-ruminant samples were higher than those of ruminant samples. These mainly reflected the significant difference of cis and unsaturated fatty acids. The absorption peaks at 965 cm-1 (representing the flexural vibration of —HC=CH—(trans-) of non-ruminant samples were lower than those of ruminant samples, reflecting the significant difference of trans and saturated fatty acids. The content of trans-C=C bond for 1% adulteration proportion was significantly higher than the other samples of lower proportions. There was no significant difference for the content of cis-C=C bond and C—H (—CH2—) bond between the samples with different adulteration proportions. Therefore, the discrimination of ruminant constituent in terrestrial animal fat and oils by FTIR was mainly based on the characterization of trans-C=C bond structure. In summary, infrared spectroscopy can be used as a technique to discriminant ruminant constituent in terrestrial fat and oils with both high efficiency and accuracy.
近年来, 动物日粮添加油脂日益受到推崇[1, 2, 3, 4], 其中饲用动物油脂因其种类和来源不同, 质量差异较大[5], 易导致一些利益驱使的违法掺加。 同时为了防止“ 疯牛病” 随着养殖环节传播, 欧盟相继颁布了系列法令法规[6, 7, 8, 9], 禁止在陆生动物饲料中添加陆生动物源性成分, 包括油脂。 2013年我国颁布《饲料和饲料添加剂管理条例》, 亦明确禁止在反刍动物饲料中添加乳和乳制品以外的动物源性成分。 另外受生产条件限制, 动物油脂生产过程中互相交叉污染[10], 也产生较大的饲料安全隐患。 因此, 开展不同种属饲用油脂的鉴别分析具有重要的现实意义。 与传统的油脂检测色谱法相比, 光谱法具有前处理简单、 所需样品量少、 简便快速等优点, 已广泛应用于食用油掺伪鉴别中[11, 12, 13, 14], 极具发展潜力, 但饲用油脂掺伪鉴别相关研究尚未见报道。 本研究基于前期所开展的鱼油中陆生动物油脂成分鉴别分析[15], 首次系统应用傅里叶变换红外光谱结合化学计量学方法探讨陆生动物油脂中掺加反刍成分的鉴别分析。
供试动物油脂样品共22个, 包括猪脂6个, 鸡油5个, 牛脂6个和羊脂5个, 收集自全国不同的饲用油脂企业。 样品均经聚合酶链式反应技术检测, 无交叉污染。
采用均匀混合法进行陆生动物油脂中掺加反刍成分的样品制备, 试验设计混合比例为: 1%, 5%, 10%, 20%, 30%和40%(W/W)。 每个混合比例随机组合非反刍和反刍动物油脂制备20个样品, 共制备样品120个。
样品脂肪酸含量通过气相色谱仪(GC-2014C, 日本岛津公司)进行测定, 色谱分析条件为: 进样量1 μ L, 进样口温度225 ℃, 氢火焰离子检测器, 检测温度320 ℃。 脂肪酸甲酯混合标准样品(47885-U)购买于Sigma-Aldrich公司。 采用外标法计算每种脂肪酸在37种脂肪酸总含量中的相对含量百分比。
红外光谱采集仪器为Perkin Elmer FT-IR Spectrum 400(美国Perkin Elmer公司), 采用衰减全反射附件。 光谱采集范围为4 000~550 cm-1, 分辨率4 cm-1, 扫描次数32次, 每个样品重复扫描3次取其平均光谱。
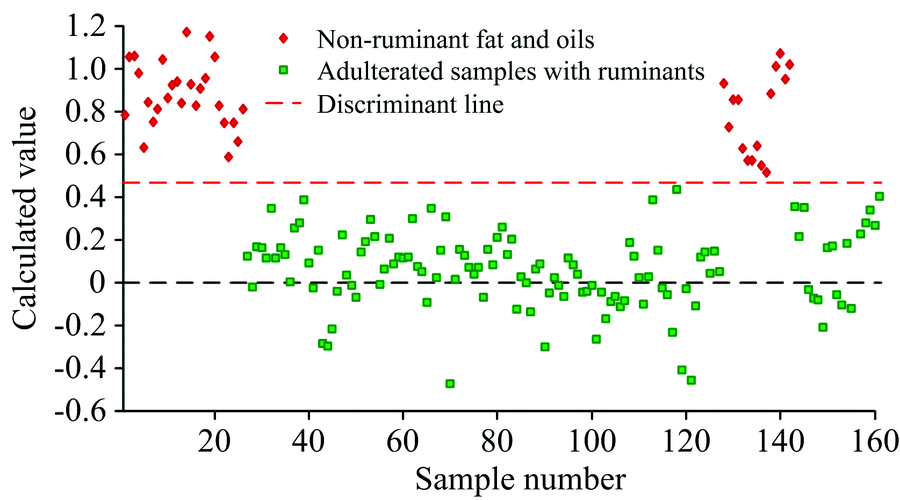
采用PLS-DA法建立陆生动物油脂中掺加反刍成分的定性判别模型, 并采用独立验证集进行分析, 模型结果见图1。 结果分析显示, 所构建判别模型对独立验证集的正确判别率为100%, 无假阳性和假阴性样品。
上述结果可知, 陆生动物油脂中掺加反刍成分判别分析检量限可能低于1%。 因此, 以相同方法进一步配制动物油脂中掺加反刍成分比例为0.1%, 0.2%, 0.4%, 0.6%和0.8%的样品, 探讨其定性判别检量限, 结果见表1。
| 表1 红外光谱判别分析检量限研究结果 Table 1 Results of FTIR detection limit |
基于0.1%~40%, 0.2%~40%, 0.4%~40%, 0.6%~40%和0.8%~40%样品集PLS-DA判别模型的正确判别率均低于100%, 且随着最低掺加比例的降低, 假阳性与假阴性样品数明显增多, 其正确判别率逐步降低。 因此, 陆生动物油脂中掺加反刍成分判别分析检量限约为1%。
基于上述结果, 进一步探讨其判别分析机理。 首先通过脂肪酸组成与差异性分析(表2)发现, 非反刍动物油脂(猪脂与鸡油)与反刍动物油脂(牛脂和羊脂)样品的9种脂肪酸含量存在显著差异。 其中非反刍动物油脂的饱和脂肪酸和反式脂肪酸含量显著低于反刍动物油脂; 而其不饱和脂肪酸和顺式脂肪酸含量则显著高于反刍动物油脂。
| 表2 不同种属动物油脂脂肪酸组成与差异性分析 Table 2 Fatty acid composition and statistical analysis of animal fat and oil materials |
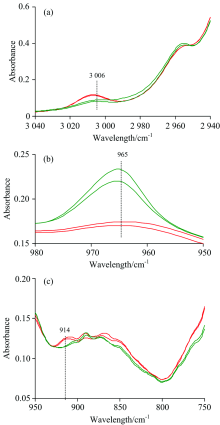
对应的红外光谱特征波段对比分析表明(图2), 非反刍动物油脂光谱3 006 cm-1处的吸收峰(代表=C—H(cis-)的拉伸振动)和914 cm-1处的吸收峰(代表—HC=CH(cis-)的弯曲振动)明显高于反刍动物油脂, 主要表征了顺式脂肪酸和不饱和脂肪酸的显著差异; 而非反刍动物油脂光谱965 cm-1处的吸收峰(代表—HC=CH(trans-)的弯曲振动)明显低于反刍动物油脂, 这与脂肪酸的差异性分析相一致, 主要表征了反式脂肪酸和饱和脂肪酸的显著差异[18]。
 | 图2 动物油脂红外光谱对比分析红色: 非反刍动物油脂; 绿色: 反刍动物油脂Fig.2 Comparative analysis of infrared spectra of animal fat and oilsRed: Non-ruminant; Green: Ruminant |
进一步计算获得动物油脂中掺加反刍成分0~1%混合试验样品的特征化学键包括C=C键及C— H(— CH2— )键数及反式与顺式的C=C键数, 并作差异性分析, 结果见表3。
| 表3 动物油脂中掺加反刍成分特征化学键差异性分析 Table 3 Comparative analysis of chemical bonds for animal fat and oils adulterated with ruminants |
分析可知, 当掺加反刍动物油脂比例为0.8%时, 混合样品中反式C=C键数开始出现差异, 掺加比例为1%的混合样品中反式C=C键数显著高于其他低掺加比例样品; 而顺式C=C键和C— H(— CH2— )键数均无显著性差异。 由此, 基于红外光谱的动物油脂中反刍成分鉴别分析主要是基于反式C=C键结构的信息表征。
傅里叶变换红外光谱可作为一种兼顾检测效率与检测精度的技术应用于陆生动物油脂中反刍成分的鉴别分析。 对于掺加比例1%~40%样品集, 红外光谱辅以PLS-DA方法可较好地进行陆生动物油脂中反刍动物油脂掺加成分的鉴别分析, 正确判别率为100%, 判别分析检量限约为1%, 其鉴别分析机理主要是基于反式C=C键结构的信息表征。
| [1] |
|
| [2] |
|
| [3] |
|
| [4] |
|
| [5] |
|
| [6] |
|
| [7] |
|
| [8] |
|
| [9] |
|
| [10] |
|
| [11] |
|
| [12] |
|
| [13] |
|
| [14] |
|
| [15] |
|
| [16] |
|
| [17] |
|
| [18] |
|