


曲线距离法的二维光纤光谱弯曲校正
[郑子鹏1  , 邱波
, 邱波1, * , 魏诗雅1 , 穆永欢1 , 宋涛1 , 郭平2, * ]
, 邱波, 魏诗雅]
|
|


作者简介: 郑子鹏, 1993年生, 河北工业大学硕士研究生 e-mail: 913167706@qq.com
多目标光纤光谱望远镜可以在一次观测中获得大量的不同天体的光谱数据。 从天体探测到的光在通过光纤之后, 再通过光谱仪狭缝, 然后在CCD传感器中成像为二维光谱图; 之后经过光纤光谱数据处理系统的一系列软件处理, 最终输出可供天文界使用的一维光谱并存储起来。 一维光谱是天文学家研究目标天体的主要手段, 它是通过处理二维光谱图得到的。 以LAMOST为例, 望远镜系统在一次观测后首先会得到32幅由250条光纤光谱组成的二维光谱, 然后经过一系列的处理得到一维光谱。 在这个过程中, 会有很多因素影响到最终一维光谱的精确度。 比如由于望远镜使用时间的增加, 某些元件会产生磨损、 老化或变形, 使得二维光谱中光纤形状会产生一定程度的弯曲, 这种弯曲在二维光谱的两侧表现得尤为明显。 在一幅常见的二维光谱中, 纵坐标方向代表了抽取的一维光谱的波长方向, 横坐标方向代表了抽取的一维光谱的流量方向, 这种弯曲形变的产生会影响到之后的波长定标和流量定标, 使得抽取的一维谱信息不准确。 目前初步的解决办法是通过与定标灯谱的比对来尽量减少其影响。 但这样不仅造成了时间和人力的浪费, 而且准确率和效率不高。 就这一现状, 提出了一种基于曲线距离法的思想, 将弯曲的二维谱线校直: 首先采用灰度重心法将一幅二维光谱中的250条光纤中心轨迹进行定位, 将异常点采用稳健的局部回归方法剔除; 然后将中心轨迹进行曲线拟合, 得到光纤中心轨迹的方程; 通过模仿曲线变弯的逆过程, 即保持轨迹上两点间的曲线距离不变, 再将弯曲的光谱映射到竖直的法线上, 完成校直过程。 在整个过程中保持各个对应点的灰度值不变, 通过边缘处理和插值运算解决产生的像素点稀疏问题。 最后采用累加法进行一维谱抽取, 并将校直后抽取的一维光谱与未校直抽取的一维光谱进行比对, 比对后可发现校直前后在一维光谱的两端差别较大, 其差值谱线也说明了这一点。 该方法实现了二维光谱的自动校直, 大大提高了抽取一维谱的效率和准确性。 二维光谱的预处理和校直方法首先在LAMOST数据上进行验证, 鉴于多目标光纤光谱望远镜系统原理的相似性, 该处理方法也适用于其他的多目标光纤光谱望远镜系统, 具有较好的参考和应用价值。
The multi-target fiber spectroscopic telescope can obtain a large number of spectral data of different celestial bodies in one observation. The light detected from the celestial body passes through the slit of the spectrometer, and after passing through the optical fiber, it is transmitted to the CCD sensor to obtain a two-dimensional spectral image. After a series of processing by the fiber optic spectral data processing system, the available spectral data is finally output and stored. The one-dimensional spectrum is the main means by which we obtain information about the target celestial body. The LAMOST telescope is used to obtain the observed celestial information. Taking LAMOST as an example, before obtaining a one-dimensional spectrum, the telescope system first obtains a two-dimensional spectrum consisting of 250 optical fiber spectra after one observation, and then undergoes a series of processing to obtain a one-dimensional spectrum. However, due to the increased use time of the telescope, the components will wear and age, which will cause a certain degree of bending of the fiber trajectory in the two-dimensional spectrum. This bending is particularly evident on both sides of the two-dimensional spectrum. The ordinate direction of a two-dimensional spectrum represents the wavelength direction of the extracted one-dimensional spectrum, and the abscissa direction represents the flow direction of the extracted one-dimensional spectrum. The generation of such deformation affects the subsequent wavelength calibration and flow. The calibration makes the extracted one-dimensional spectrum information inaccurate. The current initial solution is to minimize the impact by comparing with the calibration lamp spectrum. This not only causes a waste of time and manpower, but also has low accuracy and efficiency. In this paper, we propose a method of straightening the curved two-dimensional line based on the curve distance method. Firstly, the gray center of gravity method is used to locate the 250 fiber center trajectories in a two-dimensional spectrum, and the abnormal point is set. The robust local regression method is used to eliminate the curve, and then the center trajectory is curve-fitted to obtain the equation of the fiber trajectory. By simulating the inverse process of the curve bending, that is, keeping the curve distance between the two points on the trajectory unchanged, and then bending the spectrum Map to the vertical normal line to complete the straightening process. At the same time, the gray value of each corresponding point is kept unchanged, and the sparse problem of generating pixel points is solved by edge processing and interpolation operation. Finally, the one-dimensional spectrum extraction is performed by the accumulation method, and the one-dimensional spectrum extracted after straightening is compared with the undimensionally extracted one-dimensional spectrum. The difference between the two ends of the one-dimensional spectrum before and after the straightening is large, and the difference is passed. The value line also illustrates this. The method realizes the automatic alignment of the two-dimensional spectrum, which greatly improves the efficiency and accuracy of extracting the one-dimensional spectrum. The two-dimensional spectral pre-processing and alignment method proposed in this paper is validated on the LAMOST data at first. Considering the similarity of the principle of the multi-target Optical Fiber Spectral Telescope system, this method can also be applied to other multi-target Optical Fiber Spectral Telescope systems, and has good reference and application value.
LAMOST望远镜采用主动光学技术, 具有新颖的结构和巧妙的设计, 是目前世界上光谱获取率最高的望远镜[1]。 LAMOST每次观测可以获得4 000个天体的光谱, 这4 000个光谱传输到32台光谱仪的狭缝上, 再由CCD探测器得到32幅待处理的二维光谱图。 LAMOST的结构示意图如图1所示[2, 3, 4]。
 | 图1 LAMOST结构示意图Fig.1 Structure diagram of LAMOST |
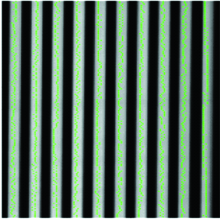
平场光谱的二维光谱图如图2所示。 观察发现, 得到的二维光谱图中250条光纤轨迹都存在一定程度的形变, 尤其以两侧最为明显[5]。 其中, 每条光纤轨迹的中间部分向内侧收拢, 两端向外侧弯曲。 在一幅二维光谱的250条光纤轨迹中, 中间部分的光纤轨迹形变最小, 两侧最大。 在后来的实验中, 通过光纤中心轨迹的拟合也论证这一点。 由于这种形变的存在, 在二维光谱抽取一维谱时, 使得波长定标产生偏差。 现在主要是利用灯谱比对法处理抽取的一维谱, 使抽出的一维谱的波长更为精确。 但是如果直接将二维谱进行校直, 不但可以提高抽取的一维谱的精度, 而且可以大大提升后续的处理效率。 因此, 模拟曲线变弯的逆过程, 提出了一种基于曲线映射法的方法, 实现了二维光谱的校直过程[6, 7]。
 | 图2 二维光纤光谱图Fig.2 2D spectrogram |
在一幅二维光谱上, 250条光纤轨迹并行排列, 每条光纤的轨迹由7列并行的像素点组成, 因此可以将每条光纤轨迹看做7条微弯的曲线, 采用曲线距离法将原轨迹上的每一点映射至法线上, 至此完成曲线的校直, 同时保持每一点的灰度值不变, 从而使得二维光谱像弯曲的绳子一样被拉直[10]。
曲线映射法的原理如图3所示: 采用曲线拟合的方法将弯曲的光谱轨迹进行拟合, 再取光谱轨迹最靠近内侧的一点O, 过O点作法线L, 作为之后的映射直线。 之所以选择O点作法线, 是因为O点靠近一整幅二维光谱的中间部分, 这一部分的弯曲形变最小, 最接近原始光谱。 P点为原来光谱轨迹上的一点, 求出P点到O点的曲线长, 在映射直线上取点P', P'点到O点的直线长等于曲线长。 从而将P点映射到法线L上, 可以求得P'新的坐标值代替P点的坐标值。 观察可得, 该方法会造成法线L上的像素点变得稀疏, 此后可以由边缘处理和插值运算解决。
 | 图3 曲线映射算法原理Fig.3 Principle of curve mapping algorithm |
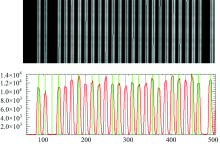
在二维光纤光谱中, 平场曝光图像的信噪比很高, 很适合利用灰度重心法去确定光纤的中心轨迹。 一幅二维光纤光谱图的大小为4 160× 4 136, 经统计, 两根光纤中心轨迹之间的像素点为16个左右, 每一条光纤的轨迹由7列并行的像素点组成, 且在每一行的7个像素点中, 中间点的灰度值最高, 而且灰度值的分布近似为高斯函数, 中间点为波峰所处位置。 因此采用特定的寻峰函数对二维光纤光谱进行逐行检测, 每一行可以寻找到250列波峰点; 然后, 再将这250个波峰点进行一一对应, 这样就可以将250条光纤在二维光纤光谱中的位置标记出来。 如图4所示, 图4(a)为一幅平场曝光图的局部放大图, 每条光纤轨迹的中心均被标记出来, 图4(b)红线为平场曝光图像的某一行的灰度值曲线, 一个峰即为一根光纤, 绿色的线为波峰的位置, 可以看到波峰的位置与上图的光纤轨迹中心位置一一对应。 因此用灰度重心法即可得到光纤位置中心坐标[8, 9]。
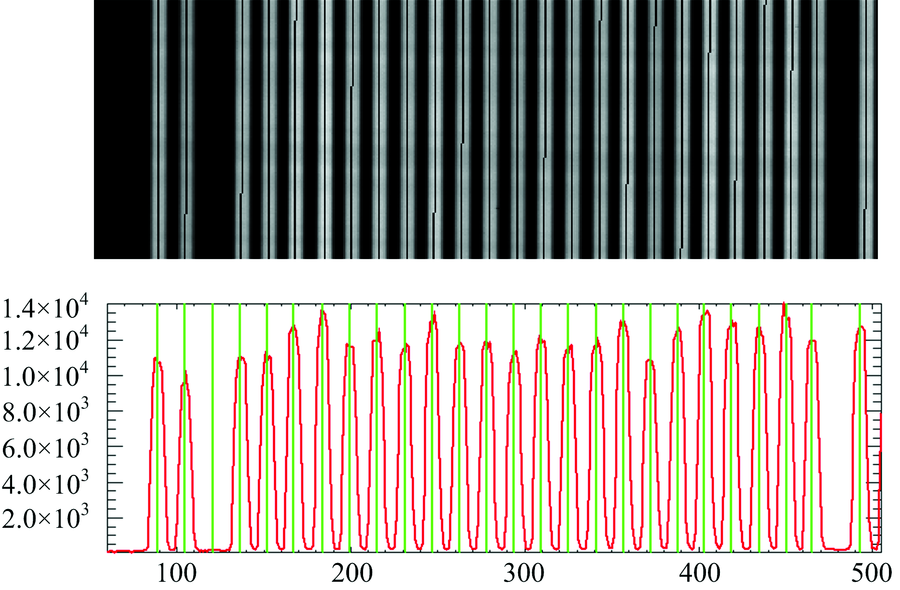 | 图4 (a)光谱中心定位, (b)某行的灰度值曲线及峰值定位Fig.4 (a) The center of the spectrum; (b) the gray value curve and peak positioning of a line |
如表1所示, 分别列举出了第1, 50, 100, 150和200的中心轨迹的横坐标, 最后一列是相对应的纵坐标。 从表中我们可以观察到相邻几行的光纤中心轨迹的横坐标相差不大, 但是行数相差较大时, 中心轨迹的横坐标的变化还是很明显的, 再次证明光纤轨迹确实存在微弯现象。
| 表1 光谱轨迹中心横坐标 Table 1 The horizontal axis of the spectral trajectory |
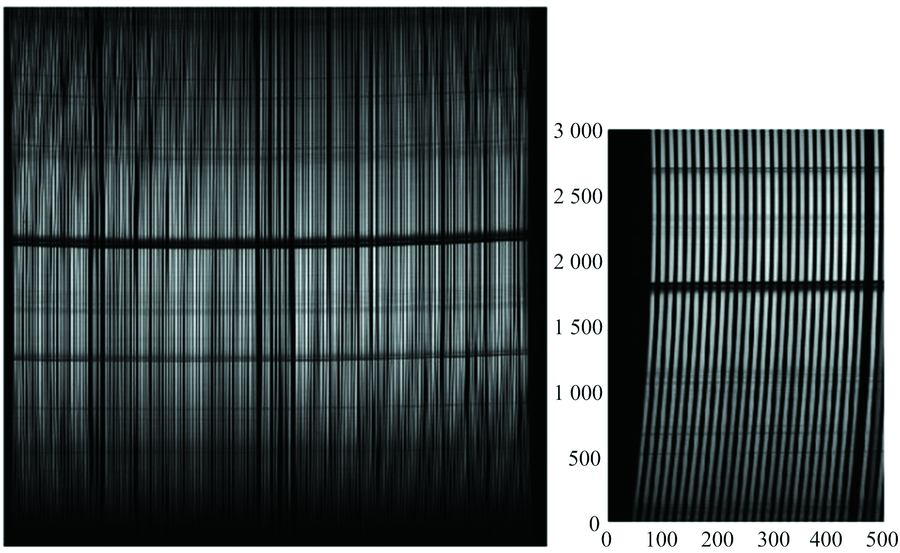
通过寻峰函数将光纤中心轨迹坐标都找到以后, 将某一根光纤的中心点坐标在原图中标记出来, 如图5所示。 可以观察到这是一组离散数据, 并且存在无规律性的变动, 针对异常点, 采用稳健的局部回归方法剔除, 再用曲线拟合的方法拟合出光纤中心轨迹曲线, 如图6所示。
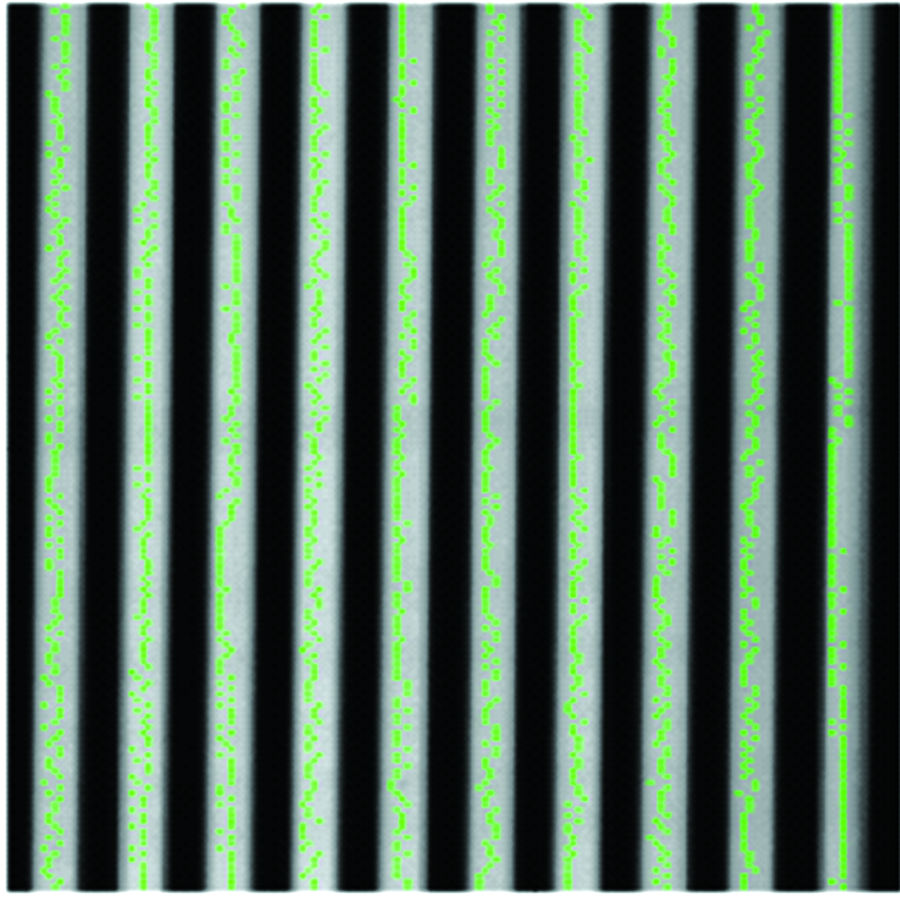 | 图5 灰度值重心法标记光纤光谱中心(局部放大)Fig.5 Gray value center of gravity method marking fiber spectral center (partial magnification) |
通过灰度重心法得到光纤中心轨迹的曲线以后, 再应用曲线距离法将原光谱上的点一一映射至法线上。 首先, 找到曲线上最靠近中间的一点作为基准点; 然后, 过该基准点作法线, 曲线上所有的点均映射至该法线上; 最后, 求得映射点到基准点的曲线长, 与基准点的纵坐标相加或相减, 作为映射点新的纵坐标。
 | 图6 光谱中心在二维图上的拟合结果Fig.6 The fitting result of the spectral center on the two-dimensional map |
将中心曲线上的点映射至法线后, 按照相同的方法将中心线左右3列的像素点映射至各自法线上。 其中各点对应的灰度值不变, 相当于每一行的像素点都有了新的坐标值, 再对其疏密程度进行边缘处理和三次样条插值运算的均匀化, 至此完成一条光纤轨迹的校直。 同理可完成所有二维光谱的弯曲校直工作。
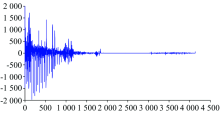
在完成光谱的校直工作后, 为进一步验证校直工作, 采用累加法进行一维谱的抽取。 分别将校直前后的二维光谱的每条光纤中心轨迹两侧7个像素点以内的灰度值按照不同的权值进行求和, 得到抽取的一维谱线, 如图7所示, 横坐标为波长, 纵坐标为流量值。
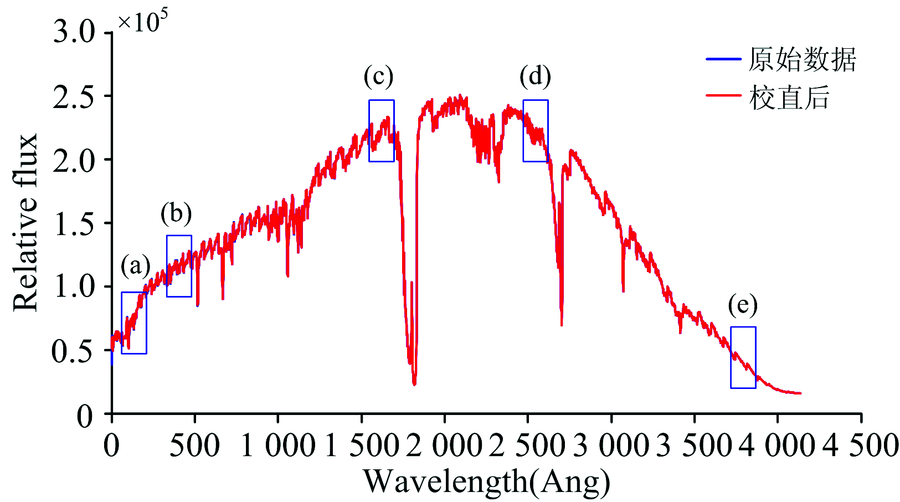 | 图7 校正前后谱线对比图Fig.7 Comparison of spectral lines before and after correction |
将两条谱线进行比对, 蓝色线为原始数据抽谱后所得一维光谱, 红色线为校直后抽谱所得一维光谱, 由于数据量巨大, 在整个波长轴上难以观察其差别, 但是通过其(a), (b), (c), (d)和(e)处的局部放大图(见图8), 可以更为清晰地观察其变化。 其中X和Y表示该点的坐标, Xd和Yd表示两点的横纵坐标的偏移量, Ypd表示纵坐标的偏移百分比。
 | 图8 校正前后对比(各子图与图7顺序对应)Fig.8 Correction comparison (each subgraph corresponds to the order of Figure 7) |
通过观察图8(a)处的放大图, 校直以后谱线向前偏移; 观察(b)和(c)处的放大图, 校直前后在波峰和波谷处变化较为明显; 观察(d)和(e)处的放大图, 校直前后的谱线几乎相同; 观察(f)处的放大图, 在谱线的后端变化较小。 通过两条谱线的差值也验证了这一点, 如图9所示。
 | 图9 校正前后同波长处谱线流量差图Fig.9 Spectral lines’ difference before and after correction |
以LAMOST观测到的二维光纤光谱为例, 通过曲线映射法完成了二维光纤光谱的弯曲校直, 大大提高了后续工作的处理效率, 尤其是对一维光谱的波长定标具有很大的帮助, 提高了抽取一维光谱的准确性。 提出的二维光谱的预处理和校直方法首先在LAMOST数据上进行验证, 鉴于多目标光纤光谱望远镜系统的原理相似性, 该处理方法也适用于其他的多目标光纤光谱望远镜系统, 具有较好的参考和应用价值。
在未来的工作中, 该处理方法的简洁性还应进一步提高, 以及在其他多目标光纤望远镜系统的推广应用也应加强, 提高该方法的普适性。
| [1] |
|
| [2] |
|
| [3] |
|
| [4] |
|
| [5] |
|
| [6] |
|
| [7] |
|
| [8] |
|
| [9] |
|
| [10] |
|