

基于车载被动DOAS系统的化工园区甲醛柱浓度精确反演研究
[胡肇焜1, 2  , 李昂
, 李昂1, * , 谢品华1, 2, 3 , 吴丰成1 , 徐晋1 ]
, 李昂, 谢品华|
|


作者简介: 胡肇焜, 1989年生, 中国科学院安徽光学精密机械研究所助理研究员 e-mail: zkhu@aiofm.ac.cn
甲醛(HCHO)是大气中含量最为丰富的羰基化合物, 是非甲烷可挥发性有机化合物(NMVOCs)的最重要的中间产物之一, 广泛参与大气中的光化学反应, 同时也是气溶胶的重要前体物, 在大气化学中承担了非常重要的作用。 石油化工行业的VOCs类排放是城市大气中HCHO的重要来源, 而目前化工园区中的HCHO等NMVOCs类污染物主要通过点式设备获取近地面浓度, 缺乏立体监测数据。 差分光学吸收光谱(DOAS)技术已成功应用于SO2和NO2等污染气体监测, 甲醛由于其光学吸收强度相对较弱, 反演波段内其他气体交叉干扰强, 实际的监测应用相对较少。 选取某石化企业, 运用被动DOAS方法实现了甲醛柱浓度的精确反演。 研究通过建立甲醛吸收截面与其他参与拟合气体吸收截面的二维相关性矩阵, 选取甲醛吸收截面同其他气体吸收截面相关性最小的波段, 即实现其他气体对甲醛的DOAS反演交叉干扰最小的波段的获取。 同时选取外场实际采集的光谱, 选择不同起始波段和截止波段做迭代DOAS反演, 通过拟合残差来评估甲醛在不同波段的实际反演效果。 在截面间交叉干扰小, 拟合残差低的波段范围内, 选择尽量宽的波段作为最佳的拟合波段, 实现甲醛的精确DOAS反演。 由甲醛同其他气体吸收截面的二维相关性矩阵结果, 甲醛与NO2, SO2和O3和O4间在大部分波段内相关性均在0.5以下, 交叉干扰小; 甲醛同BrO在起始波长318~320 nm, 截止波长340~346 nm以及起始波长330~334 nm, 截止波长354~360 nm两个波段范围内截面间相关性小于0.5, 适合作为HCHO的反演波段。 通过选择不同起始波段和截止波段做甲醛的迭代DOAS反演, 结合拟合截面相关性分析结果综合考虑, 最终采用332.4~358.1 nm作为HCHO的反演波段, 拟合残差在10-4量级。 利用车载被动DOAS系统, 通过建立吸收截面间二维相关性矩阵并通过实测光谱的迭代反演, 获取了适用于该套系统的HCHO最佳拟合波段, 拟合残差降低至10-4量级, 在实现甲醛精确反演的基础上, 结合系统GPS信息, 获取了某化工企业甲醛柱浓度的空间分布, 整个外场观测期间, HCHO的反演误差低于6%。 结果表明, 车载被动DOAS系统在快速获取化工园区甲醛空间分布信息上可以发挥重要作用, 为城市大气中甲醛的立体监测提供了一种有效测量手段。
Formaldehyde (HCHO) is the most abundant carbonyl compound in the atmosphere. It is one of the most important intermediate products of non-methane volatile organic compounds. It is widely involved in photochemical reactions in the atmosphere and is also an important precursor of aerosols. Formaldehyde plays an important role in atmospheric chemistry. The emission of VOCs from the petrochemical industry is an important source of HCHO in the urban atmosphere. At present, the pollutants of NMVOCs such as HCHO in the chemical park are mainly near-ground concentration through point-type equipment and lack of stereoscopic monitoring data. The Differential Optical Absorption Spectroscopy technology has been successfully applied to the monitoring of pollutant gases such as SO2 and NO2. Due to the relatively weak optical absorption intensity of formaldehyde, the cross-interference of other gases in the inversion band is strong, and practical monitoring applications are relatively rare. The paper selects a petrochemical company and uses a passive DOAS method to accurately invert formaldehyde column concentrations. In this paper, the relationship between the absorption profile of formaldehyde and other two-dimensional correlation matrix that is used to fit the gas absorption cross-section is established, and the band with the smallest correlation between the absorption profile of formaldehyde and other gas absorption profiles is selected. The acquisition of the band that minimizes cross-interference from DOAS inversion of formaldehyde by other gases is achieved. At the same time, the spectrum actually collected in the field is selected, and different initial bands and cut-off bands are selected for iterative DOAS inversion. The residuals are used to evaluate the actual inversion effect of formaldehyde in different bands. In the region where the cross-interference between the cross-sections is small and the fitting residual is low, the widest band is selected as the best fitting band to achieve accurate DOAS inversion of formaldehyde. From the results of the two-dimensional correlation matrix of absorption profiles of formaldehyde and other gases, the correlation between formaldehyde and NO2, SO2, O3, and O4 is below 0.5 in most of the bands, and the cross-interference is small. The correlation between formaldehyde and BrO at the initial wavelength of 318~320 nm, cutoff wavelength of 340~346 nm and initial wavelength of 330~334 nm, and cutoff wavelength of 354~360 nm is less than 0.5 in these two wavebands, which is suitable as the inversion waveband of HCHO. Through the selection of different initial bands and cut-off bands for the iterative DOAS inversion of formaldehyde, combined with the correlation analysis results of fitting cross sections, 332.4~358.1 nm was finally used as the inversion band of HCHO, and the fitting residual was 10-4. In this paper, a passive vehicle-borne DOAS system is used to establish the HCHO best-fit band for the system by establishing a two-dimensional correlation matrix between absorption cross-sections and through iterative inversion of the measured spectrum. The fitting residual is reduced to 10-4. Based on the accurate inversion of formaldehyde and combined with GPS information of the system, the spatial distribution of formaldehyde concentration in a chemical company was acquired. During the entire field observation period, the error of HCHO inversion was less than 6%. The results show that the vehicle passive DOAS system can play an important role in quickly obtaining the spatial distribution information of formaldehyde in the chemical industry park, and provides an effective measurement method for the stereoscopic monitoring of formaldehyde in the urban atmosphere.
甲醛是对流层中最为丰富的羰基化合物[1], 广泛参与大气中的光化学反应。 城市大气中的甲醛一次来源为化石燃料的不完全燃烧及化工企业的对外排放; 二次来源为大气中非甲烷可挥发性有机化合物(non-methane volatile organic compounds, NMVOCs)的光化学反应。 甲醛在大气中的活性很高, 它可以通过光化学反应生成HO2自由基, HO2自由基与NO快速反应生成OH自由基, 因此甲醛还是重要的大气OH自由基来源[2]。 甲醛同时还是NMVOCs氧化反应的最主要中间产物[3], 其浓度分布可近似反映NMVOCs的分布[4]。 监测大气环境中甲醛的时空分布具有重要意义。
在已有的甲醛研究中, 针对室内环境的研究较多, 针对城市大气环境中甲醛的研究相对较少。 常规的甲醛测量方法主要包括气相色谱法、 分光光度法、 液相色谱法等[2]。 除适用于实验室环境的常规点式测量系统外, 甲醛的空间分布信息往往需要通过遥测技术获取, 常见的甲醛遥测方法包括长光程差分吸收光谱系统[5, 6, 7, 8](LP-DOAS)、 多轴差分吸收光谱系统[9, 10, 11, 12, 13, 14, 15, 16](MAX-DOAS)、 卫星遥感[17, 18, 19]和车载被动差分光学吸收光谱(differential optical absorption spectroscopy, DOAS)[20, 21, 22]遥测系统等方式。 LP-DOAS和MAX-DOAS仪器常作为监测站点设备, 体积大, 不易携带。 卫星观测可以很好地反映大面积的HCHO空间分布, 但空间和时间分辨率较低, 难以满足诸如化工园区等区域的监测需求。 车载被动DOAS遥测系统具有光学结构简单等优点, 可满足实时机动的测量需求。 近年来, 该技术已广泛应用于NO2和SO2等痕量气体空间分布的立体监测[23, 24]。 然而, 由于甲醛吸收截面光学吸收强度相对较弱以及反演过程中多个气体截面之间的相互干扰, 使得车载被动DOAS系统的甲醛反演效果较差, 适合的甲醛的反演波段也不易确定, 导致针对甲醛空间分布的立体监测数据相对较少。
本文利用车载被动DOAS系统[25], 通过建立二维相关性矩阵选择痕量气体吸收截面间交叉干扰最小的波段范围, 并利用实际光谱迭代反演确定了针对当前被动被动DOAS系统优化的甲醛最佳拟合波段, 提高HCHO的反演精度。 在实现甲醛精确反演的基础上, 结合车载被动DOAS系统GPS信息, 获取了该化工企业甲醛柱浓度的空间分布信息。
车载被动差分吸收光谱技术基于Lambert-Beer定律, 以天顶散射光作为被动光源, 利用空气中的气体分子的窄带吸收特性, 可同时获取多种痕量气体的整层的柱浓度。 针对车载DOAS系统测量谱I(λ )与参考谱I0(λ )的关系可用式(1)表示
式(1)中
车载被动DOAS系统如图1所示, 主要由微型光纤光谱仪、 紫外石英光纤等部件组成[12]。 为满足甲醛反演, 系统采用分辨率为0.6 nm的紫外光谱仪, 波长范围为290~420 nm, 波段内包含了多个甲醛的强吸收峰。
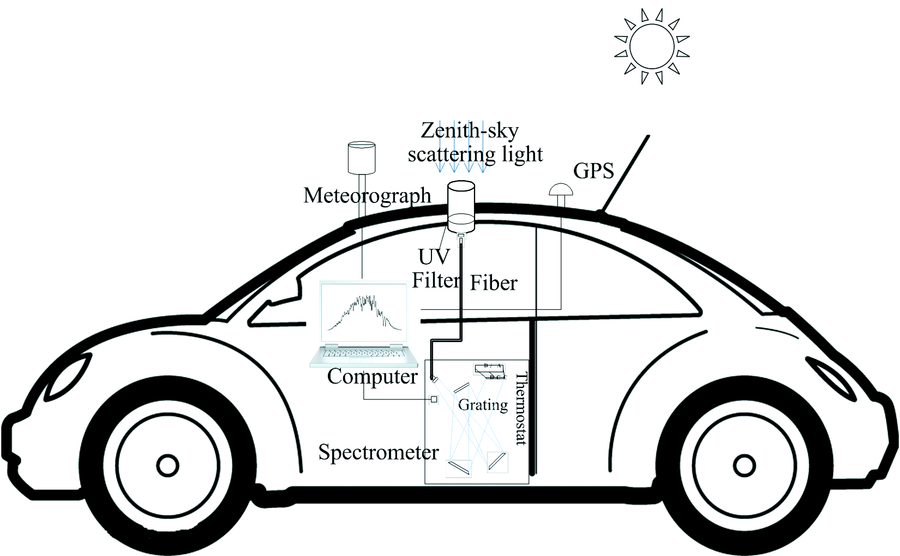 | 图1 车载被动差分吸收光谱系统结构示意图Fig.1 Mobile passive differential absorption spectroscopy system structure diagram |
选择某主营业务为石油炼制和烃类衍生物生产的化工企业开展外场实验。 为获取该化工企业HCHO的空间分布, 特别设计了对该企业的绕行路线, 该化工企业位置及具体路线详见图2, 全程共计26.4 km, 需30 min完成。
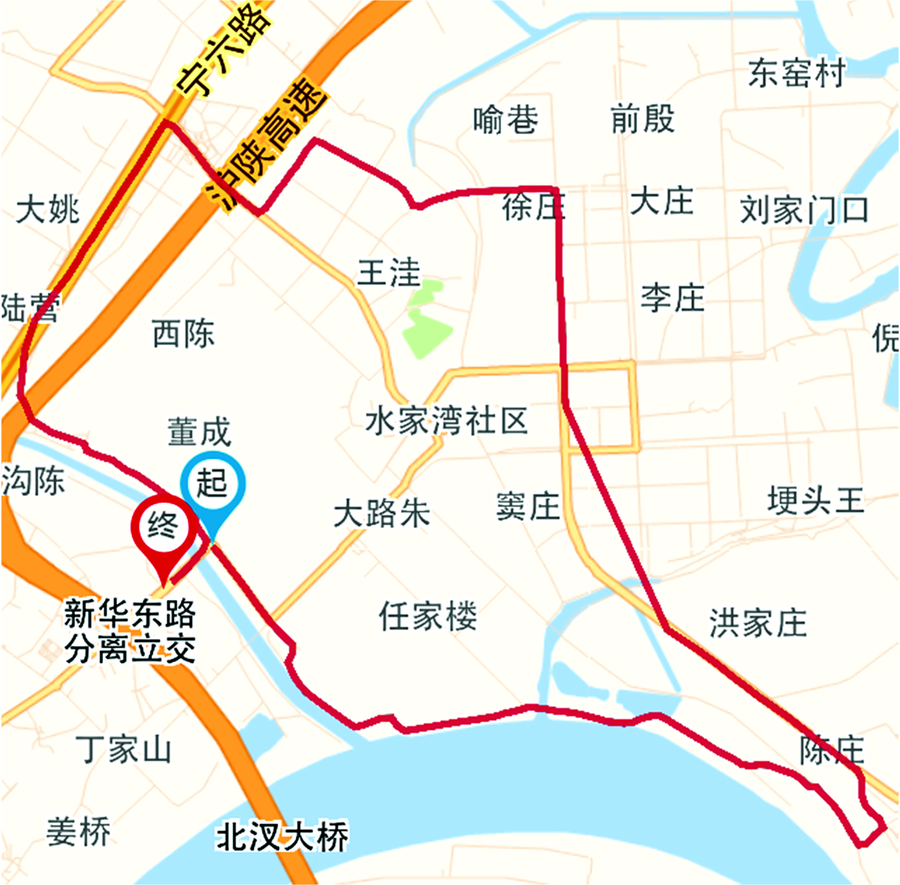 | 图2 某石化企业观测路线Fig.2 The petrochemical observation route |
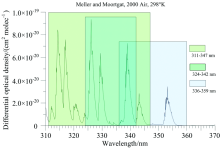
甲醛的吸收结构在紫外波段240和360 nm之间。 在320 nm以下波段, 臭氧具有较强的吸收结构。 通常只在320 nm以上波段反演HCHO, 吸收截面细节如图3所示。
 | 图3 甲醛吸收截面及常用反演波段Fig.3 HCHO cross section and commonly used inversion band |
在以往的研究中(详见表1), 以氙灯等紫外灯做光源的LP-DOAS主要在324~360 nm波段反演HCHO; 以太阳光作为光源的Zenith-sky DOAS, MAX-DOAS, Imaging DOAS, 遥感卫星等被动DOAS方法中, HCHO的反演波段主要集中在310~347, 324~342和336~359 nm。 以上波段均包含了3个以上的甲醛强吸收峰。 在近年的研究中, 被动DOAS多选择336~359 nm作为HCHO的DOAS反演波段。
| 表1 发表文献中的HCHO反演波段 Table 1 HCHO inversion band in the published paper |
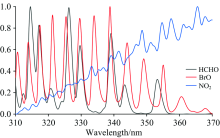
对甲醛拟合效果的干扰主要来自在拟合波段有吸收的其他气体。 图4示意了310~370 nm间HCHO, BrO以及NO2归一化后的吸收截面。 由图中结果, HCHO和BrO具有相似的吸收结构, 特别是在317, 329和338 nm等位置上2种气体存在着吸收峰的交叠, 在HCHO的反演过程中会产生严重的交叉干扰, 影响HCHO柱浓度的反演。
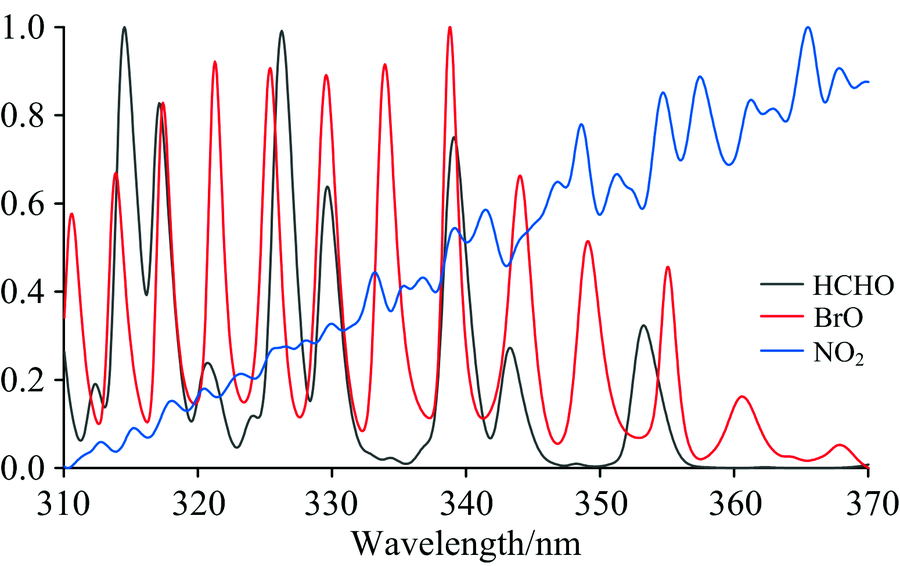 | 图4 HCHO, BrO和NO2归一化后吸收截面Fig.4 Cross section after normalization of HCHO, BrO and NO2 |
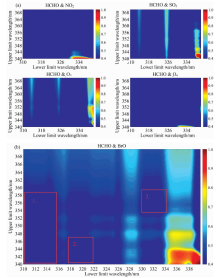
为降低反演波段内其他气体对目标气体的反演干扰, 在DOAS反演中需要规避其他气体截面和目标气体截面相关性强的波段。 结合实际使用的光谱仪, 将参与拟合的气体截面同光谱仪狭缝函数卷积, 卷积后的HCHO吸收截面分别与其他气体截面建立二维相关性矩阵, 横坐标为起始波段, 纵坐标为截止波段, 颜色映射对应波段的皮尔森相关性系数, 如图5所示, 每一个点均代表了一个反演波段, 图中蓝色区域代表了相关性系数小于0.5的波段范围。 根据DOAS反演特点, 适宜的反演波段还需要覆盖尽可能多的目标气体截面吸收峰以及合适的波段长度。
 | 图5 HCHO与其他参与拟合气体吸收截面相关性矩阵Fig.5 HCHO and other participating gas fitting cross-correlation correlation matrices |
如图5(a)所示HCHO与NO2, SO2, O3和O4间在大部分波段内相关性均在0.5以下, 因此以上4种气体对HCHO反演的交叉干扰小。
如图5(b)所示在310~370 nm波段范围内, HCHO与BrO截面间存在3个相关性小于0.5的波段范围, 在图5b中使用红色框体标出。 框体1中波段范围均超过30 nm, 虽然包含了最多的吸收峰, 但覆盖波段范围过宽, 在DOAS反演中会存在更多的未知吸收结构, 带入更多的拟合残差, 影响HCHO的拟合效果。 框体2(起始波长318~320 nm, 截止波长340~346 nm)和框体3(起始波长330~334 nm, 截止波长354~360 nm) 内波段范围截面间相关性小于0.5, 波段长度为20 nm左右且波段范围内均包含了3~4个HCHO截面的强吸收峰, 适合作为HCHO的拟合波段, 在以往的研究中, 存在采用框体2或3范围内波段反演HCHO的报道。
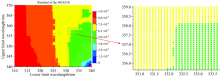
实际光谱拟合中, 常用拟合残差来评估拟合效果。 选取某化工园区外场试验过程中正午采集的光谱做迭代DOAS反演, 参与反演气体包含HCHO, NO2, SO2, O3, O4以及BrO。 获取了不同波段的拟合误差, 用以评估HCHO在不同波段的拟合效果。 结果如图6所示横坐标为起始波段, 纵坐标为截止波段, 颜色映射对应波段的DOAS拟合残差。
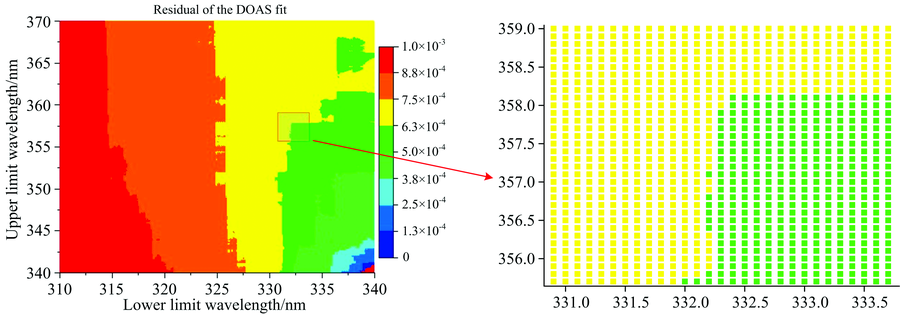 | 图6 HCHO的DOAS拟合残差分布Fig.6 HCHO DOAS fitting residual distribution |
在起始波段为310~340 nm, 截止波段为340~370 nm的波段范围内, DOAS拟合残差最低为3× 10⁻⁴, 拟合残差越低即代表DOAS拟合效果越好。 结合上一节拟合截面相关性分析结果综合考虑, 残差分布的绿色区域同相关性分布的蓝色部分在起始波段332~334 nm, 截止波段354~359 nm范围内存在交叠。
综合考虑以上分析, 在截面间交叉干扰小, 拟合残差低的波段范围内, 选择尽量宽的波段作为最佳的拟合波段, 本文最终采用332.4~358.1 nm作为此次外场试验使用的车载被动DOAS系统HCHO的反演波段。
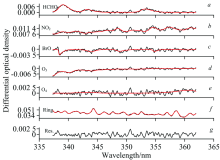
确定反演波段后, 运用被动DOAS原理对光谱数据进行了批量反演, 图7示意了2014年8月5日14:30:20的一条测量光谱反演HCHO的过程, 参与拟合的气体除了在该波段有吸收的痕量气体HCHO以及O3, NO2和BrO外, 还有Ring结构。 图4(a)中显示的是测量光谱经过卷积后的差分吸收截面(黑线)和拟合得到的VCD=1.49× 10¹⁷ molec· cm-2的HCHO差分吸收结构(红线)的叠加。 图7g为最终拟合后的剩余结构(黑线), 峰值为1.05× 10⁻³, 主要来源为未知成分的吸收和系统噪声。 该条光谱反演HCHO的拟合误差为4.93%。
 | 图7 HCHO拟合示意Fig.7 Example for HCHO fitting |
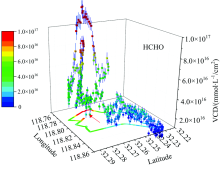
将每一条光谱反演得到的柱浓度及其误差信息结合车载被动DOAS系统的GPS记录的经纬度信息, 即可以实现车载观测路径上HCHO柱浓度空间分布信息的获取, 该化工园区HCHO分布结果如图8所示, 蓝色小柱表示反演误差。 由于针对实验期间使用的系统对反演波段进行了精细优化, 整个外场观测期间, HCHO的反演误差低于6%。 红色箭头代表了观测期间的主导风向, 在化工区下风向位置, 存在明显的HCHO柱浓度高值, 代表化工区域内对外存在明显的HCHO排放。
 | 图8 某化工园区甲醛空间分布Fig.8 Formaldehyde spatial distribution in the chemical industry |
利用车载被动DOAS系统实现了某化工企业甲醛柱浓度分布的精确测量, 通过建立二维相关性矩阵选择痕量气体吸收截面间交叉干扰最小的波段范围, 并利用实际光谱迭代反演确定了适用于当前被动DOAS系统的甲醛最佳拟合波段为332.4~358.1 nm。 结合车载被动DOAS系统GPS信息, 实现了该化工企业甲醛柱浓度的空间分布信息。 甲醛作为一种重要的挥发性有机物对生态系统及生活环境具有重要影响, 本文的实验研究结果表明, 车载被动DOAS系统可以实现化工园区甲醛柱浓度分布的快速获取, 为重点区域的甲醛污染状况提供有效的监测手段。
| [1] |
|
| [2] |
|
| [3] |
|
| [4] |
|
| [5] |
|
| [6] |
|
| [7] |
|
| [8] |
|
| [9] |
|
| [10] |
|
| [11] |
|
| [12] |
|
| [13] |
|
| [14] |
|
| [15] |
|
| [16] |
|
| [17] |
|
| [18] |
|
| [19] |
|
| [20] |
|
| [21] |
|
| [22] |
|
| [23] |
|
| [24] |
|
| [25] |
|