


两类红花和牛黄的太赫兹光谱法真伪鉴别分析
[杨玉平1  , 张成
, 张成1 , 刘海顺2 , 张振伟2, * ]
, 张成]
|
|


作者简介: 杨玉平, 1976年生, 中央民族大学理学院副教授 e-mail: ypyang_cun@126.com
藏红花和天然牛黄是广泛应用于临床实践的中药材, 由于产量较低、 药用价值和价格高, 市场需求量大等因素, 掺伪和伪品较多, 不仅严重损害患者健康, 而且妨碍市场正常运转。 传统的“一看、 二闻、 三泡”等经验鉴别方法已经越来越难以分辨高仿伪品; 而通过化学提取和色谱、 质谱等理化检测方法往往步骤繁琐、 费时, 且对检测环境、 人员及设备的要求和依赖度较高, 不能适应现场、 快速、 简便等实际需求, 亟需探索新的有效检测方法和鉴别技术。 太赫兹时域光谱(THz-TDS)不但具有单纯化合物的高度专属性和特异性, 又具有混合体系的“宏观指纹特征”, 可以鉴别混合物化学成分的多样性和复杂性。 另外, 主成分分析(PCA)作为一种常用的统计分析手段, 主要是用少数几个且能最大解释原始数据方差的综合变量来取代原始变量, 可以对不同种类的样本进行模式识别。 采用粉末研磨压片技术分别压制了藏红花和草红花样品各18个、 天然牛黄和人工牛黄各20个, 并利用太赫兹时域光谱测试技术分别测量了两种名贵中药材及其伪品在0.3~2.5 THz范围的吸收光谱, 最后利用主成分分析方法对获得的光谱数据进行分类识别。 为了提高PCA对测试数据的鉴别能力, 一方面将数据集映射到一组基(特征向量)进行简化, 选用较大的特征值代替原来的主要光谱信息; 另一方面, 为了消除无关因素对分类处理的干扰, 在进行PCA之前采取了Savitzky-Golay(S-G)平滑处理进行降噪, 去除冗余、 不相关的光谱特征; 然后通过Fisher诊断线进行判别分析。 对比未处理和经过S-G平滑处理的主成分得分图, 可以看出平滑处理后的分类效果明显优于未做处理的, 在未处理的得分图中, 两类样品点重叠比较严重, 而经过平滑后的得分图却只有相对较少的部分样品点重叠, 由此可以看出SG平滑在光谱识别中的重要性; 另外, 前两个主成分(PC1和PC2)已经基本能反映光谱之间的差异性。 分类结果显示, 藏红花和草红花具有明显的聚类趋势, 分类鉴别准确率均为100%; 而人工牛黄和天然牛黄的类内样品基本聚在一起, 但是类间略有重叠, 分类鉴别准确率分别为100%和90%。 除此之外, 样本的主成分得分图还可以反映样本的内部特征和聚类信息。 其中, 藏红花样本由于藏红花素、 藏红花酸等化合物成分含量较高, 聚合度较好, 分布范围相对集中; 反之, 天然牛黄为胆囊分泌物, 成分较为复杂, 聚类效果较差, 分布范围较广。 研究结果表明, 太赫兹光谱技术结合主成分分析可以区分藏红花和草红花以及天然牛黄和人工牛黄, 结果可靠。 该研究结果为丰富中草药的质量标准提供检测手段和理论依据。
Saffron and natural bezoar are two traditional Chinese medicines widely used in clinical practice. Due to their lower yields, high medicinal value and price, market demand and other factors, more and more adulteration and counterfeit goods not only seriously damage the health of patients but also hinder market normal operation. However, the empirical methods based on observation, smell and soak have become increasingly difficult to distinguish high imitation counterfeits. In addition, the traditional physical and chemical detection techniques through chemical extraction, chromatography and mass spectrometry are cumbersome and time-consuming, and have high requirements and reliance on testing environments, professional ability and equipment. They cannot meet the actual needs of on-site, rapid and simple identification. Thus, it is urgent to explore new and effective detection methods and identification techniques. Terahertz radiation has very low energy and terahertz time-domain spectroscopy (THz-TDS) possesses not only the high specificity of pure compounds but also the “macroscopic fingerprint characteristics” of the hybrid system to identify the diversity and complexity of the chemical composition in the mixture. In addition, as a common statistical analysis method, principal component analysis (PCA) mainly replaces the original variables with a few comprehensive variables that can explain the variance of the original data to the greatest extent and can perform pattern recognition on different kinds of samples. In this work, 18 pieces of saffron and safflower samples as well as 20 groups of natural and artificial bezoar were respectively compressed by using pellet compression. The absorption spectra of two kinds of valuable Chinese medicinal materials and their counterfeit products, saffron and safflower as well as natural and artificial bezoar, were measured using THz time-domain spectroscopy in the range of 0.3~2.5 THz. Finally, the principal component analysis (PCA) was used to identify the obtained data set. In order to improve the identification ability of PCA, on one hand, the data set was mapped to a set of bases (feature vectors) for simplification, and larger eigenvalues were selected instead of describing the original main spectral information; on the other hand, in order to eliminate the impact of noise on the classification process, we adopted Savitzky-Golay(S-G)smoothing before PCA to remove the redundant and irrelevant spectral features; the discriminant analysis was then performed using Fisher’s diagnostic line. Comparing the principal component scores with and without S-G smoothing, classification results with S-G smoothing were obviously distinguished and the first two principal components could basically reflect the differences between spectra. It could be clearly seen that in the unprocessed score plots, the overlapping of the two types of samples is severe, whereas only a relatively small number of sample points overlap in the smoothed score plots, indicating the role of SG smoothing in spectral identification. The classification results showed that the saffron and safflower had obvious clustering trends, and the accuracy of classification identification of saffron and safflower were both 100%; while there was a slight overlap of artificial bezoar and natural bezoar even though the intra-class samples basically gathered together, and the classification accuracy was 100% and 90%, respectively. Furthermore, the principal component score of the sample can also reflect the internal characteristics of the sample and the clustering information. Among them, the saffron sample contains higher compounds of crocin, crocetin and other content, so that better degree of polymerization has been obtained and the distribution is relatively concentrated; on the other hand, the compounds contained in the natural bezoar are more complex. Consequently, the clustering effect is poor and the distribution range is wide. The reliable results based on the THz-TDS and PCA not only distinguish between saffron and safflower as well as natural and artificial bezoar, but also provide the means and theoretical basis for enriching the quality standard of Chinese herbal medicine.
红花和牛黄是两种应用广泛的中药材, 但由于产地较多, 各产品主成分和药效也存在很大的差异, 导致各自的价格也差别很大。 特别是产自西藏的藏红花(Saffron)以及取自牛科动物结石的天然牛黄(Natural Bezoar)由于资源稀少, 价格昂贵, 致使掺伪和伪品时有发生。 比如, 经常有人用新疆、 甘肃等地的草红花(Safflower)冒充藏红花, 或是在天然牛黄粉中掺入一定量的人工牛黄(Artificial Bezoar)粉。 甚至有不法商贩为了达到以假乱真的目的, 将草红花进行染色冒充藏红花, 不但牟取暴利, 还威胁到消费者的身体健康和生命安全。
目前, 红花和牛黄的质量控制方法仍以经验鉴别为主, 辅以少量现代理化分析如薄层色谱、 紫外光谱、 红外光谱、 显微鉴别法等[1, 2, 3]。 但是, 上述方法步骤繁琐、 费时, 且对检测环境、 人员及色谱板的要求和依赖度较高, 不能适应现场、 快速、 简便等实际需求。 另外, 由于某些化学成分(胆红素、 胆酸等)对光、 热不稳定, 且紫外、 红外吸收较弱, 采用普通光谱测试方法均存在准确度和重复性较差的问题。 因此, 亟需探索新的有效检测方法和技术。
对于化学成分相近、 光学性质相似的无特征吸收峰的物质, 并且在多样本的情况下, 一般难以直接识别, 而使用化学计量学的方法可以进一步对样本进行分类识别。 最近, 太赫兹时域光谱(THz-TDS)已经成为中草药鉴别的新型探测技术, 结合神经网络、 支持向量机、 主成分分析法等化学计量学方法, 成功鉴别了甘草、 柴胡、 豆根、 大黄、 冰片、 天麻、 人参等药材的质量真伪、 主成分指纹谱、 水含量等[4, 5, 6, 7, 8, 9, 10]。 由于主成分分析(PCA)使用得到的几个主成分替代原始变量, 能更容易抓住主要矛盾, 反映事物内部变量之间的规律, 在解决实际问题中独具优势[11]。 本文采用THz-TDS技术测量了两种名贵中药材及其伪品, 藏红花和草红花、 天然牛黄和人工牛黄, 在0.3~2.5 THz范围的吸收光谱, 对光谱数据进行平滑, 结合主成分分析方法进行鉴定判别。
实验所用的藏红花、 草红花、 天然牛黄和人工牛黄均购于同仁堂药业有限责任公司。 实验中为了保证样品的均匀性和测量的稳定性, 样品制备采用粉末研磨压片的方法。 即将样品风干后充分研磨成细小微粒后过200目筛, 然后将研磨样品和聚乙烯粉末按一定质量比混合均匀, 压制成厚度为3.0 mm的薄片, 作为样品。 采用同样的方法制作一片纯聚乙烯粉末压片, 作为参考。 其中, 藏红花和草红花各压制了18组测试样品, 天然牛黄和人工牛黄各压制了20组样品。
所用THz-TDS光谱仪为本实验室自主搭建测试系统, 在干燥的氮气环境中进行测定, 积分时间为300 ms, 有效光谱波段范围为0.2~3.5 THz, 扫描次数为3次, 通过3次扫描测量获得的数据取平均, 从而保证样品数据具有代表性、 并且噪声低。 其装置原理及仪器详见参考文献[7, 8, 9, 10]。
将时域波形经快速傅里叶变换, 得到参考压片和样品压片的傅里叶变换光谱Eref(ω )和Esam(ω ), 则样品的吸收率
一般情况下, 原始吸收谱数据会包括系统噪声和样品不均匀、 光散射等实验因素以及数据处理(反射峰、 取样窗口等)导致的噪声。 用Savitzky-Golay(S-G)方法进行平滑滤波, 可以提高光谱的平滑性, 并降低噪声的干扰。 S-G滤波器是一种常见的低通滤波器, 可以较好地去除噪声并保留大部分的原始信息。
草红花和藏红花在频率为0.3~2.5 THz的吸收曲线如图1(a)所示, 未做任何预处理。 可以看出, 两类样品的吸收光谱曲线比较类似, 没有明显吸收峰。 在低频区, 两类样品几乎全部重叠, 难以直接区分; 在高频区, 两类样品部分重叠, 区分度较好。 将藏红花和草红花的18个测试数据再取平均, 如图1(b)所示, 可以看出草红花样品的平均吸收在高频区整体高于藏红花, 这可能是由于两种红花的成分不同造成的。
 | 图1 藏红花和新疆红花未经S-G光滑处理的吸收光谱(a)和平均吸收光谱(b)Fig.1 (a) THz absorbance spectra and (b) the averaged absorbance of saffron and safflower specimens without S-G smooth |
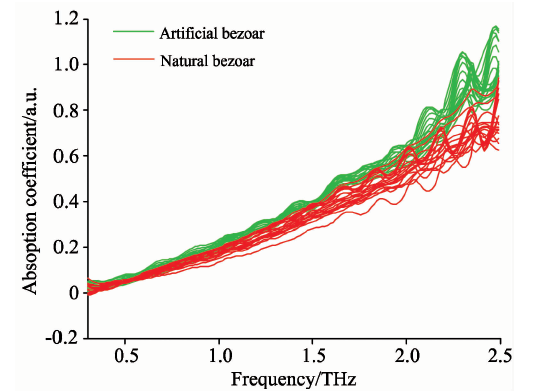
我们对天然牛黄和人工牛黄的数据做类似处理, 如图2所示。 取平均的方法虽然可以整体上区分两类样品, 但是不能对每个样品进行聚类分析。
接下来, 我们使用主成分分析(PCA)对光谱数据进行聚类分析。 为了消除噪声对分类处理的影响, 我们在进行PCA之前采取了Savitzky-Golay(S-G)平滑预处理方式; 本次实验中, S-G平滑滤波器的拟合多项式的阶数为3阶, 平滑点数为15点。 图3、 图4为经过平滑后的两种红花和两种牛黄的吸收光谱。
 | 图2 天然牛黄和人工牛黄未经S-G光滑处理的吸收光谱(a)和平均吸收光谱(b)Fig.2 (a) THz absorbance spectra and (b) the averaged absorbance of natural and artificial bezoar without S-G smooth |
 | 图3 藏红花和新疆红花经S-G光滑处理的吸收光谱Fig.3 THz absorbance spectra of saffron and safflower specimens with S-G smooth |
 | 图4 天然牛黄和人工牛黄经S-G光滑处理的吸收光谱Fig.4 THz absorbance spectra of natural and artificial bezoar specimens with S-G smooth |
然后, 我们从未处理和预处理后的光谱数据中提取出前两个主成分; 将前两个主成分的得分值作为特征数据, 在图中表示出来, 如图5— 图8所示; 然后通过Fisher诊断线进行判别分析。
 | 图5 藏红花和新疆红花未经S-G光滑处理的第一、 二主成分得分图Fig.5 Scattered scores plots PCA1 vs. PCA2 for the saffron and safflower data without S-G smooth |
 | 图6 藏红花和新疆红花经S-G光滑处理的第一、 二主成分得分图Fig.6 Scattered scores plots PCA1 vs. PCA2 for the saffron and safflower data with S-G smooth |
 | 图7 天然牛黄和人工牛黄未经S-G光滑处理的第一、 二主成分得分图Fig.7 Scattered scores plots PCA1 vs. PCA2 for two kinds of bezoar data without S-G smooth |
 | 图8 天然牛黄和人工牛黄经S-G光滑处理的第一、 二主成分得分图Fig.8 Scattered scores plots PCA1 vs. PCA2 for two kinds of bezoar data with S-G smooth |
2.2.1 藏红花和草红花
图5和图6分别对应两类红花未处理和经过S-G平滑处理的吸收光谱的前两个主成分的得分图, 其中横坐标代表各个样本的第一主成分得分, 纵坐标表示各个样本的第二主成分得分, 对应的前两个主成分的方差贡献率分别为94.6%, 2.74%和97.4%, 1.44%。 从图可以看出, 原始数据由于噪声干扰较多, 藏红花和草红花之间互相交错, 不能区分开来; 而S-G平滑滤掉了部分原始数据间的噪声, 因此在滤除原始噪声之后再使用PCA处理, 可以更好地去除原始数据间的冗余和无关成分, 光谱数据被Fisher诊断线分为两类, 如图6所示。 其中, 藏红花样本全部位于诊断线上方, 且18个样本的聚合度较好; 而草红花样本全部位于分类线下方, 且18个样本的聚类效果相对差些, 所分布的范围较大; 判别准确率均为100%。
2.2.2 人工牛黄和自然牛黄
类似地, 我们可以得到两种牛黄未处理和经过S-G平滑处理的吸收光谱的前两个主成分得分图, 对应的前两个主成分的方差贡献率分别为72.4%, 12.9%和88%, 5.93%, 如图7和8所示, 并且同样可以看出经过平滑预处理后的光谱数据具有更好的效果。 对于这组经过S-G平滑处理后的两类样品的主成分得分图, 我们发现第一主成分就几乎可以将两
类样品分开, 说明PCA能更好地将二者的化学成分的差异性在处理后的光谱数据中体现出来。 然而有两个天然牛黄样品的第一主成分得分值大于零, 与人工牛黄的样品距离更近, 直观上与人工牛黄成为一类, 使得天然牛黄和人工牛黄的判别准确率分别为90%和100%。 另外, 由于两种牛黄成分较为复杂, 我们尚不能确定出相应的物质基础。
基于太赫兹光谱技术和主成分分析方法及S-G平滑滤波, 实现对藏红花和草红花、 人工牛黄和天然牛黄进行定性分类和判别。 通过比较平滑前后的主成分得分图, 可以看出分类效果有了明显改善, 其中, 藏红花和草红花的分类鉴别准确率均为100%, 而人工牛黄和天然牛黄的分类鉴别准确率分别为100%和90%, 为该类名贵中药的质量标准提供检测手段和理论依据。
The authors have declared that no competing interests exist.
| [1] |
|
| [2] |
|
| [3] |
|
| [4] |
|
| [5] |
|
| [6] |
|
| [7] |
|
| [8] |
|
| [9] |
|
| [10] |
|
| [11] |
|