


Chemical Effect Analyses of 3d Elements by Study of X-Ray Fluorescence Spectra
引用本文
Sevil(Porikli) DURDAĞI. Chemical Effect Analyses of 3d Elements by Study of X-Ray Fluorescence Spectra. Spectroscopy and Spectral Analysis, 2018,38(8): 2630-2637. 
Doi: 10.3964/j.issn.1000-0593(2018)08-2630-08
Permissions
Copyright©2018, 光谱学与光谱分析
光谱学与光谱分析 所有
Chemical Effect Analyses of 3d Elements by Study of X-Ray Fluorescence Spectra
e-mail: sporikli@gmail.com
Abstract
Spectra of K X-rays emitted from pure 3d transition metals and their oxide and sulfate compounds were measured using a single crystal wavelength dispersive X-ray spectroscopy (WDXRF). The measurements were performed using a ZSX-100e sequential spectrometer equipped with an Rh X-ray tube operated. An accurate analytical representation of each line was obtained by a fit to a Lorentz function. The spectra were analyzed in order to examine the K X-ray peak parameters such as asymmetry index, peak energy and relative intensity ratios. The energy shifts and relative intensities weredetermined tobetter understand the chemical effect.
Key words:
Asymmetry index; Relative intensity ratio; Chemical effect; Wavelength dispersive X-ray spectroscopy (WDXRF)
Introduction
It is well known that the X-ray spectra are sensitive to the chemical states of the emitting atoms and are of great use for studying the atomic and electronic structure in materials. X-ray emission spectra induced by an electron beam (electron-probe micro analysis (EPMA)) or X-ray (X-ray fluorescence spectroscopy (XRF)) have been applied to qualitative and quantitative analyses and chemical state analyses for solid samples. Additionally, high resolution particle-induced X-ray emission (PIXE) is a promising method for chemical state analysis.
Changes (variations) occurring in the X-ray emission spectra can be classified into four categories: changes in wavelength, presence or absence of bands or lines, changes in bandshape and changes in band intensity. The effects of the chemical combination, however, are not large and a theoretical interpretation of these effects has not been established completely. Several experiments showed that the chemical environment of the atom does affect the 3d and 4d elements Kβ /Kα ratio[1, 2]. In the earlier studies of 3d metal compounds the influence of chemical effects has shown difference in the Kβ /Kα X-ray intensity ratios[3]. Such chemical effects can be caused either by a varying 3d electron population or by the admixture of p states from the ligand atoms to the 3d states of the metal or both.
Apaydı n et al.[4] published measured values for the Kα 2/Kα 1, Kβ 1; 3/Kα 1, and Kβ 1/Kα 1 X-ray intensity ratios for 65≤ Z≤ 92, using a Si(Li) detector and a 57Co radioisotope source. Ito et al.[5] reported experimental and theoretical values for the intensity ratio value Kα 2/Kα 1 for Zn. Dagistanli et al.[6] calculated the 3d occupation numbers of the transition elements corresponding to various types of atomic configurations by means of the linear muffin-tin orbital (LMTO) method. They used this data with the multiconfiguration Dirac-Fock (MCDF) X-ray intensity ratios to estimate the electron populations of the 3d metals in alloys.
Low energy X-ray spectra such as L X-ray spectra of transition metals and their compounds and K X-ray spectra of light elements and their compounds are significantly influenced by the chemical environment[7, 8]. Moreover, only a few studies have been reported on the measurement of chemical state effects on the L series intensity ratios. The theoretical setof intensity ratios, ILk/ILα 1 (Thr.) (k=l, η , α 2, β 1, β 2, 15, β 3, β 4, β 5, 7, β 6, β 9, 10, γ 1, 5, γ 6, 8, γ 2, 3, γ 4) for elements with 36≤ Z≤ 92 atincident photon energies ranging EL1< Einc≤ 200 keV evaluated using the Li(i=1~3) sub-shell photoionization cross sections based on the relativistic Hartree-Fock-Slater (HFS) model, the X-ray emission rates based on the Dirac-Fock (DF) model, and the fluorescence and Coster-Kronig yields based on the Dirac-Hartree-Slater (DHS) model have recently been reported by Kumar et al.[9]. Also, Kumar et al.[10] reported the intensity ratios, ILk/ILα 1 (Exp.) (k=l, η , β 4, 6, β 1, 2, 3, 15, β 5, 7, γ 1, 5, γ 2, 3, 6, 8, γ 4, β ) have been measured for some compounds of 80Hg, namely, HgI2, Hg(C2H3O2)2 and apure 80Hg target (liquid form) at 22.6 keV incident photon energy in order to investigate the influence of chemical effects on these ratios for a heavy transition element.
The chemical shift on X-ray emission lines is usually interpreted with the effective charge or oxidation number of the X-ray emitting atom[11]. Although many of the studies show a systematic dependence of Kβ /Kα ratios on the oxidation state of the element, the experimental data from individual experiments have a relatively large spread[12, 13]. Major causes of this spread are the method of vacancy production, particle size effects, data analysis procedures to obtain the areas under the peaks and the uncertainty in the various corrections involved, such as the detector efficiency and self absorption in the specimen. To elucidate the dependence of intensity ratios on the chemical state, the above mentioned conditions have to be well controlled; otherwise the measure variation of intensity ratio can be in error because of the interrelationship of these effects.
In this work, spectra of K X-rays emitted from a 3d transition metals and their oxide and sulfate compounds were measured in high resolution wave length dispersive X-ray spectrometer (WDXRF). After the measurement, characteristic quantitaties such as peak energy, indices of asymmetry are determined and finally, the relative intensity ratios Kβ /Kα are delivered from the fits. The measured spectra were described in terms of a background function (a straight line) and peaks have Lorentz profiles. Both the Microcal Orgin 7.5 program and system’ s own peak evaluation program were used for peak resolving and background subtraction of K X-rays.
2 Methods and Measurements
The d-block transition metals have great importance in our lives. The transition metals give off electrons from their outer s orbital, but most can lose a multiple number of d orbital electrons. Because of this many of the d-block metals have multiple oxidation numbers. This causes d-block metals to make great catalysts. In today’ s society transition metals are in their highest demand ever. Metals are also the key ingredient in automobiles because of their strength, durability and extreme resistance to heat and fire. Metals are used to make wires, refrigerators, and anything else that has metal parts. Anything that needs electricity has metal components because metals are electrical conductors.
Various compounds of3d transition metals in different oxidation states and chemical environments were obtained in powder form. For powdered samples, particle size effects have a strong influence on the quantitative analysis of infinitely thick specimen. Even for specimens of intermediate thickness, in which category the specimens analyzed in the present study fall, these effects can be significant. Therefore, to circumvent particle size effects all samples were ground and sieved through -400 mesh (37 μ m) sieve. The specimens were prepared as pellets by pressing the powdered homogenous mixture at 10 ton in-2 pressure in a hydraulic press. The pellet mass was kept in the 8~15 mg· cm-2 range.
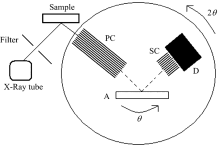
The measurements were made with X-ray fluorescence commercial equipment (Rigaku ZSX-100e) with a wavelength dispersive analysis system (Fig.1).
 | Fig.1 Single crystal wavelength-dispersive X-ray spectrometer set up |
The principle of WDXRF spectrometry is the use of different analyzer crystals to diffract and separate the different characteristic wavelengths of the elements present in the sample. Energy resolution and efficiency for each analytical line also depend on the collimator aperture and the analyzer crystal in use. Several different collimators can be used to reduce the step/scan resolution, as well as up to eight analyzer crystals, to better enhance spectral data for a specific element. The crystal analyzer was a place LiF1 (200) crystal (Fig.2).
 | Fig.2 Scheme of wavelength-dispersive X-ray spectrometerSC and PC: Primary collimator and secondary collimator; A: Analyzing crystal, LiF1 (200); D: Detector consisting of a scintillation counter |
This instrument is usually equipped with a 3 kW Rh-anode tube working at a voltage range of 20~50 kV and a current from 50 to 20 mA. It is possible to use primary beam filters (made of Al or Cu) between the primary radiation and the sample holder to reduce the background continuum and to improve the signal-to-noise ratio. Detection can be performed using a flow proportional counter (light elements) or a scintillation counter (heavy elements).
In this work, analyses were made in vacuum atmosphere. Moreover, to avoid possible problems with inhomogeneity when measuring the samples, a sample spinner facility was used in all cases. X-ray emission spectra were recorded on a fluorescence spectrometer comprising a wide angle horizontal goniometer by stepping the spectrometer through Bragg angle 2θ in steps of 0.001° . The counting time during the step scanning was selected in such a way that the standard deviation in intensity measurement never exceeded 1%. The dwell time for one channel was defined in such a way that the peak intensity was more than 10 000 counts. The energy calibration was performed with the Kα lines of pure Cr. The spectrometer was evacuated down to 10-2 Torr and the spectrometer temperature was stabilized at 36.5 ℃ within ± 1 ℃. The effect of temperature on the features of X-rays emission spectra was found to be negligible. To investigate the spectrometer sensitivity in measuring of intensity and energy shift, one sample at same conditions was measured for three times. Because of the use of instruments such as sieve weight and hydraulic press errors are caused in the results of analysis. These errors were called manual and instrumental errors. Three samples were prepared and measured for same conditions to determine these errors and each sample measurement was repeated three times to prove that the possible radiation damage effects were not significant. All spectra were normalized at the same height at the maximum intensity point to facilitate the comparison of resolution and of spectral changes. As the window with of the spectrometer varies with the wavelength and the exact shape of the window is not known, spectra given in this work have not been corrected for the instrumental broadening. This is not considered to have any significant effect on the spectral interpretations which are offered. Moreover, these instrumental broadening corrections will not change the position of the emission line features and would have negligible effects on the other parameters of the emission line. The energy position of the spectral features have a probable error of ± 0.05 eV.
Rigaku has improved their semi-quantitative software package further with the introduction of SQX. It is capable of automatically correcting for all matrix effects, including line overlaps. SQX can also correct for secondary excitation effect by photoelectrons (light and ultra-light elements), varying atmospheres, impurities and different sample sizes. The obtained spectra were converted to energies by inversion of the channels to be treated using the means of the SQX software.
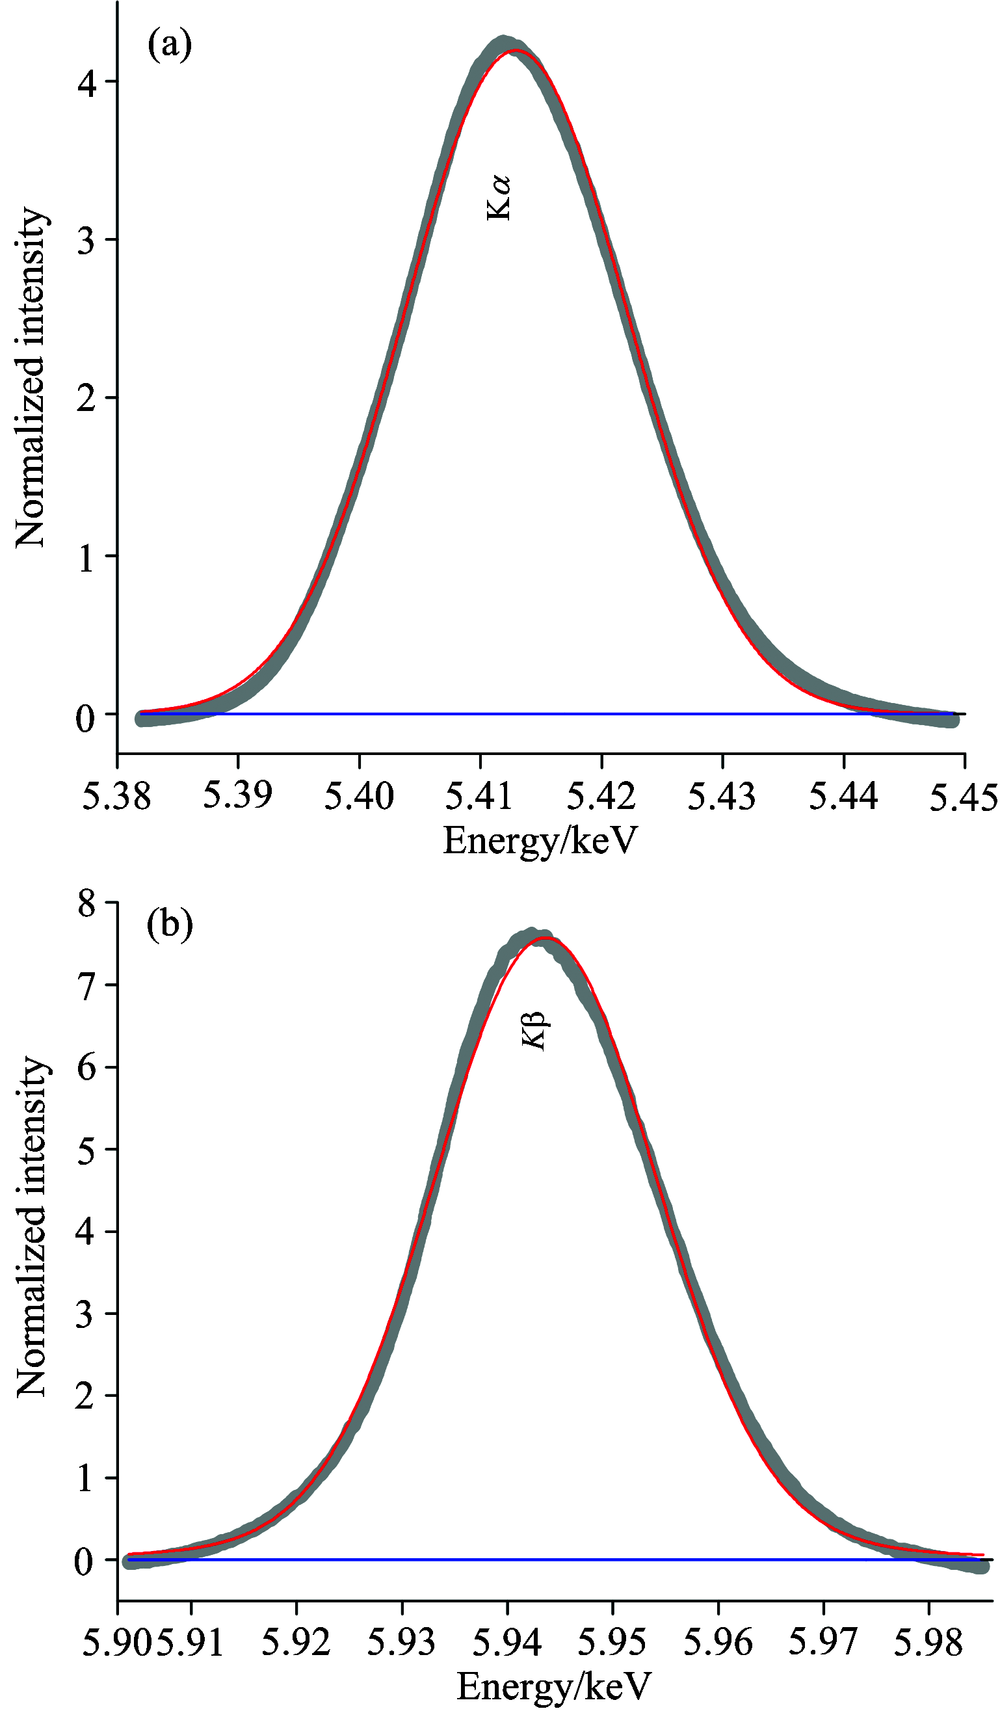 | Fig.3 Solid circles: Measured spectrum of Cr K X-rays; Lines: Overall fitting function (red) and background (blue) |
In addition, all of the spectra were plotted by computer in order to reduce subjective and statistical bias.The obtained spectra were analyzed by using the Orgin 7.5 software code to perform spectral deconvolution and fitting and to evaluate element net peak areas from the spectra. Peak fitting was done by iteration to better adjust the peak and the background to minimize the chi-square of the fitting on each spectra. Fig.3 shows the spectrum of Cr. Measured numbers of counts are shown as solid black circles, while the red line represents the overall fit. The background is shown as a blue line.
3 Results and Discussion
An atomic inner-shell/subshell vacancy is rapidly filled up by an outer-shell/subshell electron with either a photon (characteristic X-ray) or an Auger electron being emitted. These!transitions are referred to as radiative and non-radiative transitions, respectively. In either of these two alternative decay modes, the primary vacancy is transferred to a higher-shell/subshell vacancies may be created. This vacancy cascade process continues until all vacancies reach the outermost occupied shell/subshell. Regardless of how they are produced, X-rays emitted from a chemically bound atom can yield information on the atomic and electronic structure of the surroundings.
| Table 1 Index of asymmetry and energy shift (Δ E) values for the measured spectra |
When the environment of the emitting atom is changed, there are changes in the position of emission lines with respect those in the pure metal. These changes are called chemical effect and this effect has rarely been utilized in the characterization of materials. The purpose of this work was to study chemical effects and discuss their applications to 3d transition metals in various compounds. In Table 1 are given the results for the energy shifts and asymmetry indices of the Kα and Kβ lines and their relative intensity ratios. In the following sections we discuss the results in greater details.
The index of asymmetry is defined as the ratio of the half widths at half height on the low and high energy sides of the peak. In Table 1, the index of asymmetry for the Kα and Kβ are presented. It is clear from the results that the asymmetry index values of the Kβ are generally smaller than the Kα peak. This is true for Fe and Co, which have the highest asymmetry among the 3d transition metals. Among all the compounds, the V, Cr and Mn compounds shows large deviations for both lines. It can be seen from Table 1 that the Kα and Kβ lines which are asymmetric in the case of Cr2O3 and Cr2(SO4)3· 12H2O and then gradually becomes more and more symmetric as the oxidation state of Cr increases. In CrO2, where Cr ions are in the tetragonal structure, the emission lines are almost symmetric. Same deviations are observed for V, Mn and Fe compounds. In addition to the above observations, there is a definite correlation between the asymmetry indices and coordination number of the materials studied in this investigation. For compounds in which the coordination number is high [e.g., in Cr2O3, the coordination number of Cr is six], asymmetry of the line is large. For a lower coordination of compounds such as CrO3 (where the coordination number of Cr ions is four), the emission line becomes more symmetric.
Despite the large spread, a general trend for the Z dependence of the index can be observed from the Fig.4. The Z dependence of the asymmetry of Kβ peak shows a characteristic deviation from Kα . The maximum asymmetry is shifted to Co and there exists a distinct minimum for Ni to Cu. These deviations were ascribed to the unique electronic structure of the atoms in this range, which have a partly or fully populated 4s shell and an open 3d shell, giving rise to complicated transition structures in the X-ray emission process. Attempts were made to correlate these deviations with the number of unpaired 3d electrons in the atom and shown a reasonable qualitative correlation with the Z dependence of the deviations.
 | Fig.4 Asymmetry indices for the Kα and Kβ lines of V, Cr, Mn, Fe, Co, Ni, Cu and Zn, derived from the present measurements |
The peak position was determined at the center point of the 9/10 intensity of the smoothed line shape. The chemical shift was the difference between the center point of the 9/10 peak intensity of a compound and that of pure form[14].There was not much difference before and after smoothing, which reflected that the applied smoothing method did not affect the data. The shifts are towards the low energy side for all 3d elements and their compounds. The magnitude of these energy shifts increases with increase in the oxidation state. Higher vanadium oxidation states give significant energy shifts. Concerning K-M2, 3 line shifts, results of the previous workers showed negative energy shifts whereas in this work negative shifts were determined too. We have also been reported this phenomenon previously for Cu and Zn compounds[1]. For Cu and Zn compounds, the measured chemical shifts of Kα and Kβ emission lines are in agreement with those obtained previously by EDXRF taking into account experimental uncertainties. Then we specify more detail, the line shapes of Kβ are not symmetric. Cu(IO3)2 and CuSO4, where the Kβ peak shifts are large, show prominent asymmetry. A trend is clearly seen between oxidation states and V, Cr, Mn and Fe Kα and Kβ line shifts. Compare with the both Kα and Kβ peak of the Co compounds, that of shifted to lower energy and their oxidation states are same, the peak shift ordering was CoCO3< CoO< Co(ClO3)2· 6H2O< CoSO4· 7H2O. Although the distribution within trigonal or hexagonal compounds may cause some ambiguity, the separations between the shifts among different oxidation states are large enough to be distinguished. The energy shifts of the lower oxidation states are almost negligible. This is consistent with the previous measurements of photoinducedX-ray florescence spectra.Data for Cr, V, and Mn compounds confirm that the measured Kα shifts are generally less than about 0.5 eV.
In the most general case, chemical speciation is preferably performed via the analyses of the Kβ lines. These lines emitted after the transition of valance electrons, are more sensitive to the chemical environment. Thus, the energy shifts of the Kβ X-ray emission lines are usually much more pronounced than the corresponding shifts of the principal Kα emission lines, which are expected to be less affected by chemical bonding effects. Therefore, it seems more appropriate that for the 3d transition elements chemical speciation has to be carried out via the Kβ emission lines, where the observed energy shifts range from about -0.17 eV up to more than -0.71 eV, or through other characteristics of the emission spectra than energy shifts.
Kβ /Kα intensity ratio values have been widely used also for critical evaluation of atomic structure model calculations. To avoid complications, the measuring conditions (tube voltage and current, slit widths, etc., ) remained same in the determination of intensity ratio values. The corrections applied to the data after the measurements are as follows: the absorption in air and in the Be window of the X-ray tube, the self absorption of the radiation produced in the X-ray tube anode and the self absorption of the sample. The errors in the sample self-absorption correction and sample preparation were estimated by analyzing many samples of various thicknesses. The integrated error including the counting statistics errors were estimated to be less than 3 and 5% for all 3d elements Kα and Kβ peaks, respectively, yielding an error limit of < 5% for the (Kβ /Kα ) intensity ratios.
The experimental results for the Kβ /Kα ratios of V, Cr, Mn, Fe, Co, Ni, Cu and Zn for the case of pure metals and in different compounds are presented in Table 2. In the absence of chemical effects, these ratios will be unity. Many studies have shown a systematic dependence of the Kβ /Kα ratio on the chemical and/or solid state effects[15, 16]. In some previous studies it was shown that the relative intensities are higher in compounds than in the elements[17, 18, 19].
| Table 2 Kβ /Kα relative intensity ratios for the various 3d elements and their compounds |
As can be seen from Table 2, the relative Kβ /Kα ratios of Cr in Cr2(SO4)3· 12 H2O, Fe in Fe2O3, Co in CoCO3 and generally all Cu and Zn compounds are in close agreement with the ratios of corresponding pure metals. The greatest increase of the Kβ /Kα ratio has been observed for Co in Co(ClO4)2· 6H2O. However for Ni in NiSO4· 6H2O, we have found significant decrease of the Kβ /Kα ratios. It can seen from the table that the deviation from the expected value of unity for the V2O5, Cr2(SO4)3· 12H2O, Fe2O3, Ni2O3, Cu(NO3)2 and ZnO compounds is less than 5%. Our measured value of the Kβ /Kα ratio of V is larger than the quoted values of Sö gü t et al.[3] and Rebohle et al.[15]. Our Kβ /Kα ratio result for Cr compounds does not show any significant change over the pure metal. Also our relative Kβ /Kα ratio of Cr compounds with respect to pure Cr is found to be in disagreement with the earlier published results. The present Fe and Co compounds are not the same as those studied earlier. But the agreement between this experiment and the others is generally satisfactory. The 3d shell is complete in the case of Zn, so one expects no influence of the chemical environment on the Kβ /Kα intensity ratio. Table 2 shows that these ratios are unity with in experimental uncertainties.
V2+ compounds are ~10% higher than the corresponding peak intensities obtained from V5+ compounds. We found that the relative intensity ratio values for V compounds changed with the increasing values of oxidation states. We could say that the reason for these changes isthe fractional covalency. The fractional covalency increases from V2O3 to V2O5, and the localization of d electrons also increases. But our observations do not show any dependence of the Kβ /Kα intensity ratio of the other 3d elements on oxidation state changes.
Our analysis shows that the changes of the Kβ /Kα X-ray intensity ratios for 3d elements in compounds (with respect to the pure metals) can be explained as a result of changes in the valence electronic configurations of 3d elemets due to the presence of an alien atom. Because 3d electrons in these compounds and in the pure transition metals should be considered as electrons localized on the ions, while 4s electrons as the delocalized.The change of the number of 3d electrons modifies 3p orbitals much stronger than 2p orbitals, what must be followed by substantial modification of Kβ transitions and almost no modification of Kα transitions. This leads to the strong change of the Kβ /Kα X-ray intensity ratio. Also, we have tried to explain with the combination of the screen effect through the loss of d electrons in the 3d atom and the covalency effect that effectively localized d electrons. Strong covalent compounds in general have large Kβ /Kα intensity ratios which can be considered as predominantly coming from the non-diagram lines due to the band mixing between the metal and the ligands. 3d electrons play an important role in the Kβ X-ray emission process, although they do not take part directly in the X-ray emission process, and the screening effect due to 3d electrons for 3p and other valance electrons is the dominant reason for the change in the Kβ /Kα ratio.
4 Conclusion
The chemical effect on the line parameters and Kβ /Kα relative intensity ratio values for some 3d elements and their compounds have been studied experimentally. The measurements have have been performed with the single crystal spectrometer, where special attention was given to minimizing the instrumental error. The K X-rays emitted from the sample excited by X-rays have been analyzed by a LiF1 (200) crystal and measured with a scintillation counter. The K X-ray emission spectra of 3d transition elements have been with great interests for a long time because of their asymmetric shapes. A dependence of the asymmetry index and chemical shift on the chemical constitution of the atom was found in compounds of the partly filled 3d elements. There is correlation (reduction) between the oxidation number of the material and peak parameters. The observed reduction in the asymmetry indices with increase in oxidation state seems to be linked with number of unpaired 3d electrons. It was proposed that the anomalous widths and asymmetric line shape results from an exchange interaction between electrons of the incomplete 3d shell and those of the 2p shell, left open by the X-ray emission process. These kind of observation led to consider that the interaction between the hole created in the 2p3/2 and 2p1/2 shell (due to the transition of an electron from this shell to the 1s level) and the electrons in the incomplete 3d shell in the transition metal atoms is responsible for asymmetric nature of Kα 1, 2 lines. This is not the only consideration which can explain the origin of the asymmetry of the line; there are other considerations which are based on the relaxation effect of the inner state or on the interactions between 2p hole and electrons in the Fermi sea.
Compared with some lighter elements, such as V and Cr, the chemical shift of the Kα lines is very small, falls into the range of -0.13 to -0.62 eV. This trend of small Kα energy shifts for the 3d transition and late transition elements has therefore been also confirmed by our experiments. It has been observed that the charge transfer effect was a main cause of the small chemical shift. Therefore, it seems more appropriate that for the 3d elements chemical speciation has to be carried out via the Kβ emission lines, where the observed energy shifts more than Kα lines.
We did not find any systematic relation between the Kβ /Kα X-ray relative intensity ratio and the oxidation number of the element in the compound. But these ratio values are different for distinctive compounds of 3d elements and the dependence of these ratios on the chemical environment is appreciable. As a result, we can say that in chemical effect analyzing studies, the accurate experimental investigations can now yield valuable information molecular structure and dynamics.
The authors have declared that no competing interests exist.
参考文献
| [1] |
|
| [2] |
|
| [3] |
|
| [4] |
|
| [5] |
|
| [6] |
|
| [7] |
|
| [8] |
|
| [9] |
|
| [10] |
|
| [11] |
|
| [12] |
|
| [13] |
|
| [14] |
|
| [15] |
|
| [16] |
|
| [17] |
|
| [18] |
|
| [19] |
|