


一种基于多普勒频移光谱的中性束注入器气体靶厚度诊断的新方法
[王艳1, 2 , 刘智民1, 2 , 焉镜洋1, 2 , 梁立振1, *  , 韦江龙
, 韦江龙1 , 胡纯栋1, 2 ]
, 韦江龙|
|


中性束注入是等离子体加热和电流驱动的最有效方法之一。 中性束注入的三个基本过程为: 离子束的产生, 离子束的中性化和中性束的传输, 其中, 离子束的中性化是关键环节之一。 对于EAST-NBI气体中性化室而言, 中性化室内气体靶厚度会直接影响离子束的中性化效率, 而且还会进一步影响到中性束的传输效率。 基于多普勒频移效应, 提出了一种新的诊断气体靶厚度的方法, 并且已经被应用于EASTNBI测试平台上。 该方法主要是基于中性束的束成分随气体靶厚度的演化过程, 利用中性束发射Dα光谱线强度完成计算。 因此, 它被应用于中国科学院等离子体物理研究所EASTNBI装置上。 在中性化室出口处的观测窗口上进行测量, 在束能量为40~65 keV时, 气体靶厚度值为(0.16~0.22)×1016 cm-2, 随着引出束流的变化, 气体靶厚度随之改变。 根据质量守恒定律, 对中性化室内的气体靶厚度进行一个粗略的估算, 估算的结果与测量的结果基本保持一致, 从而证明了该诊断方法的合理性。 综上, 实验结果表明, 该种基于多普勒频移效应的光谱诊断法可以被用于测量中性化室内的气体靶厚度。
Neutral beam injection (NBI) is one of the most effective means of plasma heating and current driving. There are three basic processes in neutral beam injector: generation of ion beam,neutralization of ion beam and transmission of neutral beam, among which neutralization of ion beam is the key link. The gas target thickness in neutralizer directly affects the neutralization process, and further affects neutral beam transmission efficiency.A new diagnostic technique for the determination of gas target thickness, based on the Doppler shift effect, is presented and applied to neutral beam injector operating on Experimental Advanced Superconducting Tokamak (EAST) NBI testbed. The basis of the method is the process of beam component evolution with gas target thickness.The gas target thickness is estimated by the value of Dalpha spectral line intensity. The method is applied to the EAST NBI of Institute of Plasma physics, Chinese Academy of Sciences (ASIPP). Gas target thickness in the range of 0.16~0.22×1016 cm-2 are measured close to the exit of neutralizer,and gas target thickness measured with this novel technique correlate very well with the extracted beam current. According to the law of conservation of mass, a rough calculation of gas target thickness is basically consistent with the calculation of the novel technique, which verifies its correctness. Experimental results show that spectrum method based on the Doppler shift effect can be applied to estimate neutralizer gas target thickness.
Neutral beam injection (NBI) is one of the most important methods for auxiliary heating on magnetic confinement fusion device[1, 2, 3]. For the Experimental Advanced Superconducting Tokamak (EAST), the neutral beam injection system is built based on positive ion sources, the ions are extracted from source and accelerated to reach the required energy. Then they are neutralized by charge exchange process in neutralizer with a gas target, and neutral atoms are injected into plasma in straight lines. Non-neutralized ions are deflected into ion dumps by deflecting magnet[4]. Consequently, the integration of gas density enormous impacts the neutralization process of ion beam in the neutralizer, which is named gas target thickness. According to the relations between the change of beam components and the gas target thickness, if gas target thickness is too thin, there are not enough gas molecules to collide with charged particles, so neutralization efficiency is very low. When gas target thickness increases, neutralization efficiency increase, but the growth rate gradually becomes smaller, and eventually tends to the saturation. In that case, adding gas target thickness has little effect on neutralization efficiency. At the same time, due to insensiblecollisions, beam divergence angle increases obviously, and transmission efficiency of neutral beam decreases. In addition, the redundant target gas also increases vacuum system load and the gas pressure of vacuum chamber, and it further increases reionization loss[5]. So the measurement of gas target thickness is very important for guiding experimental operation.
In this paper, a new diagnostic technique is introduced in detail to measure gas target thickness based on the Doppler Shift Spectroscopy. Firstly, Doppler shifted and unshifted Dalpha spectral lines emitted by the beam particles and the background gas respectively are measured by the Doppler Shift Spectroscopy (DSS) system. And, secondly, the beam component evolution process is analyzed, and then the dependencies between Dalpha spectral line intensity and neutralizer gas target thickness are studied. Lastly, we can estimate the neutralizer gas target thickness by the value of Dalpha spectral line intensity of the background gas.
For neutral beam injector whose working gas is deuterium, the collisions between beam particles and gas target molecules have collision excitation. The Doppler Shift Spectroscopy (DSS) system measures Dalpha spectral lines which are emitted from n=3 to n=2 state of the excited deuterium atoms by collisions of the beam with the background gas[6, 7].
According to Doppler shift effect, when the particles are in motion relative to the observer, the spectral lines emitted by the particles appear shifted in wavelength, called the Doppler shift. We assume that optical frequency of static light source is f0 and θ is the angle of the sightline and direction of movement. c is the speed of light. v is the atom velocity. So the frequency which is received by the observer is as follows
Then we can know the wavelength by f'=c/λ '
Where λ 0 and λ denote the unshifted wavelength and measured wavelength, respectively. So Doppler shifted wavelength in the non-relativistic approximation is given by
Based on the relations between velocity and particle kinetic energy, E is the particle energy and M is the atomic number. E=mν 2/2, the unit of energy is keV,
To deuterium, M=2. Using formula 4, we can calculate beam energy by Gauss function fit spectral lines and the full energy peak frequency shift of the spectrum.
According to evolution process of beam particles[8, 9], each particle fraction can be calculated as a function of gas target thickness with various particle energies. Based on the law of conservation of particle number, for a certain energy and charge state particle, the change rate of particle number with neutralizer gas target thickness is equal to the sum of the number of generated particles and reduced particles. So all sorts of charge state particle composition can be simply expressed as a function of gas target thickness. The evolution equation is described as follows:
Where,
Using the Doppler shift spectrum diagnostic system to collect light signal, the collection optical signals are mainly Dalpha spectral lines which are produced by beam particles and background gas in observed field of lens. Spectral peak area can be approximate expressed with formula (6)
Where
Therefore, beam composition ratio (flux ratio) can be described as followings:
Using the enumeration method to interval values of gas target thickness, the numeric range is from 0.1× 1016 cm-2 to 0.4× 1016 cm-2, which is theoretical value of gas target thickness for positive ion source. According to the beam particles evolution equation, we can calculate the relative composition. Substituting it into formula (11) and find out the corresponding neutral beam component ratio under the gas target thickness. We can calculate the coefficient by formula (7), (8), (9), then substitute it into the background peak area formula (10) and get the calculation value of unshifted background peak under the gas target thickness. Using Gaussian function to fit background peak, and getting the fitting value of background peak. In theory, when the calculation value by the above model is a fair approximationwith the fitting value, the gas target thickness is the real gas target thickness. The concrete calculation flow chart is shown as Fig.1.
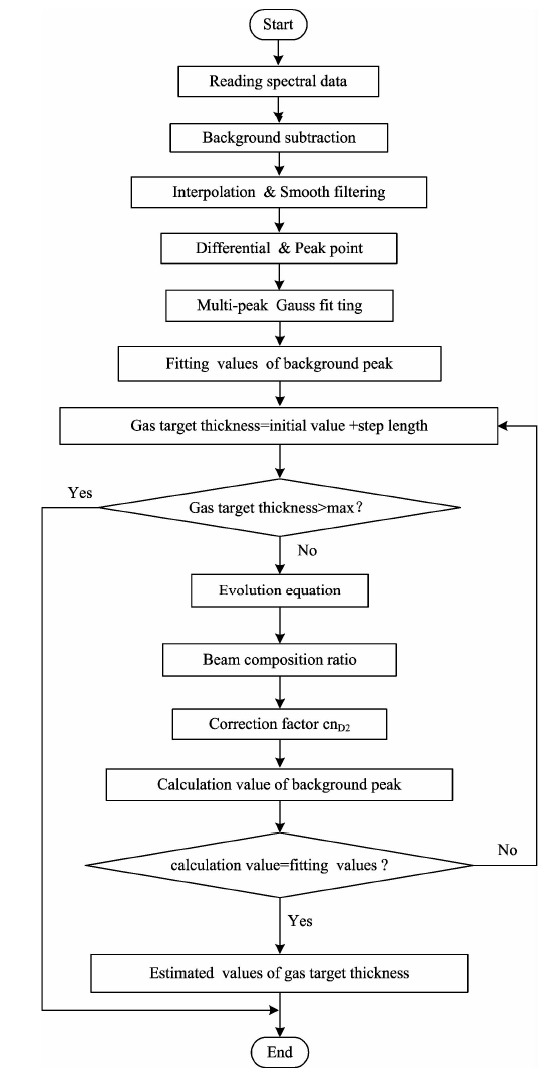 | Fig.1 The calculation flow chart of neutralizer gas target thickness |
Fig.2(a) shows neutral beam injector device schematic diagram on the EAST. The EAST NBI system mainly contains ion source, neutralizer cell, bending magnet, residual ion dump, calorimeter and diagnostic system and so on. Among these, the Doppler shift spectroscopy (DSS) optical system is shown as Fig.2(b), located in the side of the first section of vacuum chamber. The DSS system mainly consists of collimating lens, optical fiber, grating spectrometer, CCD, local control computer andcorresponding hardware system. We have set up a lens to collect Dalpha lines in the horizontal plane. The viewing angle, by definition, is an angle between sightline and the beam axis. The sightline makes an angle of 113° with the beam line near the bending magnet as shown in Fig.2(b). The optical fiber transmits optical signals to a Czerny-Turner spectrometer which equipping a charge coupled device (CCD) camera. The CCD camera converts optical signals to electrical signals. The experimental data are recorded in computer, and finally a software program is used to calculate the corresponding beam parameters. Among them, the model of using convergent lens is Nikor AF-S with the focal length of 50 mm. The fiber diameter is 200 umand numerical aperture is 0.22. The grating spectrometer is Czerny-Turner (C-T) structure and the model is Andor SR-750 spectrometer. The parameters of grating spectrometer are shown as followings: the grating constant is 1 800 g· mm, the focal length is 750 mm, and the resolution is 1.1 nm· mm-1. The experiment has used Andor Newton series CCD to match the grating spectrometer. The model is DU940 withthepixel of 1 024× 256 pixels and the effective resolution of 0.02 nm· pixel-1. It is enough to meet the requirement of experimental measurement of Dalpha spectral lines.
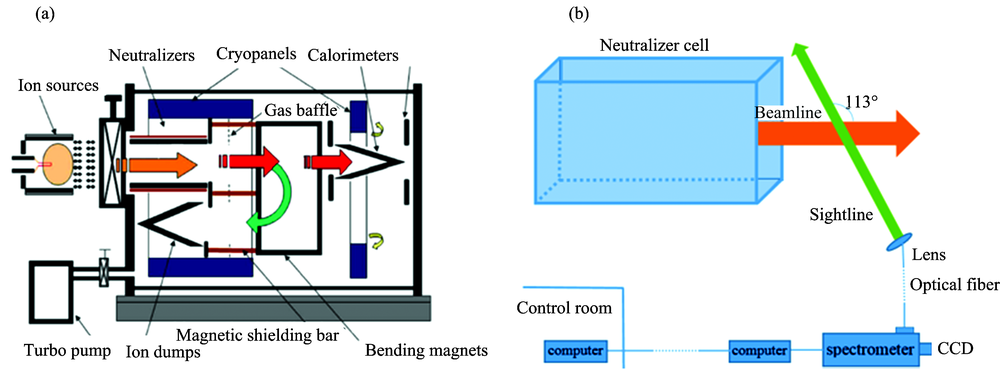 | Fig.2 The sketch of (a) the neutral beam injector for EAST; (b) the DSS optical diagnostic system |
Experiment adopts the Andor Solis software with the interactive real-time control interface. During the experiments, all key detectors acquisition parameters are set to optimize the quality of the signal. According to the Dα line wavelength, the range is set from 642.60 to 669.19 nm. The CCD is cooled to -60 ℃ to improve signal-to-noise ratios. The acquisition mode, trigger mode and readout mode are set to kinetics, external and multi-track, respectively. Then a work station is created to store the spectral data. Finally, we can use the above-mentioned flow chart to calculate the gas target thickness.
A typical Doppler red shift spectrum of Dalpha lines emitted by 58kV neutral beam is shown in Fig.3. The most intense unshifted peak is emitted by background gas, and the wavelength is 656.3 nm. The smallest peak is produced by low energy deuterium atoms which result from the dissociation of D2O+ ions. The three most shifted peaks are emitted by excited deuterium atoms coming from
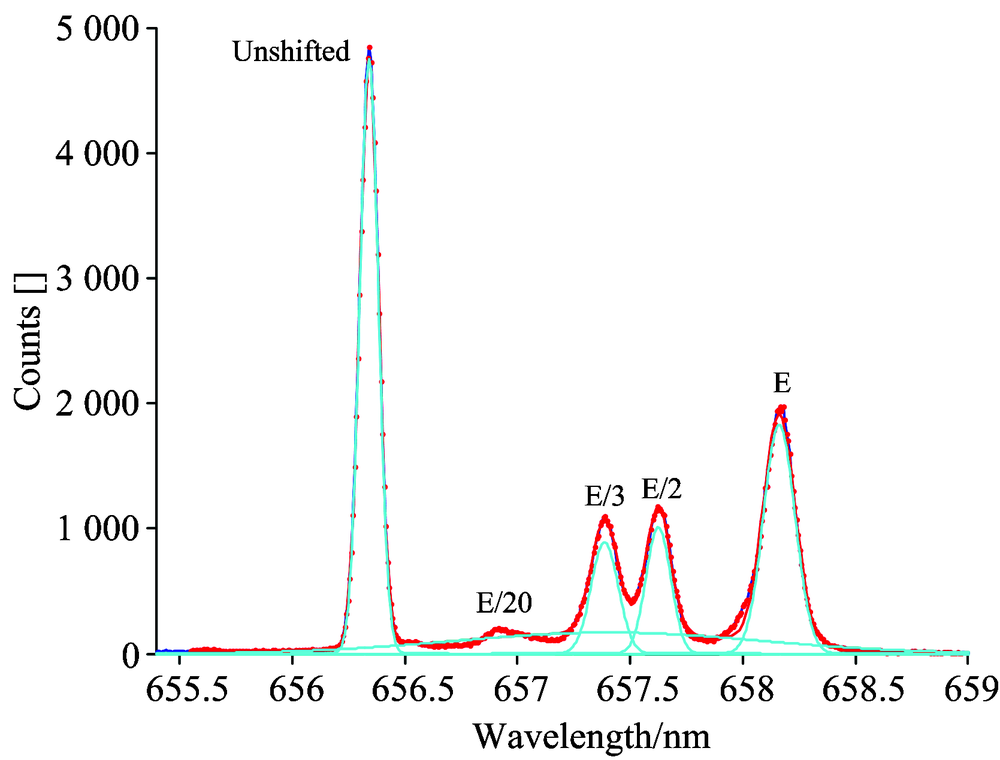 | Fig.3 Discharge spectrum fitting result as extraction voltage is 58 kV |
Table 1 gives the data of estimated gas target thickness in neutral beam injector based on the Doppler effect. When the gas flow rate is 1 400 Pa· l· s-1, if beam current increases, gas target thickness decreases and neutralization efficiency also decreases.
| Table 1 Neutral beam spectrum diagnosis based on the Doppler shift effect |
When only ion source gas flows in, the background gas in the neutralizer comes from the arc chamber. According to the law of conservation of mass, the gas flow includes the particles in the arc chamber, the particles in the neutralizer and the beam current particles. Iu can assume that the particles distribute evenly in the arc chamber and neutralizer, the pressure is about 50∶ 1 of the two, so we can calculate the total number of particles. The calculation results are shown in the last column of table 1 by the formula
For the experiment results which estimated gas target thickness declines, there are possible reasons: (1) the gas flow rate remains unchanged. When beam current increases, unionized residual gas reduces and the gas density decreases in neutralizer; (2) the collisions of gas with energetic particles and secondary electrons will cause gas loss because of charge transfer or ionization in the neutralizer[10]. When beam current increases, the collision time increases and gas loss increases, and gas density decreases; (3) since ion beam has heating effects on gas target in the neutralizer, the increase of beam power will lead to increase of gas target temperature which reduces the gas density[10].
Gas target thickness affects neutralization process of ion beam, so a new diagnostic technique for gas target thickness on neutral beam injector is introduced. The method is based on the beam component evolution process with gas target thickness, and the Doppler spectrum diagnosis system to measure the spectral line. The value of Dalpha spectral line intensity of the background gas to calculate the gas target thickness. It is shown that gas target thickness in the neutralizer correlate well with extracted beam current. Results show that the calculation method above can be used to estimate neutralizer gas target thickness, and studies of the characteristics of gas target thickness can be used to provide guidance for the optimization of experimental parameters.
In actual calculation process of gas target thickness, the calculation value and the fitting value may have the slightest deviation. Mainly in the calculation model of background peak intensity, it ignores the influence of electron impact on spectral lines emission, and when beam energy is larger, this effect cannot be ignored. So the calculation value by the model may be lower than the fitting value.
The authors have declared that no competing interests exist.
| [1] |
|
| [2] |
|
| [3] |
|
| [4] |
|
| [5] |
|
| [6] |
|
| [7] |
|
| [8] |
|
| [9] |
|
| [10] |
|