


基于SPR原理的葡萄糖浓度折射率特性矩阵测量
引用本文
罗伟, 孙凤龙, 刘佳瑞, 侯俊武, 汪本干, 黄小平. 基于SPR原理的葡萄糖浓度折射率特性矩阵测量[J]. 光谱学与光谱分析, 2018,38(6): 1982-1986.
LUO Wei, SUN Feng-long, LIU Jia-rui, HOU Jun-wu, WANG Ben-gan, HUANG Xiao-ping. Matrix Measurement of Glucose Concentration Based on Surface Plasmon Resonance Sensor[J]. Spectroscopy and Spectral Analysis, 2018,38(6): 1982-1986.
Doi:10.3964/j.issn.1000-0593(2018)06-1982-05
Permissions
LUO Wei, SUN Feng-long, LIU Jia-rui, HOU Jun-wu, WANG Ben-gan, HUANG Xiao-ping. Matrix Measurement of Glucose Concentration Based on Surface Plasmon Resonance Sensor[J]. Spectroscopy and Spectral Analysis, 2018,38(6): 1982-1986.
Doi:10.3964/j.issn.1000-0593(2018)06-1982-05
Copyright©2018, 《光谱学与光谱分析》期刊社
《光谱学与光谱分析》期刊社 所有
基于SPR原理的葡萄糖浓度折射率特性矩阵测量
摘要
设计了一种简洁的角度扫描棱镜SPR传感系统, 反射式平行光路设计简化了系统结构。 其主要包括光源及光强感知、 平行光路结构、 电机与温度控制模块构成。 通过单电机扫描入射角与温度控制, 实现了对葡萄糖的折射率浓度特性有效测量。 理论分析存在交叉灵敏度矩阵可同时度量温度及葡萄糖质量浓度共振角度的变化规律, 且实验得其灵敏矩阵。 为区分温度和质量浓度对共振角度的影响以及校正SPR温度漂移提供参考。
关键词:
温度; 折射率; 矩阵测量; 平行光路; 表面等离子共振
中图分类号:O657.3
文献标志码:A
Matrix Measurement of Glucose Concentration Based on Surface Plasmon Resonance Sensor
Abstract
An angle scanning prism-based SPR sensor system is proposed in this paper. With the structure of reflex parallel light path, the system has been simplified, which mainly consists of light source, CCD sensor, parallel light path structure, rotation and temperature control module. With the motor scanning incidence angle and temperature control, an effective measurement of glucose refractive index (RI) mass concentration property can be achieved. Moreover, a theoretical model has been established to explain the existence of a sensitivity matrix, which enables both the RI and temperature to be measured and obtained from proof-of-concept experiment. This approach paves a way for conventional SPR-based sensors to discriminate between RI-induced and temperature-induced SPR changes and provides a reference for the correction of temperature interference.
Keyword:
Temperature; RI; Matrix measurement; Parallel light path; Surface Plasmon Resonance
Introduction
Surface Plasmon Resonance (SPR) sensors have been widely used in biochemistry, food safety, environmental monitoring and other fields, because of the advantages of no marking, fast analysis, high sensitivity and simple pretreatment[1, 2]. The SPR effect is a physical optical phenomenon that occurs at the interface between a dielectric and a thin metal layer. Under the condition that a polarized incident light is totally reflected by the interface of metal and coupling material, the light energy penetrates through the metal in the form of evanescent wave and resonates with the surface plasmon wave (SPW) of the metal/dielectric, resulting in a reduction of the reflected light energy (Fig.1). Due to the different refractive indexs (RI) of the dielectric that forms different SPW and the horizontal wave vector of the incident light, whose resonance provides a way to measure the RI of the material. From the coupling mode, SPR sensor can be divided into prism-based, grating and waveguide coupling. Prism-based SPR has been widely used in scientific research and commercial instrument for its advantages of simple, easy construction and high detection accuracy[3, 4, 5]. Generally, the SPR system is a large-scale laboratory instrument and extremely susceptible to temperature interference[6, 7, 8]. Therefore, it is of great significance to explore the development of a simplified structure SPR sensor and suppress the temperature interference.
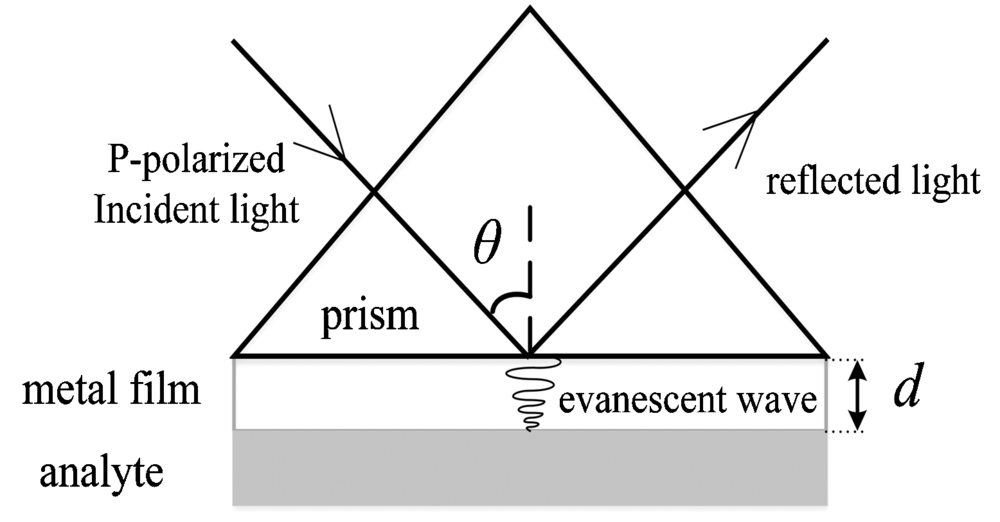 | Fig.1 Surface plasmon resonance sensor schematic |
In this paper, based on the principle of prism-based SPR, a parallel optical path SPR detection system is established. The system consists of polarized light source, parallel light path structure, rotation and CCD optical sensing module. In addition, the structure is easy to be constructed. The measurement of temperature and mass concentration property of the glucose solution shows that the detection system has good repeatability and stability. Moreover, a sensitivity matrix measurement method is obtained from theoretical analysis and gets its values from experiment.
1 SPR Sensor System Design
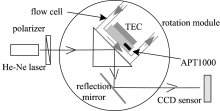
SPR sensor system mainly consists of light source, CCD sensor, parallel light path structure and a rotation system. The light source and CCD module are used to realize the output of polarized light and its intensity sensing. The optical path structure uses a silicon reflex mirror being placed parallelly with the bevel surface of the prism. Therefore, the output light is parallel to the incident. The entire parallel light path structure is set on the holey round platform rotating with a stepping motor. The whole system is controlled with Labview software showing in Figure 2.
 | Fig.2 Parallel optical path surface plasmon resonance system |
1.1 Polarized Light Source and CCD Sensor Module
Polarized light source (Hangzhou SPL Photonics Co., Ltd, wavelength 632.8 nm, partial ratio 500∶ 1, output power ≥ 4 mW, power stability ≤ 3%, beam divergence≤ 1.3 mrad); polarizer GCL-05003; Light intensity is detected by CCD sensor with TCD1208 (Toshiba, Japan, pixel spacing 14um, spectral response range of 300~1 000 nm), which has an effective sensing length of 28.672mm. With a USB interface to supply energy and transfer data, it simplifies the optical design. However, although TCD1208 has high accuracy, it is easily saturated. A polarizer is added in the light path to adjust the light intensity as well as to ensure thatthe reflected light intensity is in the linear detecting range.
1.2 Parallel Light Path Structure and Angle Rotation System
With the parallel light path design, the incident angle is changed under the condition that the output/incident lights are parallel to each other. A silicon reflex mirror is used to change the optical path. With the coated reflex film on the surface of the mirror, little light energy is lost during the reflection. The prism is made of K9 glass (Spectral analysis optics: Refractive index: 1.516 8, Abbe number: 63.96, Poisson ratio: 0.21).
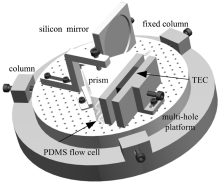
In order to ensure the parallelism of the output light and the incident, the optical path should pass through the geometric center of the mirror and sensing metal film. With a holey platform to place the whole structure, it is suitable for the preliminary adjustment of the optical pathwhich is adjusted precisely with the screws of the columns (figure 3). With a stepping motor, the incident angle shifts with the accuracy of one-tenth thousandth degree.
 | Fig.3 Adjustable parallel light path system |
To study the temperature property, the temperature is controlled with a semiconductor TEC chip. With an APT platinum resistance temperature sensor, a closed-loop temperature control system is constructed.
2 Experiment and result
2.1 Experimental steps
First, the bevel surface of K9 prism is cleaned with ultrapure water and dry with nitrogen. Then, the gold sensor film is coupled to the surface with cedar oil (RI, 1.515 2~1.517 1). PDMS flow cell and TEC are pressed to the surface of gold film, a sealed liquid detecting channel is formed. Analytes can be injected into the flow cell with a pump. When changing the incident angle and monitoring the reflectance intensity with CCD sensor, resonance curves can be obtained.
2.2 Measurement and Analysis
2.2.1 Measurement of glucose mass concentration
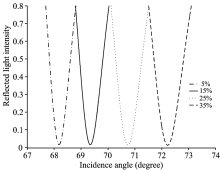
SPR resonance curves are measured with different mass concentrations from 5% to 40%. Each sample is separated with air. And the temperature is controlled at 20 ℃, as is shown in Fig.4.
 | Fig.4 Resonance curves with different mass concentrations |
It can be seen that, the resonance curves shift to the right with the increase of concentration, and the resonance angles increase. Detail analysis shows that there is a linear relationship between the resonance angle and the mass, and the fitting equation can be obtained from Fig.5 as:
x represents the mass percentage in units of %.
 | Fig.5 Fitting curve between the resonance and mass concentration |
2.2.2 The analysis of temperature dependence RI
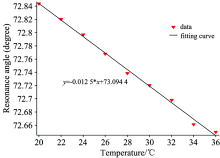
Temperature change affects the SPR system, and the resonance angle. With the 40% glucose solution being injected, the temperature is changed and the resonance curve is detected to measure the resonance angle, as is shown in Fig.6. A linear temperature dependence resonance can be obtained:
y is the resonance angle, x represents the temperature in units of ℃.
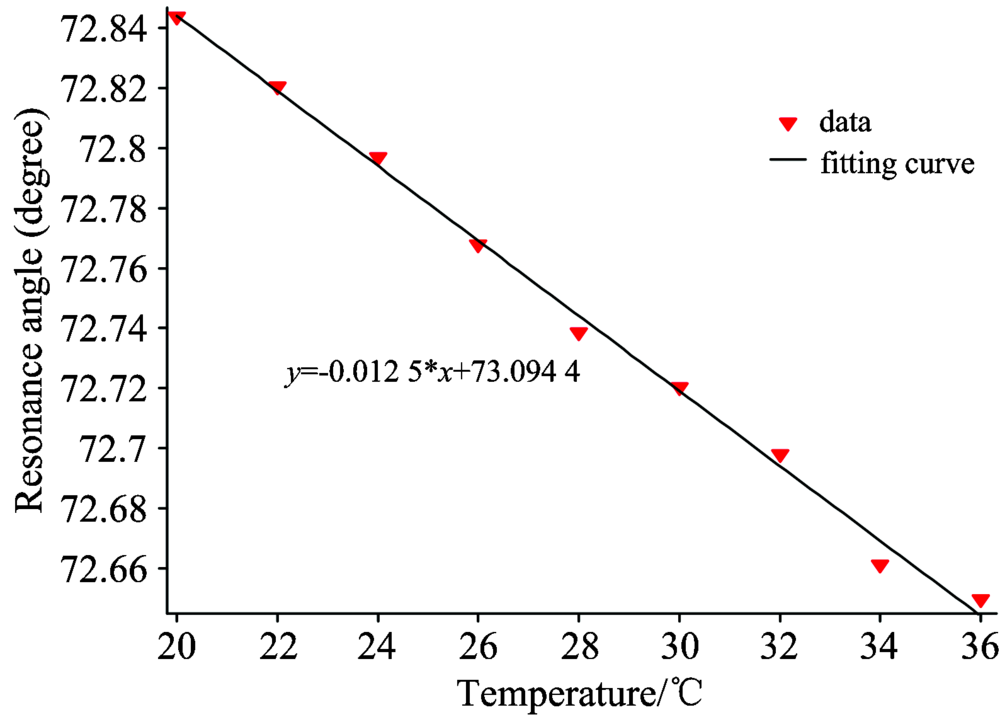 | Fig.6 Fitting curve between the resonance and temperature |
2.3 Theoretical Simulation of Temperature Characteristics of SPR Sensing System
The temperature influence on the SPR sensor system is complex. According to the Drude model, the frequency-dependent dielectric function of the sensor film can be represented as:
ε is the metal dielectric permittivity. nr and ni are the real and imaginary parts, respectively. As a result of the volumetric effects, plasma frequency ω p can be calculated as
Where γ , T0 and ω p0 are the metal expansion coefficient, reference temperature, and the plasma frequency at the reference temperature.
ω c is called the collision frequency and can be affected by temperature variation in two aspects: phonon-electron scattering (ω cp) and electro-electron scattering (ω ce)[9, 10].
Here TD is Debye temperature, and ω 0 is a constant related to the electric conductivity.
Where Γ , Δ , ћ , EF and kB are all constants, representing the average over the Fermi surface of scattering probability, the fractional umklapp scattering, the Planck’ s constant, the Fermi energy and the Boltzmann constant, respectively.
The metal layer thickness d is also affected by temperature[11].
Here μ is Poisson’ s number of the film material. d0 is the thickness at the reference temperature T0, taking 50 nm at 300 K in our calculation.
According to the Fresnel equations and Maxwell theory, the reflectance R of the prism-based SPR sensor can be expressed as:
rij is the reflective coefficient of p-polarized light at the boundary between media i and j.
Detail scenarios for the dependence of SPR resonance shift on the simultaneous variation of RI and temperature are shown in Fig.7.
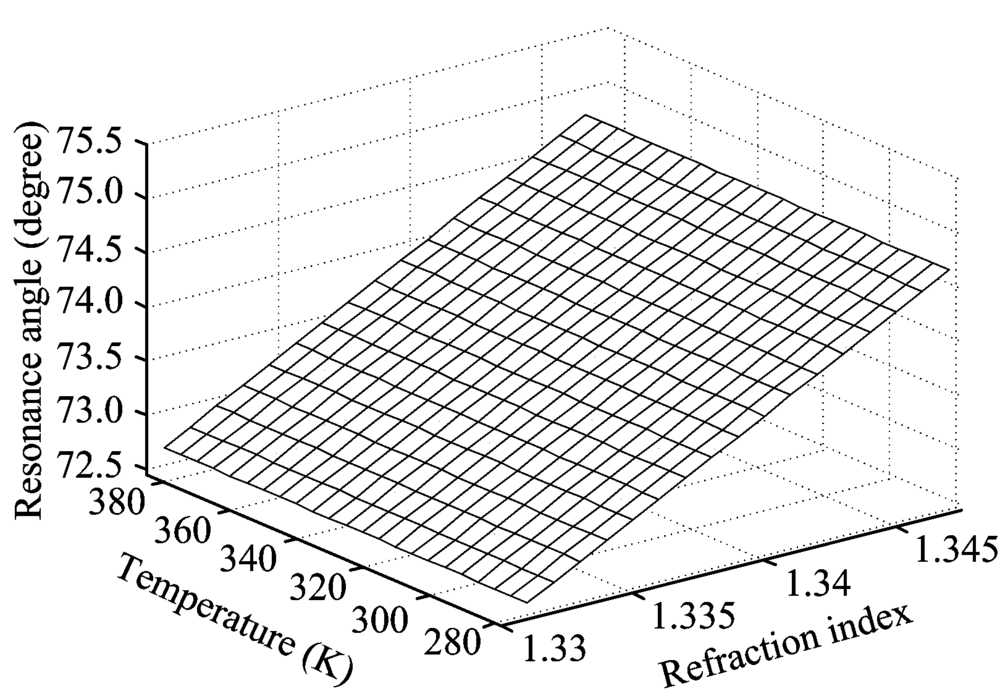 | Fig.7 SPR resonance shift versus the RI and temperature |
It can be seen that, the line surface of the relationships governing the resonance angle changes versus RI vasiation and temperature change is almost an inclined plane, which reveals that the resonance angle changes linearly with both the temperature and the RI. Fitting lines for resonance angle versus RI at different temperatures and its linear coefficients are calculated theoretically, as is shown in Fig.8 and Fig.9, respectively.
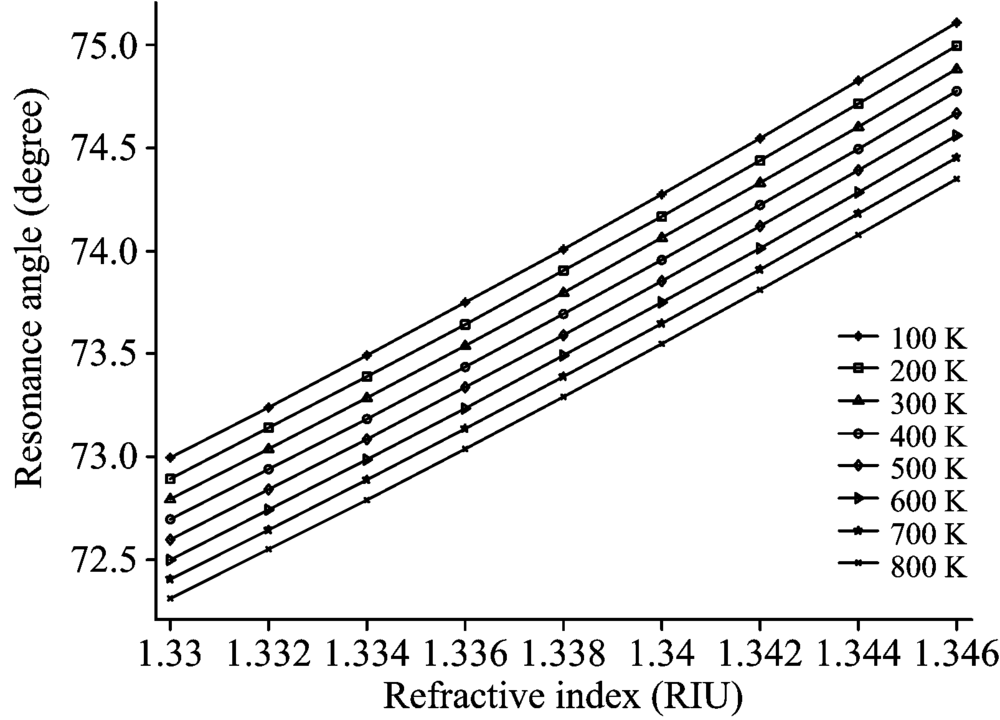 | Fig.8 Fitting lines for the resonance angle versus RI at different temperatures (RI range: 1.33~1.346) |
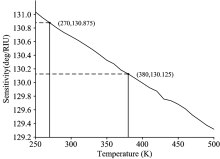
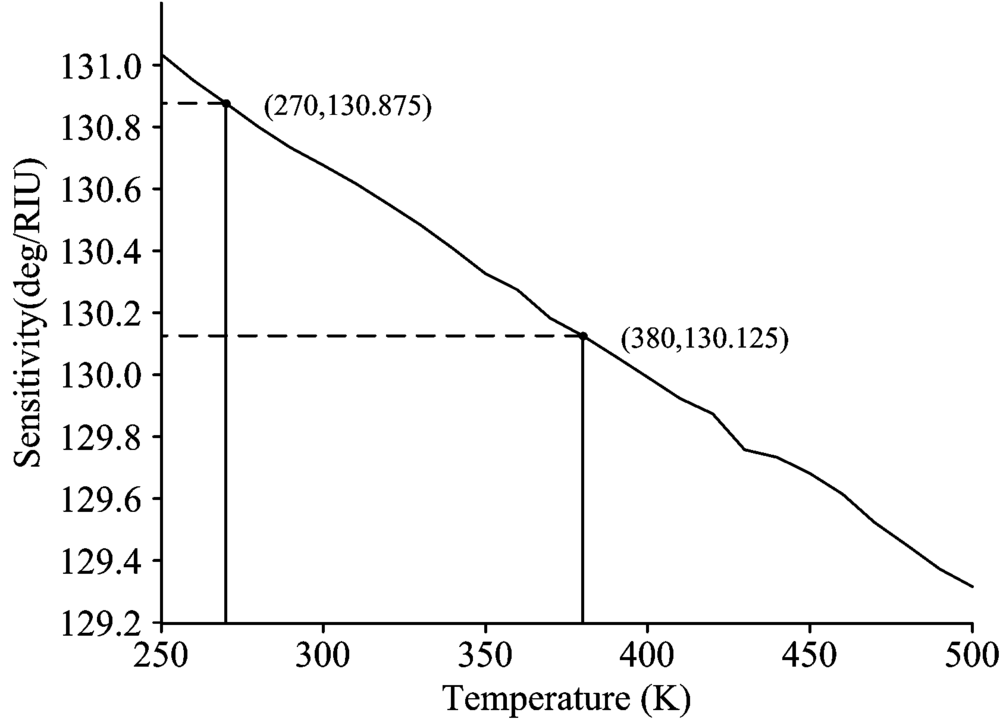 | Fig.9 The variation of SPR resonance sensitivity with RI at different temperatures (RI range: 1.33~1.346) |
From the figures, it is observed that, with the temperature shift from 270 to 380 K, the little change of linear coefficient between the resonance and RI is 0.75/130.875. Further calculation reveals the resonance angle changes linearly with temperature at different RIs, and the linear coefficients also change very small. Then, when ignoring the tiny changes of the line-fitting sensitivities in a detecting range, the dependences of SPR resonance shift on RI and temperature are quite linear
and independent from each other. Therefore, a sensitivity matrix M can be constructed to measure the resonance shift versus the simultaneous changes of RI and temperature[12, 13].
Where Δ A, Δ n and Δ T represent resonance shift, RI change and temperature variation. Note that glucose mass concentration corresponds linearly with its RI. Therefore, when ignoring the tiny changes in the linear coefficients, the resonance angle shift can be expressed as[14]:
Δ Z and Δ T represent the mass concentration and temperature variation in units of % and ℃, respectively. This approach is very accurate when the dependences of SPR resonance on both temperature and RI are linear and the changes of linear coefficients are small.
3 Conclusion
In this paper, an easy constructed prism-based SPR sensor system is designed with a parallel light path. The light path is revised with a silicon reflex mirror and precisely adjusted with the multi-hole platform and column screw. A proof-of-concept experiment has been developed to detect the mass concentration of glucose. Theoretical analysis of the dependence of the resonance on RI and temperature has been taken out to provide a matrix measurement method. In conclusion, this approach provides a way to detect the resonance and may lead to better design and fabrication of SPR sensor.
Thanks to Li Hairong from Nanjing Tech University.
The authors have declared that no competing interests exist.
参考文献
| [1] |
|
| [2] |
|
| [3] |
|
| [4] |
|
| [5] |
|
| [6] |
|
| [7] |
|
| [8] |
|
| [9] |
|
| [10] |
|
| [11] |
|
| [12] |
|
| [13] |
|
| [14] |
|