


基于LabPQR降维的多色打印机光谱特征化模型研究
引用本文
姜中敏, 孔玲君, 聂鹏, 于海琦. 基于LabPQR降维的多色打印机光谱特征化模型研究[J]. 光谱学与光谱分析, 2018,38(6): 1975-1981.
JIANG Zhong-min, KONG Ling-jun, NIE Peng, YU Hai-qi. Study on the Spectral Characterization Model of Multi-Color Printer Based on LabPQR Dimension Reduction[J]. Spectroscopy and Spectral Analysis, 2018,38(6): 1975-1981.
Doi:10.3964/j.issn.1000-0593(2018)06-1975-07
Permissions
JIANG Zhong-min, KONG Ling-jun, NIE Peng, YU Hai-qi. Study on the Spectral Characterization Model of Multi-Color Printer Based on LabPQR Dimension Reduction[J]. Spectroscopy and Spectral Analysis, 2018,38(6): 1975-1981.
Doi:10.3964/j.issn.1000-0593(2018)06-1975-07
Copyright©2018, 《光谱学与光谱分析》期刊社
《光谱学与光谱分析》期刊社 所有
基于LabPQR降维的多色打印机光谱特征化模型研究
摘要
研究多色打印机的光谱特征化, 提出了一种基于降维的光谱特征化模型, 保证了多色打印机颜色转换的精度, 同时也提高了特征化的运行效率。 该模型结合颜色分区理论和LabPQR非线性降维方法, 首先将高维光谱数据降低至LabPQR六维空间中, 然后通过胞元搜索算法查找目标颜色所属的胞元空间, 最后利用反向四面体插值算法对目标的LabPQR值进行计算, 得到打印机最终的通道信号输出值。 检测颜色样本的实验数据表明, 正向模型和反向模型的平均色差达到0.714和1.016 NBS,模型的运行时间为2.03和9.05 s。 新算法能够实现多色打印机光谱数据与通道信号值间的准确转换。
关键词:
光谱表征; 色域划分; 查找表; LabPQR降维
中图分类号:O657.3
文献标志码:A
Study on the Spectral Characterization Model of Multi-Color Printer Based on LabPQR Dimension Reduction
Abstract
A spectral characterization model based on dimension reduction is proposed to guarantee the precision of color conversion of the multi-color printer and improve its operation efficiency. Color space division theory and LabPQR nonlinear dimensionality reduction method are adopted in the new model. Moreover, the forward model is created based on Lookup Table, and the backward model is created through cell search algorithm and inverse tetrahedral interpolation algorithm. Firstly, the high dimensional spectral reflectance is reduced to six dimensional space values (LabPQR). Then the cell space of the target color is searched using cell search algorithm. Finally, the LabPQR values of the target color are calculated with the inverse tetrahedral interpolation algorithm, and the output values of the multi-color printer channel signals are obtained. The experimental data of the tested color samples shows that the average color difference of the forward model and the backward model are 0.714 NBS and 1.016 NBS respectively, and the corresponding running time of the models are 2.03 and 9.05 s. New algorithm could realize the accurate inter-conversion between the spectral reflectance of a multi-color printer and its channel-signal values.
Keyword:
Spectral characterization; Color gamut subdivision; Lookup table; LabPQR dimensionality reduction
Introduction
High accuracy output of digital printer is paid great attention to with the development of color printing technology. The high-efficiency of characterization model is essential to avoid color inconsistency when colors convert among different devices. The spectral reflectance defined as an object “ fingerprinting” accurately carries the fundamental color information. Compared with chromaticity, the complete spectral information can effectively represent the color appearance. Therefore, there are more and more researchers studying the characterization model of the multi-color printer from the perspective of spectral. Printer characterization with spectral reflectance is to establish the interconversion between the printer channel signal values and the spectral reflectance of a target color.
According to Glassman color mixing law and ideal dot area distribution, classical Neugebauer model was proposed by H.E.J.Neugebauer in 1937. Neugebauer model is a systematic characterization model of color printer, which is widely used in printer color prediction[3]. As the prediction accuracy of classical Neugebauer model can’ t satisfied the requirement of printer characterization, Yule and Nielsen proposed a modified model (Yule-Nielson Spectral Neugebauer, YNSN) based on infiltration and scattering characteristics of substrate, which improved the accuracy of color prediction obviously[4]. Urban and Grigat[5, 6, 7] proposed an inverse acquisition algorithm of YNSN named UG algorithm based on linear regression iterative algorithm, which provided a new feasible method for inverse acquisition of YNSN, but the accuracy and efficiency were still not high enough. Wang and Zeng[8] proposed a method to create the color conversion model in the subspaces of a color gamut respectively, which provided an idea to achieve efficient spectral characterization model. Guo[9] proposed a cell spectral Neugebauer model, which divided the color space of a four color printer evenly according to the channel signal values, and then the cell spectral Neugebauer model was created via vertex data of the target space. Though the cell searching method using the hypothetical center of a cell space can improve the operation efficiency of characterization, it also increases the error rate of cell searching. Zhang[10] proposed a cell Yule-Nielson Spectral Neugebauer model based on Guo’ s method and UG algorithm, which had high conversion accuracy, but was unsuitable for color space conversion with high-dimensional spectral data due to its complex algorithm and long operation time.
Aiming at improving the operation efficiency and conversion accuracy of the spectral characterization model of multi-color printer, a new model for multi-color printer based on LabPQR nonlinear spectral dimension reduction and cell searching is proposed in the paper. The results show that it is a model with high precision, high efficiency and optimized storage space.
1 Spectral characterization model design for multi-color printer
Spectral characterization model for a multi-color printer includes forward spectral characterization model and backward spectral characterization model.
Forward spectral characterization model aims to achieve the transformation from printer channel signal values to spectral reflectance. Look Up Table(LUT) is a common model with high precision and efficiency. Here, LUT combined with color space division method is chosen to achieve forward spectral characterization model based on LabPQR spectral dimension reduction.
Backward spectral characterization model expresses the conversion from spectral reflectance to printer channel signal values, with large calculation quantity, low efficiency and high transformation difficulty. Combined with dimension reduction, a new model is proposed in the paper. This model creates a “ transfer station” — LabPQR middle color space, the spectral reflectance are converted to LabPQR firstly, and then to printer channel signal values.
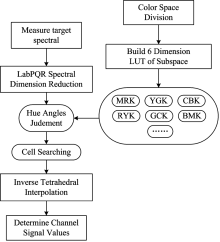
Design ideas of the new backward spectral characterization model is shown as follows. Firstly, we reduce the spectral reflectance of the target color to LabPQR color space values, and determine the three-primary color subspace that the target color located according to its hue angle. Secondly, we find out the possible cubic spaces that the target color located by cell searching in the color subspace. Thirdly, we calculate the channel signal values by inverse tetrahedral interpolation in each possible cubic space. Lastly, the channel signal values of the target color is determined based on minimum color difference. Flow chart of backward spectral characterization model based on LabPQR dimension reduction is shown in figure 1.
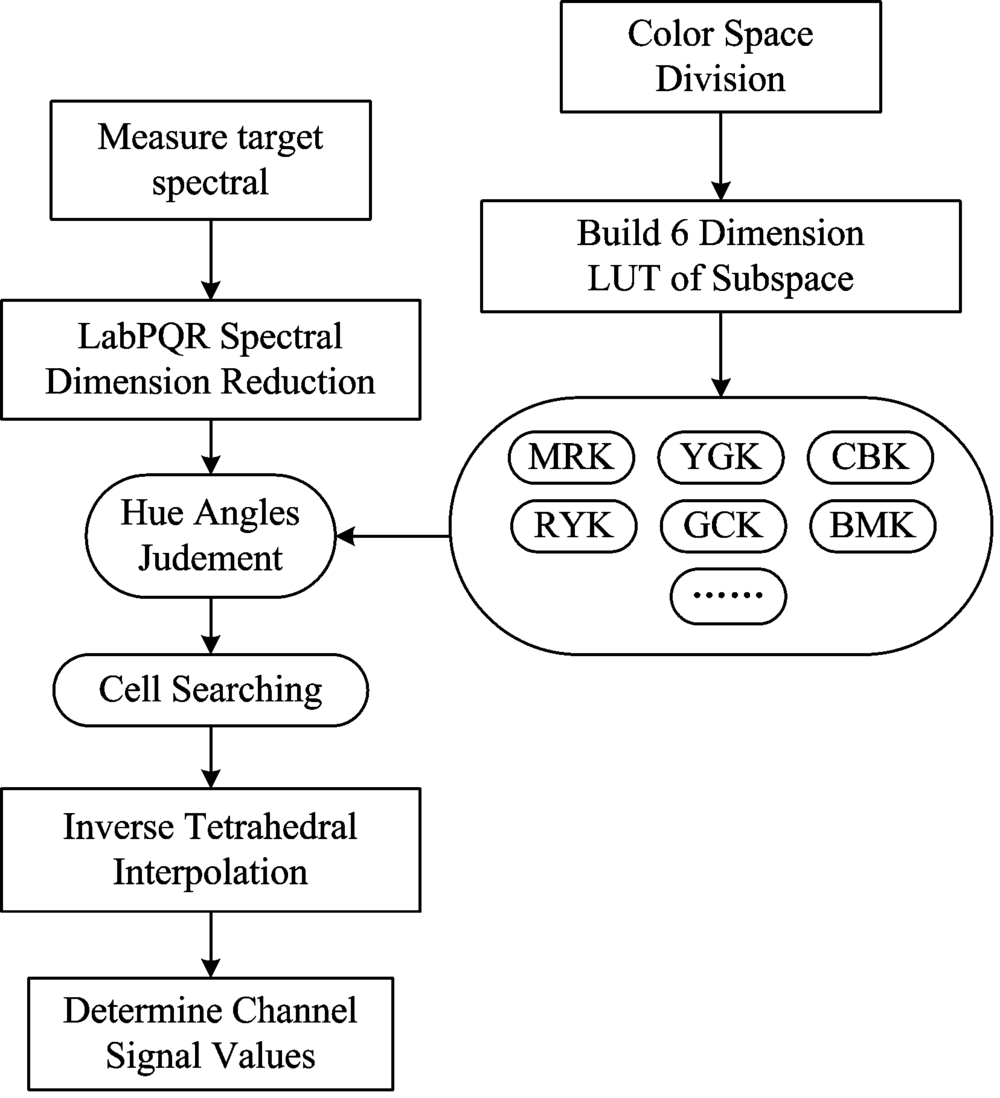 | Fig.1 Schematic diagram of the reverse model of multi-color spectral characterization based on LabPQR dimension reduction |
2 Theory of LabPQR nonlinear dimensionality reduction
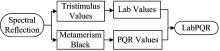
In 2006, Rosen proposed a method named LabPQR nonlinear dimensionality reduction for color matching to reduce the high dimensionality of spectral data to six dimensionality, which can reduce data storage efficiently and improve computational efficiency[12]. The LabPQR space is divided into two “ three dimensions” . The first three dimensions are CIEL* a* b* values under a specific condition, and the second three dimensions are spectral reconstruction dimensions (PQR). The PQR coordinates represent the spectral difference between the original spectral reflectance and the reconstructed spectral reflectance. Schematic diagram of LabPQR dimensionality reduction is shown in Figure 2.
 | Fig.2 Schematic diagram of LabPQR dimensionality reduction |
The targeted PQR components are calculated by regularized tristimulus values. Regularized tristimulus values C of random spectral reflection s(λ ) under a specific illuminant E(λ ) and color matching function of standard observers AT=[
Where normalization coefficient k=100/AT Eones(1), ones (1) is a column vector of 1, while [
Spectral reflectance S can be expressed as formula 2 by the given regularized tristimulus values C,
Here, S is the m by n spectral data matrix, m is the amount of spectral data, n is the dimension of every spectral reflectance; C is the matrix with the regularized tristimulus values; G is the 3 by m transformation matrix, which can be obtained by solving pseudoinverse matrix of matrix C.
The same three color stimulus will correspond to a number of different spectral reflectance due to metamerism. There is a spectral difference between spectral reflectance obtained by pseudoinverse matrix of matrix C and the original spectral reflectance. This spectral difference is expressed as
Spectral reflectance estimated by error correction can approximate original spectral reflectance. The PQR components can be derived from the first three feature vectors of principal component analysis (PCA) on spectral differences. It can be expressed as
where H=
3 Theory of Spectral Characterization
The process of spectral characterization includes multi-color printer gamut division, creating LUT, cell searching and inverse tetrahedral interpolation.
3.1 Multi-color printer gamut division
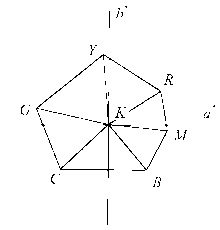
According to color space division theory, multi-color printer gamut can be divided into several subspaces bounded by surface of hue angles. Take the CMYKRGB seven colors printer as an example, the printer color gamut can be divided into six subspaces as MRK, RYK, YGK, GCK, CBK and BMK, which are shown in Figure 3.
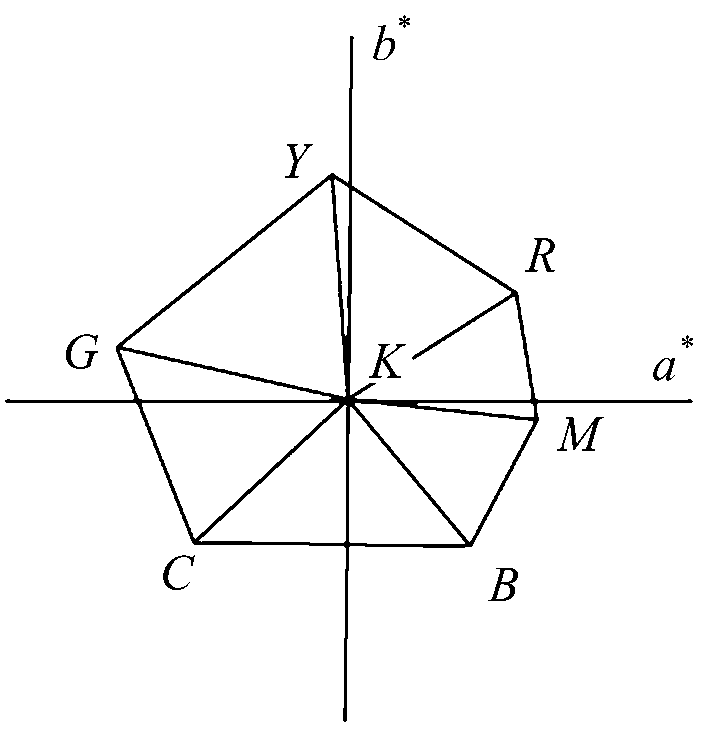 | Fig.3 Schematic diagram of CMYKRGB subspaces |
3.2 Creating LUT
Creating LUT is the prerequisite for color space conversion. A LUT is essential to store LabPQR data for finding out the cell to which a target color belongs. The LUTs are created in each subspace with three primary colors after the multi-color gamut is divided into several subspaces. The steps are as follows: Firstly, sample sets for each subspace with the color coordinate vary from 0 to 100 in N steps are printed, N can be 10 or 5, etc. Secondly, spectral reflectance of the sample sets is measured. Lastly, spectral reflectance to LabPQR space values by nonlinear dimension reduction is transformed. After that, a group of LUTs containing the channel signals and the corresponding LabPQR data are created.
3.3 Pre-determine the position of target color based on cell searching algorithm
Cell cubic subspaces of a target color can be determined by cell searching algorithm after creating LUTs. Then the channel signal values can be calculated by inverse tetrahedron interpolation in the cell subspace. Take the MRK subspace as example, algorithm flow of cell searching is as follows.
(1) Divide the MRK color gamut into n× n× n cells and store uhe LUT data into each cell.
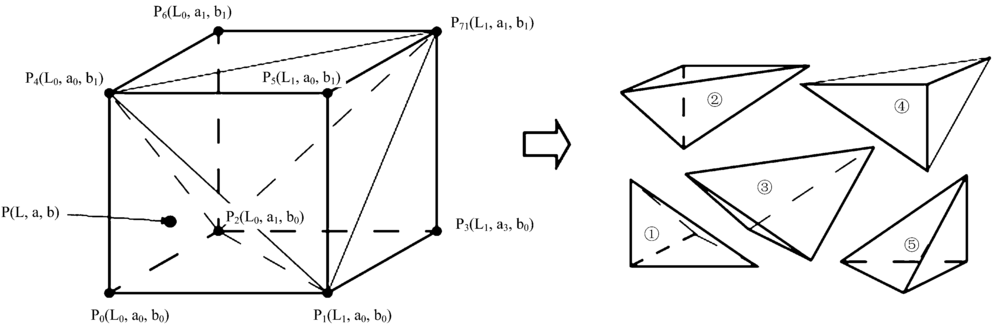 | Fig.4 Cube space is divided into five tetrahedron spaces |
(2) Calculate hypothesis center data of a cell, the LabPQR data of the center can be calculated by averaging cubic peak data, which is shown in formula (6).
(3) Calculate color difference between the target spectral reflectance and the spectral reflectance of the hypothesis center. Selecting the first I cells as preselected cubic set of target color according to color difference that sorted by ascends.
3.4 Calculate the channel signal values based on inverse tetrahedron interpolation
LabPQR values can be converted into printer channel signal values by inverse tetrahedron interpolation after finding out the cell cubic subspace that the target color located in. The channel signal values of a target color can be obtained by interpolation of LabPQR values of the hypothesis center quickly after 8 peak data and LabPQR data of the cell cubic are calculated and stored. Take the MRK subspace as example, the computation principle is as follows:
(1)Record LabPQR values and MRK values of the eight peaks in the cubic space, then divide the cubic into five tetrahedrons.
(2) Normalize CIEL* a* b* values of the targets using formula (7) in the five tetrahedrons and get the coordinate values of the targets in CIELAB color space, and then estimate the tetrahedron that the target color located using relation expression in table 1.
(L0, a0, b0), (L1, a1, b1), (L2, a2, b2), (L3, a3, b3) are the CIEL* a* b* values of four peaks of P0, P1, P2, P3, and (L, a, b) are the CIE L* a* b* values of target P.
| Table 1 Tetrahedron space for locating interpolation point |
(3) Compare the color difference and spectral error between the calculated values and target values, and then calculate MRK values of the target P according to formula (8).
Here, Λ =
(Mi, Ri, Ki) in formula (8) and (Li, ai, bI, Pi, Qi, Ri) in formula (9) are MRK values and LabPQR values respectively.
3.5 Determine the channel signal values of the target color based on minimum color difference
Take the MRK subspace as an example too. Firstly, the corresponding LabPQR values of the predicted MRK values by LUT interpolation for the I pre-selected cells are calculated. Secondly, the spectral reflectance by inverse process of nonlinear dimension reduction is calculated. Thirdly, color difference between the calculated spectral reflectance and the target spectral reflectance for the I pre-selected cells are calculated. Lastly, the MRK values of the cell cubic with the minimum color difference as the predicted values are selectd.
4 Experiment and results analysis
4.1 Creating color characterization model of a multi-color printer
In the experiment, HP Designjet Z3200 7-color inkjet printer is chosen as the multi-color printer, and EFI Fiery XF color management software is used to normalize the ink amount values. All sample sets are printed under the normalization workflow. X-rite il IO spectrophotometer is used for color measurement. In order to create the spectral characterization model of the printer, 1296 color patches sampled from six color subspaces of MRK, RYK, YGK, GCK, CBK and BMK, with six steps of 0%, 20%, 40%, 60%, 80% and 100% in each primary color (here, N=5), are printed and used as training samples.
The spectral characterization model of the printer including forward model and backward model are created using the method proposed in the paper. To achieve accurate calculation, here I is equal to 9, which means that the cells have the first nine minimum color difference are chosen as the primary cubic set.
4.2 Evaluation and analysis of the new model
The tested sample set consists of 750 color patches, sampled with five steps of 0%, 25%, 50%, 75%, 100% in each primary color, are printed and their spectral reflectance are measured under the same printing condition of the training sample set.
YNSN model in Literature[15] is chosen to be compared with the new model proposed in the paper. CIEDE1976 is chosen as an evaluation index to calculate the color difference between the measured spectral reflectance and the predicted spectral reflectance.
(1) Comparison and analysis of forward model.
The spectral reflectance of the 750 color patches are predicted with the forward model of the new model and YNSN model separately, and then the color differences between the predicted spectral reflectance and the measured spectral reflectance are computed. The cumulative relative frequency curves of color difference are shown in figure 5.
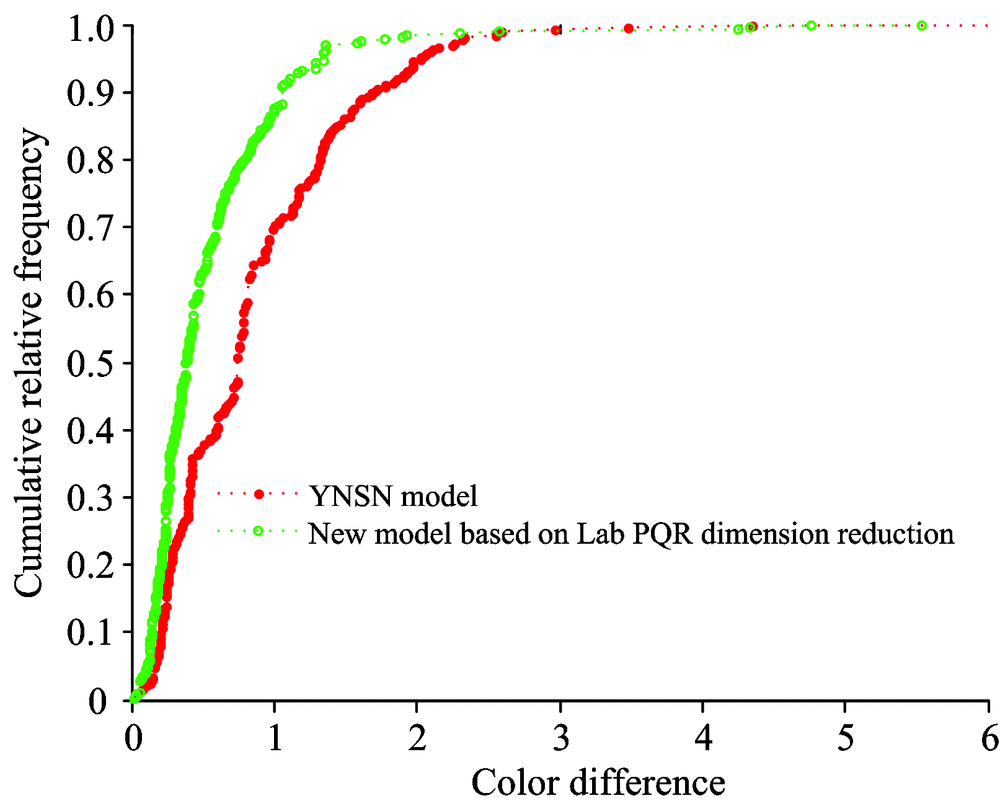 | Fig.5 The cumulative relative frequency of color difference in forward model |
Comparing the color difference of two models in figure 5, the color difference less than 1.0 in the new model accounts for 88%, while the color difference less than 1.0 in YNSN model accounts for 70%. The mean color differences of new model and YNSN model are 0.714 NBS and 0.886 NBS respectively. The results show that the forward model based on LabPQR dimension reduction has better precision. Furthermore, the running time of new model and YNSN model are 2.03 and 2.17 s respectively, which shows that the new forward model based on LabPQR dimension reduction has higher operation efficiency compared with YNSN model.
(2) Comparison and analysis of backward model
Based on the measured spectral reflectance of the 750 tested samples, their channel signal values are calculated using backward model of the new model and YNSN model separately. Then two new sets of 750 color patches with the calculated channel signal values are printed and spectral measured. The color difference between the measured spectral reflectance of the color patches in the new set and the original spectral reflectance of the 750 tested samples is calculated, the cumulative relative frequency curves of the color difference are shown in figure 6.
 | Fig.6 The cumulative relative frequency of color difference in backward model |
Comparing the color difference of two models in figure 6, the color difference less than 1.0 in the new model accounts for 78% , while the color difference less than 1.0 in YNSN model only accounts for 56%. The mean color differences of new model and YNSN model are 1.016 NBS and 1.263 NBS respectively, which shows that backward model based on LabPQR dimension reduction has more powerful high-fidelity reproduction ability and better precision.
The maximum color difference and the mean color difference of two models of six different subspace are shown in table 2. It illustrates that the backward model based on LabPQR dimension reduction has better precision in six subspaces. Mean color differences in GCK, YGK and MRK are less than 1. Mean color differences in BCK and BMK are approximate to 1. Max and mean color difference in RYK is a little higher than that in other subspaces, which maybe due to the larger color gamut of YRK compared to the others and less training samples in unit volume. Compared with YNSN model, mean color difference of the new backward model based on LabPQR dimension reduction is better in the subspace of GCK, YGK, RYK, MRK and BMK., the max color differences of other five subspace except RYK are less than 3.0. Those results show that the backward model based on LabPQR dimension reduction has better prediction precision.
| Table 2 Max and mean color difference of 6 subspaces |
The running times of two models are shown in figure 8, predicted time of the new backward model and YNSN model are 9.05s and 60.47s respectively, which shows the computation efficiency of the new backward model is increased by 7 times.
5 Conclusions
A new spectral characterization model based on LabPQR dimension reduction is proposed in the paper, and the backward model takes full advantage of the theory of color space division, cell searching and inverse tetrahedron interpolation. Compared with YNSN model, the new model has better color conversion precision, stability and computation efficiency. Therefore, the new model can be applied to color space conversion between multi-color printer channel signal values and the spectral reflectance in the field of spectral reproduction.
The authors have declared that no competing interests exist.
参考文献
| [1] |
|
| [2] |
|
| [3] |
|
| [4] |
|
| [5] |
|
| [6] |
|
| [7] |
|
| [8] |
|
| [9] |
|
| [10] |
|
| [11] |
|
| [12] |
|
| [13] |
|
| [14] |
|
| [15] |
|