引用本文
. [J]. 光谱学与光谱分析, 2018,38(6): 1963-1969.
Halil Oturak, Neslihan Kaya K#cod#x00131;nayt#cod#x000fc;rk, #cod#x000c7;ag#cod#x002d9;r#cod#x00131; #cod#x000c7;#cod#x00131;rak. Experimental and Theoretical Spectral (FT-IR, Raman, NMR, UV-Vis and NLO) Analysis of a Potential Anti-Tumor Drug: 1-Methyl-6-Nitro-1H-Benzimidazole[J]. Spectroscopy and Spectral Analysis, 2018,38(6): 1963-1969.
Doi:10.3964/j.issn.1000-0593(2018)06-1963-07
Permissions
Halil Oturak, Neslihan Kaya K#cod#x00131;nayt#cod#x000fc;rk, #cod#x000c7;ag#cod#x002d9;r#cod#x00131; #cod#x000c7;#cod#x00131;rak. Experimental and Theoretical Spectral (FT-IR, Raman, NMR, UV-Vis and NLO) Analysis of a Potential Anti-Tumor Drug: 1-Methyl-6-Nitro-1H-Benzimidazole[J]. Spectroscopy and Spectral Analysis, 2018,38(6): 1963-1969.
Doi:10.3964/j.issn.1000-0593(2018)06-1963-07
Copyright©2018, 《光谱学与光谱分析》期刊社
《光谱学与光谱分析》期刊社 所有
关键词:
中图分类号:O657.3
文献标志码:A
Experimental and Theoretical Spectral (FT-IR, Raman, NMR, UV-Vis and NLO) Analysis of a Potential Anti-Tumor Drug: 1-Methyl-6-Nitro-1H-Benzimidazole

Abstract
In the present work, the experimental and the theoretical spectroscopic properties of 1-Methyl-6-Nitro-1H- Benzimidazole were investigated. The FT-IR (400~4 000 cm-1) and FT-Raman spectra (100~4 000 cm-1) of 1-Methyl-6-Nitro-1H- Benzimidazole in the solid phase were recorded. Also, experimental NMR and UV spectra of titled molecule were measured. To interpret the experimental data, geometric parameters, vibrational frequencies, NMR, UV spectra and NLO analysis of the optimized molecule were calculated using ab initio Hartree-Fock (HF) method and density functional theory (B3LYP) method with the 6-31++G(d,p) and 6-311++G(d,p) basis sets. Vibrational bands were assigned based on the potential energy distribution using the VEDA 4 program. The theoretical results showed good agreement with the experimental values.
Keyword:
FT-IR; FT-Raman; NMR; 1-Methyl-6-Nitro-1H-Benzimidazole; B3LYP


Introduction
The title compound, C8H7N3O2 is benzimidazole derivative compound and a potential antitumor drug and an antioxidant agent. Benzimidazole derivatives are heterocyclic compounds that attracted great attention during the last few years because of their its biological and pharmacological effects[1, 2] such as anticancer, antimicrobial, antihelmintic, antifungal, antiparasitic, antitumor, antiviral, antidiabetic, etc[1, 2, 3]. Spectroscopic studies of certain benzimidazole derivatives are already report[1, 2, 4, 5, 6]. As our best knowledge, There is no a detailed analysis of vibrational frequencies, IR and Raman spectra of 1-Methyl 6-Nitro 1H Benzimidazole (1M6N1HBz) has not been reported. As a result of, experimental and theoretical investigation of the vibrational frequencies, 1H and 13C NMR chemical shifts, geometric structure, HOMO-LUMO energies, excitation energies of this molecule were studied by using Gaussian 09 program package, for the first time. The detailed assignments of the vibrational spectra of title molecule have been performed on the basis of the calculated potential energy distribution (PED). The calculated harmonic frequency values are bigger than the observed ones, due to neglecting anharmonicity in calculations. Scaling procedure has been performed to provide an agreement between the harmonic and the observed vibrational frequencies. Also, harmonic frequencies are calculated for gaseous phase of isolated 1M6N1HBz, while experimental spectra are obtained from solid phase of title molecule. These experimental and theoretical data are important for offer an insight into the vibrational, UV-Vis, NMR spectrum and molecular geometry parameters.
1 Experimental Details
The compound 1-Methil-6-Nitro-1H-Benzimidazole in solid form was purchased from Sigma-Aldrich (St. Louis, MO, USA) and used with no further purification. The FT-IR spectrum was recorded using KBr pellets on a Perkin Elmer Spectrum BX FTIR spectrophotometer in the region 4 000~400 cm-1. The FT-Raman spectrum was obtained on a DXR-Raman Microscope in the region 3 500~12 cm-1. The 1H and 13C NMR were taken in DMSO solutions on a Bruker Ultrashield 400 Plus NMR spectrometer. Proton and carbon signals were referenced to TMS. UV-Visible analyses were carried out with a Perkin Elmer Lambda 20 spectrophotometer. All spectra were measured at room temperature.
2 Computational Details
Gaussian 09[7] software was used for the quantum chemical calculations. The calculations were performed by using DFT/B3LYP and HF method, with the 6-311G(d, p) basis set. The vibrational frequencies are calculated with these methods and then scaled by 0.968 2 and 0.905 1, respectively[8]. The geometry optimizations were performed by frequency calculations using the same basis set. Furthermore, the DFT/B3LYP/6-311G(d, p) basis set was used for the 1H and 13C NMR shielding constants calculations by using the GIAO method. UV-Vis spectra and electronic properties were obtained by time-dependent DFT (TD-DFT). Gauss View program was used for visualizing of theoretical data[9]. Poten-
tial energy distribution (PED) analysis was performed by using VEDA 4 program[10].
3 Result and Discussion
3.1 Molecular geometry
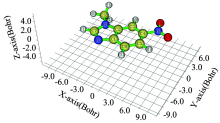
The optimized molecular structure of 1-methyl-6-nitro-1H-benzimidazole calculated using DFT theory at B3LYP/6-311G(d, p) level is shown in Figure 1. Experimental crystal geometry for the title compound has been reported by Lokaj et all.[11] the geometrical parameters such as bond length, bond angle and dihedral angles are compared with the X-Ray data of title compound shown in Table 1. The optimized and experimental mlecular structure shows good agreement.
 | Fig.1 Optimized molecular structure of 1M6N1HBz |
| Table 1 Geometrical parameters bond leght, bond angle and dihedral angle of title compound in ground state and comparison with experimental data |
3.2 Vibrational frequencies
3.2.1 C— H vibrations
Bands characteristic of aromatic compounds can be located in five region of IR spectrum. These regions are 3 100~3 000 cm-1 as CH stretching, 2 000~1 700 cm-1 as combinations and overtones, 1 650~1 430 cm-1 as C=C stretching, 1 275~1 000 cm-1 as in-plane CH deformation and 900~690 cm-1 as out of plane CH deformation[12, 13]. The title molecule stretching vibrational band are observed at 3 126, 3 122, 3 121, 3 099 cm-1. The vibrational frequencies are assigned 1 220 and 1 110 cm-1 for in plane CH deformation.
The observed symmetric and asymmetric stretching bands for CH3 group at the interval 2 927~2 814 were calculated at the interval 3 034~2 940 cm-1. Show good agreement with recorded as well as literature data[14, 15, 16].
Asymmetric deformation of the HCH angles of a CH3 group cause to very strong IR absorption in the 1 470~1 440 cm-1 region. The symmetric CH3 deformation gives a strong sharp IR band between 1 380~1 360 c
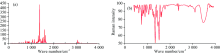
 | Fig.2 (a) Theoretical and (b) experimental FT-IR spectra of 1M6N1HBz |
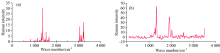
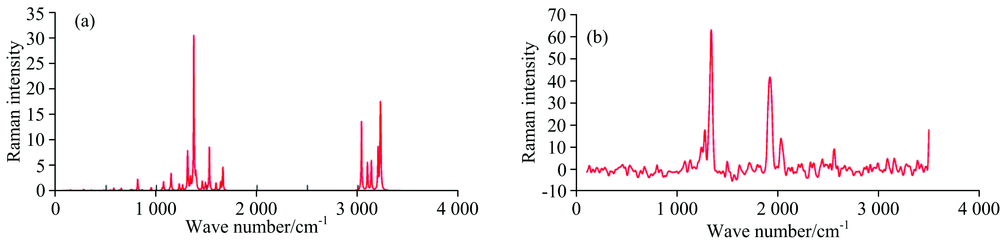 | Fig.3 (a) Theoretical and (b) experimental Raman spectra of 1M6N1HBz |
| Table 2 Fundamental band as signments of 1-Methyl-6-Nitro-1H-Benzimidazole |
3.2.2 N— O vibrations
The asymmetric stretching vibrations of the N— O bands bring about to a strong IR band between 1 590~1 530 cm-1. The symmetric stretching vibration of NO2 group exhibits a strong IR band at 1 380 cm-1. Aromatic nitro compounds show this band at lower frequencies[17]. The N— O stretching band is observed at 1 302 cm-1 in the experimental infrared spectrum. The same mode calculated at 1 327 cm-1 of title molecule. This calculated wavenumber is good agreement with the experimental frequencies.
3.2.3 C— N vibrations
Rani et al identified the C— N stretching bands in the region 1 328~1 266 c
3.2.4 C— C vibrations
The C— C ring stretch in the precursor gives rise to several peaks in the region 1 600 to 1 400 cm-1 [19]. In the present study the frequency bands at 1 620, 1 373 cm-1 in IR spectrum are assigned to C— C stretching vibration mode. The theoretical computed wave number also present consisted agreement with experimental result. The ring breathing mode is calculated at 918 and 1 099 cm-1 and is observed in FTIR spectra 1 064 and 892 cm-1.
On the other hand, while the peaks 958, 877, 855, 830 cm-1 can be attributed to the HCCN torsion vibration modes, the peaks 1 111, 1 037, 1 023, 118, 100 can be done the HCNC torsion vibration modes of 1M6N1HBz. The CNCN torsion vibration modes are observed in FTIR spectrum at 761 and 586 cm-1. These bands theoretical computed B3LYP method at 752, 609, 142 and 51 cm-1.
In addition to, stretching, deformation, torsion, bending and combination of these ones vibration modes of 1M6N1HBz are submitted in Table 2.
3.3 NMR Analysis
The isotropic chemical shifts are currently used for structure of organic molecules[16]. Calculation of chemical shifts in 13C and 1H NMR spectra in often a complicated problem and it is first of all true for the methods of the electron density functional theory (DFT). Beside the necessity to select efficient functional and basis sets used for the calculation of chemical shifts in 13C and 1H NMR spectra by DFT methods[20]. In recent years, gauge- including atomic orbital GIAO computational method is efficient in predicting chemical shifts of various organic compounds. In this study, the optimized structure of 1M6N1HBz is used to calculate the NMR spectra at the DFT/B3LYP methods with 6-311G(d, p) level using the GIAO method. The experimental and calculated values for 13C and 1H NMR are shown in Table 3. As shown in Table 3, the range 13C NMR chemical shift of the typical organic molecule usually is > 100 ppm[16, 18]. In this study, as to be expected 13C NMR chemical shifts in the ring for the title molecule are > 100 ppm. Nitrogen atom shows more electronegative property. Therefore, the chemical shift values of C7, C1, C2 and C4 has been observed 146.68, 147.69, 133.89 and 142.54 ppm, respectively. On the other hand, three carbon peak in the ring are observed 107.6, 116.99 and 117.52 ppm. Those was calculated 112.87, 123.47, 126 ppm. Besides, another carbon peak is calculated at 33.85 ppm is observed at 31.26 ppm (N— CH3). In the 1H NMR spectra just one type of protons appears at 3.92, 3.92, 3.96 ppm as a singlet (CH3) whereas the chemical shift value of 3.85, 3.85, 4.05 ppm have been determined by using B3LYP/6-311G(d, p) method. Signals for aromatic protons were observed at 7.78~8.58 ppm. Between the experimental and theoretical chemical shifts in 13C and 1H NMR spectra is very good agreement.
| Table 3 Experimentalandtheoreticalchemicalshifts (13C, 1H) of 1-Methyl-6-Nitro-1H- Benzoimidazolby B3LYP/6-311G(d, p) method [δ (ppm)] |
3.4 UV-Vis Analysis
The electronic excited states of title molecule were calculated at the B3LYP/6-311G(d, p) level by using the TD-DFT method on the optimized ground- state geometry of the titled molecule. The theoretical excitation energies, oscillator strength (f) and wavelength (λ ) and spectral assignments are carried out and compared with measured experimental wavelength given in Table 4. As stated in Frank-Condon principle, the maximum absorption peaks (λ max) correspond to an UV-Vis spectrum to vertical excitation[16]. Theoretical and experimental UV-Vis spectrum of titled molecule is given in Figure 4.
| Table 4 The experimental and calculated UV-Vis excitation enegy (Δ E) and oscillator strength (f) for 1M6N1HBz molecule calculated by TD-DFT/B3LYP/6-311G(d, p) |
 | Fig.4 (a) Theoretical and (b) experimental UV spectra of 1M6N1HBz |
The calculation predicts three electronic transitions at 291, 326, 339 nm in DMSO show good agreement with the experimental data (λ exp=316 nm). This absorption assigned to the transition from molecular orbital (MO) 46→ 47, which the highest occupied molecular orbital (HOMO) is the orbital 46 and lowest unoccupied molecular orbital (LUMO) is orbital 47. This transition is assigned to π → π * type. According to Figure 5, the HOMO of 1M6N1HBz present a charge density localized on the ring and N atom of the ring. HOMO-LUMO plots for DFT/B3LYP/6-311G(d, p) method is given in Figure 5.
 | Fig.5 Atomic orbital composition of the frontier molecular orbitals and related energies in gas phase |
4 NLO Analysis
In this study, molecular polarizability, the electronic dipole moment and anisotropy of polarizability molecular first hyperpolarizability of title compound were computed using DFT/B3LYP/6-311G(d, p) method. The total electronic dipole moment μ , the mean polarizability < α > , and the total first order hyperpolarizability (β total) were calculated using their x, y, z components and listed in Table 5. The calculation of polarizability (α ) and first hyperpolarizability (β ) is based on the finite field approach. The calculated value of mean polarizabilty < α > and total firs order hyperpolarizability (β total) of title molecule are 0.993× 10⁻³⁰ esu and 6.972× 10⁻³⁰ esu, respectively. Urea was used as a prototypical molecule to calculate the NLO properties of the molecular systems. In this study, calculated β value is 35 times that of urea (0.194 7× 10-30 esu) and therefore title molecule purposes.
| Table 5 Dipol moment, polarizability and hyperpolarizability data for 1M6N1HBz calculated at B3LYP/6-311G(d, p) level of theory |
5 Conclusion
The FT-IR and FT-Raman spectrums have been measured and detailed vibrational assignment was presented for 1M6N1HBz. The optimized geometries, harmonic vibrational wavenumbers, NMR shields, FT-IR and FT-Raman spectrums of title compound were obtained and analyzed by DFT/B3LYP/6-311(d, p) method. The theoretical NMR shields were also in good agreement with experimental data. UV analysis of title compound have been studied using TD-DFT/B3LYP/6-311G(d, p) basis set. All calculated data were compared with experiment and found to be in good agreement.
The authors have declared that no competing interests exist.
参考文献
| [1] |
|
| [2] |
|
| [3] |
|
| [4] |
|
| [5] |
|
| [6] |
|
| [7] |
|
| [8] |
|
| [9] |
|
| [10] |
|
| [11] |
|
| [12] |
|
| [13] |
|
| [14] |
|
| [15] |
|
| [16] |
|
| [17] |
|
| [18] |
|
| [19] |
|
| [20] |
|