

纳米相氟氧化物玻璃陶瓷中Er3+Yb3+离子对的量子剪裁发光造成的强的光谱调制
引用本文
陈晓波, 李崧, 于春雷, 王水锋, 赵国营, 马辉, 郑东, 杨国建, 刘媛, 邓志威, 何青, 胡丽丽. 纳米相氟氧化物玻璃陶瓷中Er3+Yb3+离子对的量子剪裁发光造成的强的光谱调制 [J]. 光谱学与光谱分析, 2018,38(6): 1949-1957.
CHEN Xiao-bo, LI Song, YU Chun-lei, WANG Shui-feng, ZHAO Guo-ying, MA Hui, ZHENG Dong, YANG Guo-jian, LIU Yuan, DENG Zhi-wei, HE Qing, HU Li-li. Intense Spectral Modulation by Quantum Cutting Luminescence of Er3+Yb3+ Ion-Pair in Nanophase Oxyfluoride Vitroceramics [J]. Spectroscopy and Spectral Analysis, 2018,38(6): 1949-1957.
Doi:10.3964/j.issn.1000-0593(2018)06-1949-09
Permissions
CHEN Xiao-bo, LI Song, YU Chun-lei, WANG Shui-feng, ZHAO Guo-ying, MA Hui, ZHENG Dong, YANG Guo-jian, LIU Yuan, DENG Zhi-wei, HE Qing, HU Li-li. Intense Spectral Modulation by Quantum Cutting Luminescence of Er3+Yb3+ Ion-Pair in Nanophase Oxyfluoride Vitroceramics [J]. Spectroscopy and Spectral Analysis, 2018,38(6): 1949-1957.
Doi:10.3964/j.issn.1000-0593(2018)06-1949-09
Copyright©2018, 《光谱学与光谱分析》期刊社
《光谱学与光谱分析》期刊社 所有
纳米相氟氧化物玻璃陶瓷中Er3+Yb3+离子对的量子剪裁发光造成的强的光谱调制
摘要
研究了纳米相氟氧化物玻璃陶瓷中Er3+Yb3+离子对的量子剪裁发光造成的强的光谱调制现象。 测量了Er3+Yb3+双掺纳米相氟氧化物玻璃陶瓷的X射线衍射谱、 表面形貌、 激发光谱、 吸收光谱、 和发光光谱; 而且也与Tb3+Yb3+双掺纳米相氟氧化物玻璃陶瓷的相对应的光谱参数进行了比较。 发现378 nm光激发样品(A) Er(1%)Yb(8.0%)∶FOV和样品(B) Er(0.5%)Yb(3.0%)∶FOV所导致的652.0 nm红色发光强度为522 nm光激发时的680.85倍和303.80倍; 我们还发现378 nm光激发所导致的样品(A) Er(1%)Yb(8.0%)∶FOV和样品(B) Er(0.5%)Yb(3.0%)∶FOV的 652.0 nm红色发光强度为样品(C) Er(0.5%)∶FOV 的491.05和184.12倍。 我们还发现在378 nm光激发时的样品(A) Er(1%)Yb(8.0%)∶FOV和样品(B) Er(0.5%)Yb(3.0%)∶FOV的{978.0和1 012.0 nm}红外发光强度依次分别为样品(C) Er(0.5%)∶FOV 的{58.00和293.62}倍和{25.11和 67.50}倍。 更进一步, 对于652.0 nm波长发光的激发谱, 发现(A) Er(1%)Yb(8.0%)∶FOV和(B) Er(0.5%)Yb(3.0%)∶FOV的378.5 nm激发谱峰强度是(C) Er(0.5%)∶FOV的大约606.02和199.83倍。 同时, 也发现样品(A) Er(1%)Yb(8.0%)∶FOV和样品(B) Er(0.5%)Yb(3.0%)∶FOV的一级量子剪裁红外1 012或978 nm发光强度为样品(D) Tb(0.7%)Yb(5.0%)∶FOV的二级量子剪裁红外976 nm发光强度的101.38和29.19倍。 发现的该量子剪裁是目前所报道的最强的量子剪裁。 因此, 相信所发现的氟氧化物纳米玻璃陶瓷中Er3+Yb3+离子对的一级量子剪裁发光是强的可以作为量子剪裁层应用到提高晶硅太阳能电池的发电效率。 研究结果也能加速对目前国际热点的下一代环保的光谱调制太阳能电池的探索。
关键词:
量子剪裁发光; 光谱调制; 太阳能电池; 能量传递; Er3+Yb3+-双掺纳米相氟氧化物玻璃陶瓷
中图分类号:482.3
文献标志码:A
Intense Spectral Modulation by Quantum Cutting Luminescence of Er3+Yb3+ Ion-Pair in Nanophase Oxyfluoride Vitroceramics
Abstract
In this paper, the spectral modulation by the quantum-cutting luminescence of Er3+Yb3+ ion-pairs in nanophase oxyfluoride vitroceramics is studied. We obtained X-ray diffraction spectra, surface topographies, excitation, absorption, and luminescence spectra of Er3+Yb3+ nanophase oxyfluoride vitroceramics, and compared them with the corresponding parameters of a Tb3+Yb3+-codoped sample. We find that the 652.0 nm wavelength red luminescence intensity is enhanced by the factors of 680.85 and 303.80 for (A) Er(1%)Yb(8.0%)∶FOV and (B) Er(0.5%)Yb(3.0%)∶FOV, respectively, when they are excited by 378 nm light than when they are excited by 522 nm light. It is also found that the 652.0 nm red luminescence intensity is enhanced 491.05 and 184.12 times for (A) Er(1%)Yb(8.0%)∶FOV and (B) Er(0.5%)Yb(3.0%)∶FOV than (C) Er(0.5%)∶FOV when they are both being excited by 378 nm light. the results show that the {978.0 and 1 012.0 nm} infrared luminescence intensities of (A) Er(1%)Yb(8.0%)∶FOV and (B) Er(0.5%)Yb(3.0%)∶FOV are {58.00 and 293.62} and {25.11 and 67.50} times, respectively, larger than the corresponding ones of (C) Er(0.5%)∶FOV when both excited with 378 nm light. And further, the intensities of the 378.5 nm excitation peak of (A) Er(1%)Yb(8.0%)∶FOV and (B) Er(0.5%)Yb(3.0%)∶FOV are about 606.02 time and 199.83 times, respectively, larger than (C) Er(0.5%)∶FOV when 652.0 nm luminescence wavelength is selected as the fluorescence receiving wavelength to measure the visible excitation spectra in the range of 250~628 nm. Meanwhile, we also find that the first-order quantum-cutting infrared 1 012 or 978 nm luminescence intensities of (A) Er(1%)Yb(8.0%)∶FOV and (B) Er(0.5%)Yb(3.0%)∶FOV are about 101.38 and 29.19 times larger than the second-order quantum-cutting infrared 976 nm luminescence intensity of (D) Tb(0.7%)Yb(5.0%)∶FOV. To the best of our knowledge, present quantum-cutting obtained in our study is the most intense quantum-cutting reported to date. Therefore, we believe that present first-order quantum-cutting luminescence of Er3+Yb3+-codoped oxyfluoride vitroceramics may be intense for the material’s use as a quantum-cutting layer to enhance the photovoltaic conversion efficiency of crystal silicon solar cell. The results can facilitate the probing of next-generation environmentally friendly spectral-modulation solar cells, which are currently the focus of global attention.
Keyword:
Quantum-cutting luminescence; Spectral modulation; Solar cell; Energy transfer; Er3+Yb3+-codoped nanophase oxyfluoride vitroceramics
Introduction
The photovoltaic effect was first discovered by the French physicist A. E. Becquerel in 1839, and subsequently, the American scientists D. M. Chapin, C. S. Fuller, and G. S. Pearson of Bell Laboratories designed the first crystalline silicon solar cell with a photoelectricity conversion efficiency of 6%. Since then, solar cells have undergone significant development, and there are currently several types of solar cells including (1) silicon solar cells, (2) inorganic compound solar cells (such as cells based on GaAs, CdS and CIS), (3) film solar cells, (4) nanocrystalline solar cells, as well as (5) organic solar cells, and so on. Because the silicon solar cell has a suitable bandgap energy Eg, this type of cell offers the merits of higher photoelectricity conversion efficiency, low costs, non-pollution, abundant availability, stable operation, and ease of industrial production. Therefore, commercial single-junction crystalline Si solar cells currently dominate the photovoltaic market[1, 2, 3, 4, 5, 6, 7, 8, 9, 10, 11, 12]. Meanwhile, the bandgap of crystalline silicon is about Eg=1.12 eV, and its corresponding absorption wavelength is about 1100 nm. Therefore only the shorter wavelengths of sunlight (< 1 100 nm) can be absorbed by crystalline silicon to produce electron-hole pairs to generate photoelectricity. However, the longer wavelengths of sunlight (> 1 100 nm) cannot be absorbed by crystal silicon, there is a transmission energy loss of about 25%. In addition, the ultraviolet component of sunlight (< 400 nm) cannot be utilized by the cell to generate photoelectricity, either. Moreover, crystalline silicon solar cells only generate one electron-hole pair upon the absorption of a single photon in the wavelength range of 400-1100 nm. The surplus energy (hν -Eg) is converted into the kinetic energy of the electron-hole pair, which is subsequently converted to the heat energy of the matrix (thermalization loss). The solar energy wastage in the results is about 30%. These losses limit the photoelectricity conversion efficiency of Si solar cells. In this context, quantum-cutting, which forms a component of spectral modulation technology, has been found to be an excellent method to effectively resolve thermalization losses[8, 9, 10, 11, 12, 13, 14, 15, 16]. Quantum-cutting can convert one large-energy photon, which cannot be absorbed effectively by the solar cell, into multiple small-energy photons which can be efficiently absorbed by the solar cell. Consequently, the electricity-generating efficiency of the solar cell can be greatly enhanced.
Trupke and Green proposed a theory of electricity-generating efficiency enhancement via two-photon quantum-cutting in 2002[16]. The up-limit of electricity-generating efficiency can be enhanced to 38% from the Schockley-Queisser limit of 30%[16]. Furthermore, Vergeer and Meijerink first reported near-infrared two-photon quantum-cutting experimental phenomena in 2005[1], which is subsequent to their well-known work on visible quantum-cutting in science. Since 2007, Meijerink[1, 11], Qiu and Zhou[2, 12], Wang and Chen[6], Huang, Guo and Chen, Jing and Shao, Zhang[7], Xia and Hu[3], Song and Tao, our group[8, 15] and others[9, 13] have published nearly 500 articles on near infrared quantum-cutting, most of which focus on second-order quantum-cutting. Near-infrared quantum-cutting has since attracted considerable attention. Recently, Hu and Hao[13] proved that the actual photoelectric conversion efficiency of silicon-based solar cells can be enhanced via the quantum-cutting effect. In order to further enhance the luminescence intensity and efficiency, Meijerink together with others has pointed out that a first-order process may be more useful and significant because it is approximately 1000 times larger than the second-order process[11]. Therefore, in present study, we attempt to examine the first-order quantum-cutting process involving a novel Er3+-Yb3+ ion-pair in nanophase oxyfluoride vitroceramics. Our results can facilitate the probing of next-generation environmentally friendly spectral-modulation solar cells.
1 Experiment
1.1 Instruments, conditions, and the samples
First, the oxyfluoride glass was manufactured at high temperature. And the oxyfluoride glass samples were made from the oxide of silicon (SiO2), and the fluorides of lead (PbF2), zinc (ZnF2), lutetium (LuF3), erbium (ErF3), and ytterbium (YbF3). The starting materials were high-purity reagents. In addition, the raw powders were weighed according to their stoichiometric compositions, mixed, ground, and placed in a platinum crucible that was heated for 100 min at approximately 900 ℃. The contents were then rapidly cooled on an iron plate to obtain the oxyfluoride glass. Nanophase oxyfluoride vitroceramics (FOV) were obtained by annealing the glass for 7 h at the approximate glass transition temperature Tg . The samples used in our experiments were erbium-ytterbium Er3+Yb3+-codoped nanophase oxyfluoride vitroceramics: (A) Er(1%)Yb(8.0%)∶ FOV, (B) Er(0.5%)Yb(3.0%)∶ FOV, erbium Er3+-doped nanophase oxyfluoride vitroceramics (C) Er(0.5%)∶ FOV, and terbium-ytterbium Tb3+Yb3+-codoped nanophase oxyfluoride vitroceramics (D) Tb(0.7%)Yb(5.0%)∶ FOV. The constitution of sample (B) Er(0.5%)Yb(3.0%)∶ FOV was SiO2(45%), PbF2(30%), ZnF2(17.2%), LuF3(4.3%), ErF3(0.5%) and YbF3(3%).
The fluorescence spectrometer FL3-2iHR, manufactured by the Horiba-JY Company (America, Japan, and France), was used to carry out photoluminescence spectroscopy measurements. The pumping light source was a Xe lamp. The visible-light detector utilized in the study was an R2658p photomultiplier, which is sensitive in the wavelength range of 250 to 1000 nm. As for the infrared detector, we used the infrared photomultiplier H10330-75, which is sensitive to radiation in the range of 950 to 1 680 nm. Here, we remark that for all our experimental results, the fluorescence intensities at the same wavelength in the same figure can be compared directly. The X-ray diffraction (XRD) spectra were measured with a Philips X’ Pert PRO MPD diffractometer (Holland). The absorption spectrum was measured by means of a UV-3600 spectrophotometer (Shimadzu, Japan). The surface topographies and structures of the samples were measured by means of the S-4800 field emission scanning electron microscope (FE-SEM) (Hitachi, Japan).
1.2 Sample surface topography and structure
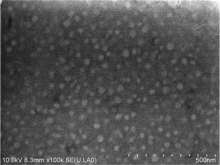
The surface topography and structure of sample (C) Er(0.5%)∶ FOV was investigated with the use of the S-4800 FE-SEM (Hitachi, Japan) operating at 10 kV. Figure 1 shows the sample’ s matrix glass surface, wherein we observe the monodispersive nanoparticles distributed uniformly in the size range of about 30 nm, which is in agreement with the XRD result.
 | Fig.1 The surface of the sample (C) Er(0.5%)∶ FOV as measured by the S-4800 field emission scanning electron microscope |
1.3 X-ray diffraction spectra
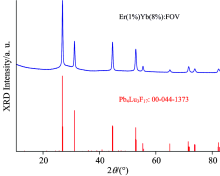
The XRD data for lattice parameter refinements was acquired with the use of the Philips X’ Pert PRO MPD diffractometer (Holland) with Cu Kα radiation (λ =0.154 05 nm) in the range of 2θ =10° ~80° . The representative X-ray diffraction (XRD) patterns of the (A) Er(1%)Yb(8.0%)∶ FOV sample are shown in Fig.2. It can be observed that all the diffraction peaks can be fitted to the corresponding peaks in the reported data of Pb4Lu3F17 (00-044-1373). We also observe certain obvious sharp peaks appearing in the sample, which indicates the emergence of micro-crystallinity in the sample. On the other hand, the observed wide diffraction band illustrates that the glass structure also existed, which means that the sample is a typical vitroceramics structure. From the strongest peak in Fig.2, we obtained the following measurements: 2θ =26.888° , Δ β =0.250° =0.004 36, and λ =0.154 05 nm. According to the XRD formula, we have
 | Fig.2 Representative X-ray diffraction (XRD) spectra of the (A) Er(1%)Yb(8.0%)∶ FOV |
It is easy to deduce that the average crystal size Dhkl=31.77× cos13.444=30.90 nm.
2 Results and discussion
2.1 Spectra of absorption and fluorescence
Figure 3 shows the absorption spectrum of the (B) Er(0.5%)Yb(3.0%)∶ FOV sample, which was measured by means of the UV-3600 spectrophotometer (Shimadzu, Japan). We can observe a series of absorption peaks located at 1 507.5, 975.0, 802.0, 652.0, 540.0, 522.0, 486.5, 449.0, 440.5, 405.0, and 378.0 nm. These absorption peaks can be easily assigned to the absorption transitions of the 4I13/2(Er3+), 2F5/2(Yb3+), 4I9/2(Er3+), 4F9/2(Er3+), 4S3/2(Er3+), 2H11/2(Er3+), 4F7/2(Er3+), 4F5/2(Er3+), 4F3/2(Er3+), 2H9/2(Er3+), and 4G11/2(Er3+) energy levels of the Er3+ or Yb3+ ions, respectively[5, 10].
 | Fig.3 Absorption spectrum of the (B) Er(0.5%)Yb(3.0%)∶ FOV |
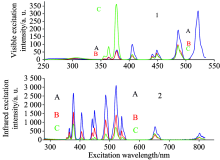
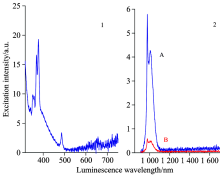
First, we chose the 540.0 nm visible luminescence wavelength as the fluorescence receiving wavelength to measure the visible excitation spectra in the range of 250~508 nm, as is shown in Fig.4(1). From the figure, we find there are 6 sets of excitation peaks locating at 355.5, 363.5, 378.5, 405.5, 448.5, and 486.0 nm, which correspond to the absorption transitions of 4I15/2→ (2G7/2, 2K15/2), 4I15/2→ 4G9/2, 4I15/2→ 4G11/2, 4I15/2→ 2H9/2, 4I15/2→ (4F3/2, 4F5/2), and 4I15/2→ 4F7/2, respectively. It can also be observed from Fig.4(1) that the intensities of 378.5 nm and 486.0 nm excitation peaks are, respectively, about 6.33× 101 and 1.93× 10² for (A) Er(1%)Yb(8.0%)∶ FOV, 5.69× 101 and 9.77× 101 for (B) Er(0.5%)Yb(3.0%)∶ FOV, and 3.62× 10² and 9.02× 101 for (C) Er(0.5%)∶ FOV.
 | Fig.4 (1) Visible excitation spectra in the range of 250~508 nm when monitored at 540.0 nm; (2) Infrared excitation spectra in the range of 250~820 nm when monitored at 1 542.0 nm. Labels A(blue), B(red), and C(green) correspond to (A) Er(1%)Yb(8.0%)∶ FOV, (B) Er(0.5%)Yb(3.0%)∶ FOV, and (C) Er(0.5%)∶ FOV, respectively |
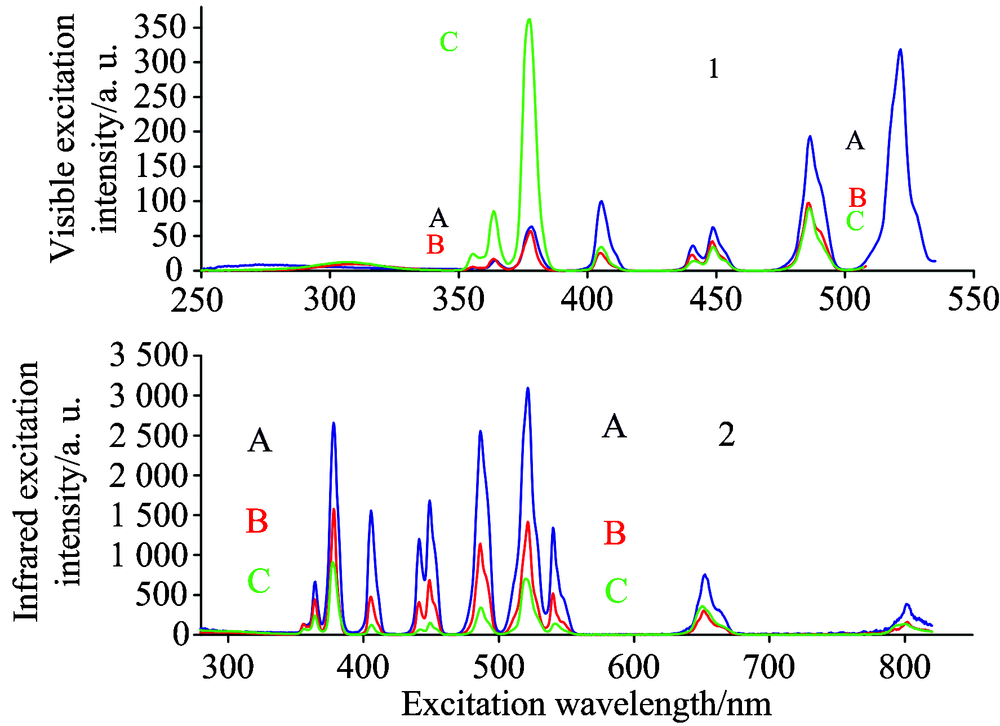
Next we selected the 652.0 nm visible luminescence wavelength as the fluorescence receiving wavelength to measure the visible excitation spectra in the range of 250~628 nm, as is shown in Fig.5(1). From the figure, we find there are 8 sets of excitation peaks locating at 355.5, 363.5, 378.5, 405.5, 448.5, 486.0, 522.0 and 539.5 nm, which can be attributed to the absorption transitions of 4I15/2→ (2G7/2, 2K15/2), 4I15/2→ 4G9/2, 4I15/2→ 4G11/2, 4I15/2→ 2H9/2, 4I15/2→ (4F3/2, 4F5/2), 4I15/2→ 4F7/2, 4I15/2→ 2H11/2, and 4I15/2→ 4S3/2, respectively[5, 10]. From Fig. 5(1), we also find that the intensities of the 378.5, 486.0 and 522.0 nm excitation peaks are, respectively, about 2.23× 10³, 1.89× 100 and 3.30× 100 for (A) Er(1%)Yb(8.0%)∶ FOV, 7.37× 10², 1.29× 100 and 2.19× 100 for (B) Er(0.5%)Yb(3.0%)∶ FOV, and 3.69× 100, 9.86× 10⁻¹ and 2.49× 100 for (C) Er(0.5%)∶ FOV. It is clear that the intensities of the 486.0 and 522.0 nm excitation peaks are basically unchanged. However, the intensities of the 378.5 nm excitation peak of (A) Er(1%)Yb(8.0%)∶ FOV and (B) Er(0.5%)Yb(3.0%)∶ FOV are about 606.02 time and 199.83 times, respectively, larger than that of (C) Er(0.5%)∶ FOV. It is noteworthy that the enhancement factor is greatly large.
 | Fig.5 (1) Visible excitation spectra in the range of 250~628 nm when monitored at 652.0 nm; (2) Infrared excitation spectra in the range of 250~820 nm when monitored at 1 012.0 or 978.0 nm. Labels A(blue), B(red), and C(green) correspond to (A) Er(1%)Yb(8.0%)∶ FOV, (B) Er(0.5%)Yb(3.0%)∶ FOV, and (C) Er(0.5%)∶ FOV, respectively |
And then, we measured the infrared excitation spectra in the range of 250~820 nm when the samples were monitored at infrared luminescence wavelength of 1 012.0 nm or 978.0 nm, as is shown in Fig.5(2). From the figure, we find that there are 10 sets of excitation peaks positioning at 355.5, 363.5, 378.5, 405.5, 448.5, 486.0, 522.0, 539.5, 652.5, and 801.0 nm, which correspond to the absorption transitions of 4I15/2→ (2G7/2, 2K15/2), 4I15/2→ 4G9/2, 4I15/2→ 4G11/2, 4I15/2→ 2H9/2, 4I15/2→ (4F3/2, 4F5/2), 4I15/2→ 4F7/2, 4I15/2→ 2H11/2, 4I15/2→ 4S3/2, 4I15/2→ 4F9/2, and 4I15/2→ 4I9/2, respectively[5, 10]. The intensities of the 378.5 and 522.0 nm excitation peaks are, respectively, 2.72× 10³ and 9.86× 10² for (A) Er(1%)Yb(8.0%)∶ FOV, 8.57× 10² and 3.55× 10² for (B) Er(0.5%)Yb(3.0%)∶ FOV, and 2.28× 101 and 1.92× 101 for (C) Er(0.5%)∶ FOV. It is obvious that these intensities for (A) Er(1%)Yb(8.0%)∶ FOV and (B) Er(0.5%)Yb(3.0%)∶ FOV are 119.52, 51.44 and 37.63, 18.52 times larger than the corresponding ones of (C) Er(0.5%)∶ FOV again. The enhancement factor is very large.
Finally, infrared excitation spectra in the range of 250~820 nm were measured when the samples were monitored at the infrared luminescence wavelength of 1542.0 nm luminescence, as is shown in Fig.4(2). The intensities of the 378.5 and 522.0 nm excitation peaks are, respectively, 2.66× 10³ and 3.09× 10³ for (A) Er(1%)Yb(8.0%)∶ FOV, 1.58× 10³ and 1.42× 10³ for (B) Er(0.5%)Yb(3.0%)∶ FOV, and 9.12× 10² and 7.04× 10² for (C) Er(0.5%)∶ FOV. It is obvious that these intensities for (A) Er(1%)Yb(8.0%)∶ FOV and (B) Er(0.5%)Yb(3.0%)∶ FOV are, respectively, 2.92, 4.39 and 1.73, 2.02 times larger than the corresponding ones of (C) Er(0.5%)∶ FOV.
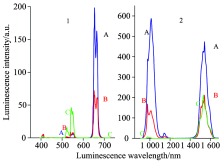
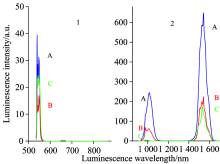
We also measured the luminescence spectra of the abovementioned nanophase oxyfluoride vitroceramics. First we measured the visible luminescence spectra in the range of 395~728 nm when the 4G11/2 energy level was excited by 378 nm light, as is shown in Fig.6(1). From the figure, we observe that there are two luminescence peaks located at 540.0 and 652.0 nm, corresponding to the 4S3/2→ 4I15/2 and 4F9/2→ 4I15/2 transition luminescence, respectively. The luminescence intensities of the 540.0 and 652.0 nm luminescences are, respectively, about 6.43× 100 and 1.92× 10² for (A) Er(1%)Yb(8.0%)∶ FOV, 9.04× 100 and 7.20× 101 for (B) Er(0.5%)Yb(3.0%)∶ FOV, and 4.59× 101 and 3.91× 10⁻¹ for (C) Er(0.5%)∶ FOV. We find that the excitation by 378 nm light negligibly influences (C) Er(0.5%)∶ FOV when compared with 522 nm excitation, whose luminescences are still “ green-light strong” and “ red-light weak” . But the 540.0 nm green luminescence intensity reduces 6.13 and 2.33 times for (A) Er(1%)Yb(8.0%)∶ FOV and (B) Er(0.5%)Yb(3.0%)∶ FOV when they are excited by 378 nm light in Fig.6(1) than when they are excited by 522 nm light in Fig.7(1). However, we also find that the 652.0 nm red luminescence intensity is enhanced by 680.85 and 303.80 times for (A) Er(1%)Yb(8.0%)∶ FOV and (B) Er(0.5%)Yb(3.0%)∶ FOV when they are excited by 378 nm light in Fig.6(1) than when they are excited by 522 nm light in Fig.7(1). Meanwhile, the 652.0 nm red luminescence intensity is enhanced by 491.05 and 184.12 times for (A) Er(1%)Yb(8.0%)∶ FOV and (B) Er(0.5%)Yb(3.0%)∶ FOV than (C) Er(0.5%)∶ FOV when they are excited both by 378 nm light. Both (A) Er(1%)Yb(8.0%)∶ FOV and (B) Er(0.5%)Yb(3.0%)∶ FOV exhibit very weak 540.0 nm green-light signals and very intense 652.0 nm red-light signals. These results indicate that the Yb3+ ion strongly influences the luminescence when the 4G11/2 energy level is excited by 378 nm light.
 | Fig.6 (1) Visible luminescence spectra in the range of 395~728 nm when excited by 378 nm light; (2) Infrared luminescence spectra in the range of 908~1 680 nm when excited by 378 nm light. Labels A(blue), B(red), and C(green) correspond to (A) Er(1%)Yb(8.0%)∶ FOV, (B) Er(0.5%)Yb(3.0%)∶ FOV, and (C) Er(0.5%)∶ FOV, respectively |
Next, we have measured the infrared luminescence spectra in the range of 908~1 680 nm when the 4G11/2 energy level was excited by 378 nm light, as is shown in Fig.6(2). From the figure, we find two sets of luminescence peaks at {978.0 and 1 012.0 nm}, and 1 542.0 nm, corresponding to the {4I11/2→ 4I15/2 transition of Er3+ ion and 2F5/2→ 2F7/2 transition of Yb3+ ion}, and the 4I13/2→ 4I15/2 transition of Er3+ ion, respectively. Their luminescence intensities are, respectively, about {3.90× 10² and 5.87× 10²} and 4.73× 10² for (A) Er(1%)Yb(8.0%)∶ FOV, {1.69× 10² and 1.35× 10²} and 2.12× 10² for (B) Er(0.5%)Yb(3.0%)∶ FOV, and {6.73× 100 and 2.00× 100} and 2.12× 10² for (C) Er(0.5%)∶ FOV. We find that the infrared luminescence intensities of (B) Er(0.5%)Yb(3.0%)∶ FOV are {25.11 and 67.50} and 1.00 times, respectively, larger than the corresponding ones of (C) Er(0.5%)∶ FOV. The infrared luminescence intensities of (A) Er(1%)Yb(8.0%)∶ FOV are, respectively, {2.31 and 4.35} and 2.23 times larger than the corresponding ones of (B) Er(0.5%)Yb(3.0%)∶ FOV. It is obvious that the introduction of Yb3+ ion results in significant enhancement of the luminescence of the {4I11/2→ 4I15/2 transition of Er3+ ion and 2F5/2→ 2F7/2 transition of Yb3+ ion}. Meanwhile, the luminescence intensity of the 4I13/2→ 4I15/2 transition of Er3+ ion essentially remains unchanged.
And then, we have measured the visible luminescence spectra of (A) Er(1%)Yb(8.0%)∶ FOV, (B) Er(0.5%)Yb(3.0%)∶ FOV and (C) Er(0.5%)∶ FOV in the range of 535~728 nm when the 2H11/2 energy level was excited by 522 nm light, as is shown in Fig.7(1). We notice that there are two main luminescence peaks positioning at 540.0 and 652.0 nm, which can be identified as the luminescence transitions of 4S3/2→ 4I15/2 and 4F9/2→ 4I15/2, respectively. Their corresponding intensities are, respectively, about 3.94× 101 and 2.82× 10⁻¹ for (A) Er(1%)Yb(8.0%)∶ FOV, 2.11× 101 and 2.37× 10⁻¹ for (B) Er(0.5%)Yb(3.0%)∶ FOV, and 2.44× 101 and 2.52× 10⁻¹ for (C) Er(0.5%)∶ FOV. These peaks indicate that the 540.0 nm green light is intense and the 652.0 nm red light is weak. We also find that the luminescence intensity of (B) Er(0.5%)Yb(3.0%)∶ FOV is close to that of (C) Er(0.5%)∶ FOV. These results indicate that the Yb3+ ions have no influence on the luminescence in this case.
 | Fig.7 (1) Visible luminescence spectra in the range of 535~728 nm when excited by 522 nm light. (2) Infrared luminescence spectra in the range of 908-1680 nm when excited by 522nm light. Labels A(blue), B(red), and C(green) correspond to (A) Er(1%)Yb(8.0%)∶ FOV, (B) Er(0.5%)Yb(3.0%)∶ FOV, and (C) Er(0.5%)∶ FOV, respectively |
Finally, we have measured the infrared luminescence spectra in the range of 908~1 680 nm when the 2H11/2 energy level was excited by 522 nm light, as is shown in Fig.7(2). From the figure, we find that there are two sets of luminescence peaks at {978.0 nm, 1 012.0 nm} and 1 542.0 nm. The {978.0 nm, 1 012.0 nm} luminescence peaks corresponding to the 4I11/2→ 4I15/2 transition of Er3+ ion and the 2F5/2→ 2F7/2 transition of Yb3+ ion, respectively. Furthermore, the 1 542.0 nm luminescence peak corresponds to the 4I13/2→ 4I15/2 transition of Er3+ ion. We also find that the luminescence intensities of the 978.0, 1 012.0 and 1 542.0 nm luminescence peaks are about 1.35× 10², 2.45× 10², and 6.48× 10² for (A) Er(1%)Yb(8.0%)∶ FOV, 6.85× 101, 6.25× 101, and 2.23× 10² for (B) Er(0.5%)Yb(3.0%)∶ FOV, and 5.86× 100, 1.81× 100, and 1.74× 10² for (C) Er(0.5%)∶ FOV, respectively. It can be found that the 978.0, 1 012.0 and 1 542.0 nm luminescence peak intensities of (B) Er(0.5%)Yb(3.0%)∶ FOV are, respectively, about 11.69, 34.53 and 1.28 times larger than the corresponding ones of (C) Er(0.5%)∶ FOV. Those of (A) Er(1%)Yb(8.0%)∶
FOV are, respectively, 1.97, 3.92, and 2.91 times larger than the corresponding ones of (B) Er(0.5%)Yb(3.0%)∶ FOV. These results indicate that the introduction of Yb3+ ion can greatly enhance the luminescence of the 4I11/2→ 4I15/2 transition of Er3+ ion and the 2F5/2→ 2F7/2 transition of Yb3+ ion. Meanwhile, the luminescence intensity of the 4I13/2→ 4I15/2 transition of Er3+ ion exhibits no change when the concentration of Er3+ ion does not change.
2.2 Comparison with Tb(0.7%)Yb(5.0%)∶ FOV
We also measure the excitation spectrum of sample (D) Tb(0.7%)Yb(5.0%)∶ FOV when monitored at 976 nm and the luminescence spectra, the sample was excited at 378 nm (A) and 486 nm (B), as is shown in Figs.8(1) and (2), respectively. Table 1 lists the first-order quantum-cutting infrared luminescence intensities of (A) Er(1%)Yb(8.0%)∶ FOV and (B) Er(0.5%)Yb(3.0%)∶ FOV when excited by 378 nm light. The table also lists the second-order quantum-cutting infrared luminescence intensities of (D) Tb(0.7%)Yb(5.0%)∶ FOV when the largest excitation peak 5D3 is excited by 378 nm light under the same experimental conditions. We find that the first-order quantum-cutting infrared 1 012 or 978 nm luminescence intensities of (A) Er(1%)Yb(8.0%)∶ FOV and (B) Er(0.5%)Yb(3.0%)∶ FOV are about 101.38 and 29.19 times larger than that of the second-order quantum-cutting infrared 976 nm luminescence intensity of (D) Tb(0.7%)Yb(5.0%)∶ FOV. Here, we remark that the Tb3+Yb3+-codoped materials are typical second-order quantum-cutting luminescence materials, which have been researched extensively[12]. However, we find that the first-order quantum-cutting infrared luminescence intensity at about 978 nm for Er3+Yb3+∶ FOV is significantly larger than the corresponding second-order quantum-cutting infrared luminescence intensity for Tb3+Yb3+∶ FOV. It is coincided with the judgment of Meijerink and so on, a first-order process may be approximately 1 000 times larger than the second-order process[11]. Therefore, we can conclude that the first-order quantum-cutting infrared luminescence of Er3+Yb3+-codoped oxyfluoride vitroceramics may be intense for the material to be potentially applied as a quantum-cutting layer to enhance the photoelectricity conversion efficiency of crystal silicon solar cells.
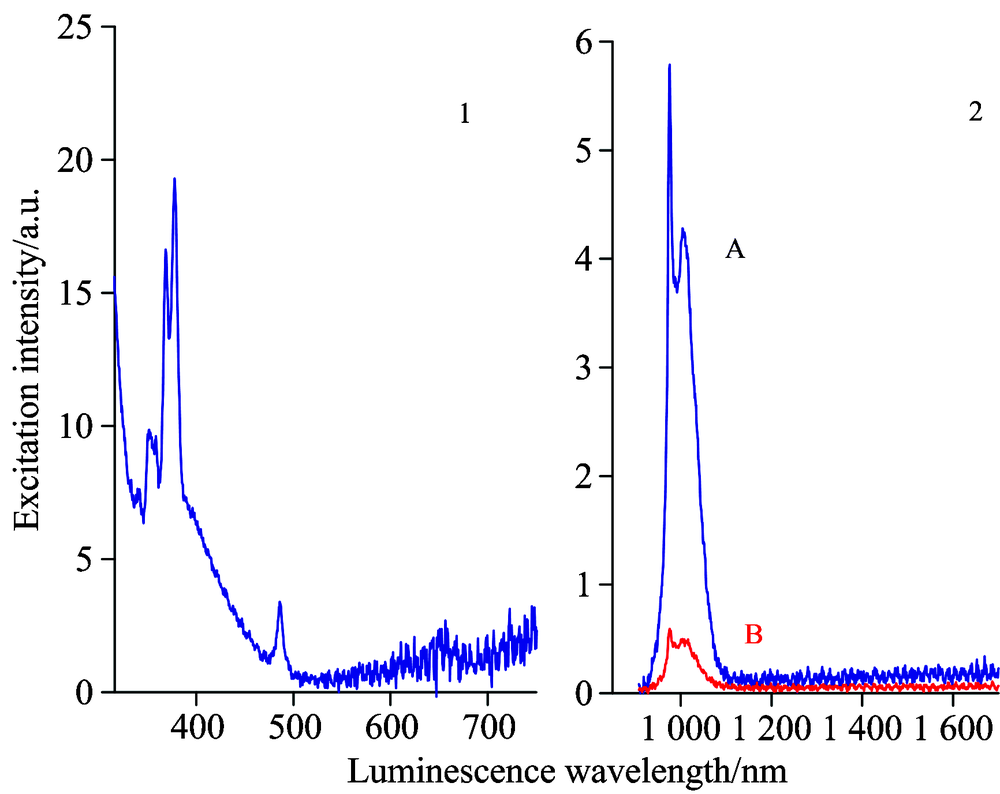 | Fig.8 (1) Excitation spectrum of the sample (D) Tb(0.7%)Yb(5.0%)∶ FOV monitored at 976 nm and (2) luminescence spectra when excited at 378 nm (A) (blue) and 486 nm (B) (red) |
| Table 1 Comparison of the quantum-cutting infrared luminescence intensities of (A) Er(1%)Yb(8.0%)∶ FOV, (B) Er(0.5%)Yb(3.0%)∶ FOV, and (D) Tb(0.7%)Yb(5.0%)∶ FOV |
2.3 Discussion
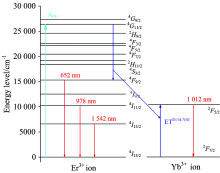
The schematic diagram of the energy level structure of Er3+ and Yb3+ ions is shown in Fig.9. Because the concentration of Yb3+ ion is quite large, there is an effective cross-energy transfer between Er3+ and Yb3+ ions. In particular, the {4G11/2(Er3+)→ 4F9/2(Er3+), 2F7/2(Yb3+)→ 2F5/2(Yb3+)} cross-energy transfer is very intense because of its small energy mismatch with 694 cm-1, the reduced matrix elements U(λ )2(0.428 3, 0.037 2, 0.011 2) of {4G11/2(Er3+)→ 4F9/2(Er3+)} transition are large and the elements U(λ )2(0.122 5, 0.408 2, 0.857 1) of {2F7/2(Yb3+)→ 2F5/2(Yb3+)} transition are very large[5, 10], and consequently, the cross-energy transfer rates of {4G11/2(Er3+)→ 4F9/2(Er3+), 2F7/2(Yb3+)→ 2F5/2(Yb3+)} are very high. Therefore, when the 4G11/2 energy level of Er3+ ion is excited by 378 nm light, the population in the 4G11/2 energy level is split into two, one set populates the 4F9/2 energy level of Er3+ ion, and the other populates the 2F5/2 energy level of Yb3+ ion, because of the action of {4G11/2(Er3+)→ 4F9/2(Er3+), 2F7/2(Yb3+)→ 2F5/2(Yb3+)} cross-energy transfer. Present process constitutes a very effective kind of two-photon quantum-cutting. Consequently, present two-photon quantum-cutting luminescence is very intense because the relative processes are all first-order processes with high oscillator intensity, particularly because of the nanometer dimension effect of nanophase oxyfluoride vitroceramics materials. From Fig.6(1), it is obvious that the 652.0 nm red luminescence intensity is enhanced by factors of 680.85 and 303.80 times for (A) Er(1%)Yb(8.0%)∶ FOV and (B) Er(0.5%)Yb(3.0%)∶ FOV, respectively, when excited by 378 nm light than when excited by 522 nm light. From Fig.6(2), we note that the {978.0 nm and 1 012.0 nm} infrared luminescence intensities of (A) Er(1%)Yb(8.0%)∶ FOV and (B) Er(0.5%)Yb(3.0%)∶ FOV are {58.00 and 293.62} and {25.11 and 67.50} times larger than the corresponding ones of (C) Er(0.5%)∶ FOV when they are both excited by 378 nm light. To the best of our knowledge, we emphasize that the quantum-cutting observed in this study is the most intense quantum-cutting reported to date. Meanwhile, the luminescence intensity of (C) Er(0.5%)∶ FOV is in the normal state because it is not involved in a strong quantum cutting process.
 | Fig.9 Schematic diagram of the energy level structure of Er3+ and Yb3+ ions and the quantum-cutting process |
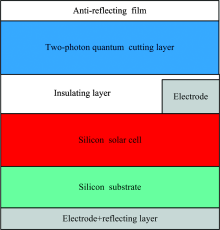
It is well-known that crystalline silicon c-Si solar cells exhibit very high photoelectricity conversion efficiencies at incident wavelengths of about 1 000 nm. Furthermore, the photoelectricity conversion efficiency of c-Si cells is also high at about 650 nm. While it is very low for incident wavelengths smaller than 400 nm. Therefore, a photon with wavelengths smaller than 410 nm can be effectively converted into two photons (1 000 and 650 nm photons), if we use the above mentioned Er3+/Yb3+-codoped nanophase oxyfluoride vitroceramic material to construct a quantum-cutting layer. Consequently, the number of small-energy photons, which can be utilized effectively by the solar cell, can be enhanced greatly. The electricity-generating efficiency of the crystalline Si solar cell can further be enhanced via the above mentioned quantum-cutting effect. Meanwhile, a photon in the wavelength range of 410 to 528 nm can be effectively converted into a photon with a 540 nm wavelength by means of the downshifting effect. Moreover, the electricity-generating efficiency of crystalline Si solar cells can also be enhanced by means of this downshifting effect. The structure diagram of present two-photon quantum cutting silicon solar cell is shown in Fig.10.
 | Fig.10 The structure diagram of the two-photon quantum cutting silicon solar cell |
3 Conclusion
The spectral modulation via the quantum-cutting luminescence of Er3+Yb3+ ion-pairs in nanophase oxyfluoride vitroceramics is studied in present manuscript. We obtained X-ray diffraction spectra, surface topographies, excitation, absorption, as well as luminescence spectra of Er3+Yb3+ nanophase oxyfluoride vitroceramics, and compared these with the corresponding parameters of a Tb3+Yb3+-codoped sample. We found that the 652.0 nm red luminescence intensity was enhanced by 680.85 and 303.80 times for (A) Er(1%)Yb(8.0%)∶ FOV and (B) Er(0.5%)Yb(3.0%)∶ FOV be excited by 378 nm light than when they are excited by 522 nm light. Meanwhile, the 652.0 nm red luminescence intensity enhance 491.05 and 184.12 times for (A) Er(1%)Yb(8.0%)∶ FOV and (B) Er(0.5%)Yb(3.0%)∶ FOV than (C) Er(0.5%)∶ FOV when they are both excited by 378 nm light. We also find that the {978.0 and 1 012.0 nm}infrared luminescence intensities of (A) Er(1%)Yb(8.0%)∶ FOV and (B) Er(0.5%)Yb(3.0%)∶ FOV are {58.00 and 293.62} and {25.11 and 67.50} times larger than the corresponding ones of (C) Er(0.5%)∶ FOV when both excited by 378 nm light. It is obvious that the enhancement extent are greatly huge. Meanwhile, we also find that the first-order quantum-cutting infrared 1 012 or 978 nm luminescence intensities of (A) Er(1%)Yb(8.0%)∶ FOV and (B) Er(0.5%)Yb(3.0%)∶ FOV are about 101.38 and 29.19 times larger than the second-order quantum-cutting infrared 976 nm luminescence intensity of (D) Tb(0.7%)Yb(5.0%)∶ FOV. To the best of our knowledge, present quantum-cutting obtained in our study is the most intense quantum-cutting reported to date. We believe that the first-order quantum-cutting infrared luminescence of Er3+Yb3+-codoped oxyfluoride vitroceramics may be intense for the material’ s use as a quantum-cutting layer to enhance the photoelectricity conversion efficiency of crystalline silicon solar cells. All in all, we believe that our results can aid in the development of new-generation environmentally friendly spectrally modulated solar cells, which are currently the focus of global attention.
The authors have declared that no competing interests exist.
参考文献
| [1] |
|
| [2] |
|
| [3] |
|
| [4] |
|
| [5] |
|
| [6] |
|
| [7] |
|
| [8] |
|
| [9] |
|
| [10] |
|
| [11] |
|
| [12] |
|
| [13] |
|
| [14] |
|
| [15] |
|
| [16] |
|