


基于视觉感知的光谱评估尺度
[田全慧1  , 刘士伟
, 刘士伟2 , 朱明3 , 刘真4 ]
, 刘士伟|
|


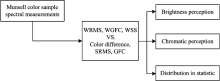
光谱颜色复现和色度精度是评价光谱重建算法准确的基础。 简单而直观的评价指标对颜色复现控制是必不可少。 该指标需要同时表征复现颜色的光谱差和色度差。 在研究光谱匹配评估的方法基础上, 提出基于颜色视觉感知的三种光谱评估指标, 通过加权人眼视觉匹配函数, 实现颜色光谱差与色度的评估。 通过孟塞尔颜色系统的光谱数据, 该论文分析与验证三种视觉加权的评估指标的有效性。 通过孟塞尔颜色系统数据, 这些指标在CIELab均匀色空间中分布均匀而稳定, 从而证明加权算法的评估指标是既表征到颜色感知又反映出颜色的光谱相似度。 实证结果表明, 加权的指标可以实现同时表征实际人眼的颜色感知和颜色光谱差异。 基于人眼视觉感知的评估指标解决了颜色的原始光谱和重建光谱的光谱匹配精度的定量评价问题。 所提出评价指标通过一个简单而直观的数值实现对复现颜色光谱与色度评估。
Biography: TIAN Quan-hui, (1974-), female, PhD., associate professor, Shanghai Publishing and Printing College e-mail: tqh0509@163.com
Reasonable evaluation of spectral color reproduction and chromaticity accuracy is fundamental to evaluate the accurate of spectral reconstruction algorithm. A simple and direct evaluation index is necessary to the color reproduction. This index requires to directly characterize the spectral difference and color difference for color reproduction. Based on the study of the reproduction of the accuracy evaluation on spectral matching, this paper proposes three spectral evaluation metrics based on color visual perception. These methods are weighted spectral evaluation metrics based on human visual function. The results of weighted metrics are analyzed with Munsell color system. These metrics get the uniform distribution and stability in there replication experiment, which proves that weighted metrics are accurate metrics for color spectral reconstruction, and take into account the color perception and spectral similarity. The empirical result is that the weighted metrics indicate the actual human color perception and spectral error at same time.The metrics based on human perception solve the problem of quantitative evaluation of spectral estimation accuracy of natural spectrum matching and color spectral reconstruction.The evaluation methods in this paper show simple and intuitive color spectrum reproduction accuracy.
In recent years, the research of color restoration based on multispectral imaging system has become a hot topic in the field of image science. In the color restoration workflow, the image spectral data is required to match with the actual color spectrum. It is a key point that is necessary for the quantitative evaluation of the spectral matching accuracy between the reconstructed color spectral data and the actual corresponding color spectral data, and the evaluation of spectral estimation performance of multispectral imaging systems[1, 2].
In previous studies, there are two kinds of methods for the evaluation of spectral matching accuracy. The first one is based on constant-chroma matching. The spectral reflectance of color must be approximately similar in order to achieve matching. So the evaluation is using the CIE color difference and the metameric index[3]. This method takes into account the colorimetric properties of the spectral response of the human eye, but it does not really indicate the similarity of the two spectra.
The second one is based on the difference of the two spectral curves mainly used in the field of remote sensing, such as spectral distance, spectral root Mean square error (sRMS), and Goodness-of-fit coefficient (GFC)[4, 5]. Then there are researches to find out the smaller difference of spectral curve does not mean the smaller of difference of color perception[4, 5, 6].
The researchers now use the CIE color difference andsRMS as the evaluation indices to estimate chromaticity and spectral differences in statistical parameters at same time. This method uses a number of indicators to take into account both the differentia of chromaticity and spectral distribution. But these indices are only logical repetition because the chromaticity is the reflection of the spectral parameters, and difficult to draw the constant conclusion definitely. Prof. Li proposed the spectral matching skewness index to evaluate the Spectral matching of two spectral vectors, which solved the problem of quantitative evaluation of spectral estimation accuracy of natural spectrum matching and multispectral camera. But it cannot be considered as the difference of two color spectra based on perception of these colors[7]. However, due to the diversity and complexity of color reproduction, there is no simple and intuitive evaluation method now which could take into account the difference of chroma and spectrum at the same time.
This paper proposes a calculation method to evaluate the spectral similar of the reconstruction spectral color and actual spectral color with one index, which could present both the chromatic differences and spectral differences based on human perception.
According to the characteristics of human visual system, the weighted matrix of human visual color matching function is used to weigh the spectral evaluation metric.
In order to quantify the color perception, W. D. Wright and J. Guild did a large number of color vision experiments, and summarized a set of RGB data to matchequal energy visible-spectrum, which is on behalf of the average human color visual characters, and is the CIE1931 standard color observer CIE1931 color matching function[9, 10, 11]. The CIE 1931 standard color observer matching function is applied to 2-degreecentral visual observation conditions (field of view in the range of 1-degree to 4-degree), which is the main function of cone cell of fovea, and presents the precise color perception. Then we constructed a weighted matrix according to the color matching function[13].
If there is a spectral color matrix r, which describes m pieces of color samples and spectral n-dimensional, is expressed as r1, r2, …, rm. Therefore, the tristimulus of color (Γ ) can be expressed as a vector in Eq.(1)[12], where E is lighting source vector shown in Eq.(2), A is color matching function vector shown in Eq.(3), k is the coefficient of lightness normalization.
Defined a matrix (Λ ) as Λ T=ATE, which defined as the weighted color matching function (A) with lighting source (E). The matrix Λ is a 3× n matric and presents the adjusting of human perception in given light source.
Then Eq. (1) could be changed as Eq. (4).
Multiplying Λ (Λ TΛ )-1 to Eq. (4), Vector Γ could be get as Eq.(5).
Suppose
Then the color spectral data could be divided to basic spectral reflectance (eλ ) and metamerism stimulation black (Bλ ), shown in Eq.(7) and Eq.(8). That means the spectral energy distribution of any color stimulus is composed of a basic color stimulus and a metamerism spectrum black stimulation.
The tristimulus value of the color is determined by the basic color stimulus because the tristimulation of the metamerismblack spectrum is zero. So we define the diagonal matrix of R-matric as weighted matrix w(λ ), shown in Eq. (9). The color matching function and weighted matrix are shown in Figure 1.
 | Fig.1 Color matching function (x, y, z) and weighted matrix (w) |
WRMS is defined as Eq.(10).
n is spectral dimension. r is spectral color. The hat symbol denotes (
We define WGFC as Eq. (11).
r is spectral color. The hat symbol denotes (
WSS is defined by Eq.(12).
Where, r and
The Munsell Book of Coloris a collection of color patches that uniformly occupy a large gamut in perceptual space. The color chips were mounted uniformly different hue, chroma and lightness in Munsell. Therefore, we used 1269 spectral reflectance
Then we cleaned the spectral data of Munsell of 10 nm wavelength resolution and 400 nm to 700 nm wavelength interval for the human visual system is most sensitive to the wavelengths in the middle of the visual part of the spectrum.
Different spectral metrics were computed and compared with adjacent color samples in the Munsell Book of Coloris. The experiment procedure is shown as Figure 2.
 | Fig.2 The procedure of experiment |
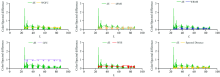
Comparing the different spectral evaluation metrics to color-difference of color samples which are the adjacent color samples in the Munsell Book of Coloris, the spectral evaluation metrics vary differently as is shown in Figure 3.
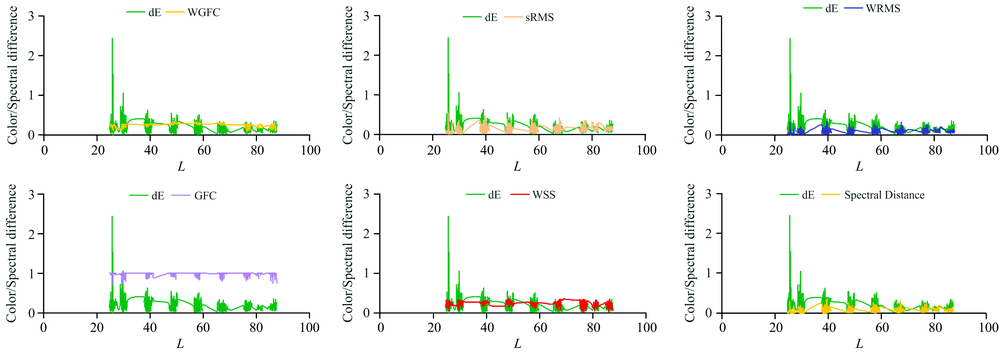 | Fig.3 Comparing Δ E2 000 to the spectral distance, sRMS, GFC, WRMS, WGFC, and WSS of measured spectrum ( |
The CIE 2000 color-difference index (Δ E2 000) is concerned as the chromatic aberration of human perception[14]. If the variability of spectral evaluation metric corresponded with Δ E2 000, the spectral evaluation metric would be considered to predict the difference of human color perception as Δ E2 000. All of weighted spectral evaluation metrics are better than unweighted metrics from the distribution of data in Figure 3.
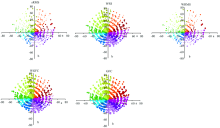
The sRMS, GFC, WRMS, WGFC and WSS of the adjacent spectral reflectance of Munsell are computed with the given formulas in reference 3-5, normalized with their maximum, and got the results of different spectral evaluation metrics in Figure 4, in which the size of bubble presents the results of spectral evaluation metric. The bigger the bubble is, the larger the result of spectral evaluation metric is. The locations of bubble are a-b values of swatch of the Munsell Book of Coloris.
 | Fig.4 The distribution of sRMS, GFC, WRMS, WGFC, and WSS of the adjacent spectral reflectance |
Shown in Figure 4, all of distribution of the spectral evaluation metrics are not uniformity. Because the size of bubble indicates the value of the spectral evaluation metric, and the adjacent color swatches of Munsell are equal perception of uniformity hue, lightness and chroma, the bubbles of Figure 4 should be looked similarly if the spectral metrics are corresponding with the color visual perception. The bubbles of sRMS and WRMS look more no uniformity than the others’ from Figure 4. That means the sRMS and WRMS are not good at performance the same different color perception responds to the same spectral error.
There are 5 graphs for the histogram of sRMS, GFC, WRMS, WGFC and WSS in Figure 5. The distribution frequencies of different spectral metrics of adjacent patches in Munsell color system are shown in Figure 5. The distribution frequencies of GFC concentrate on about 1, which makes the GFC does not vary with the change of spectral error or color perception. But the distribution frequencies of WGFC and WSS conform to Gaussian distribution approximately, that means WGFC and WSS are stable and that have probability density functions that can be expressed analytically.
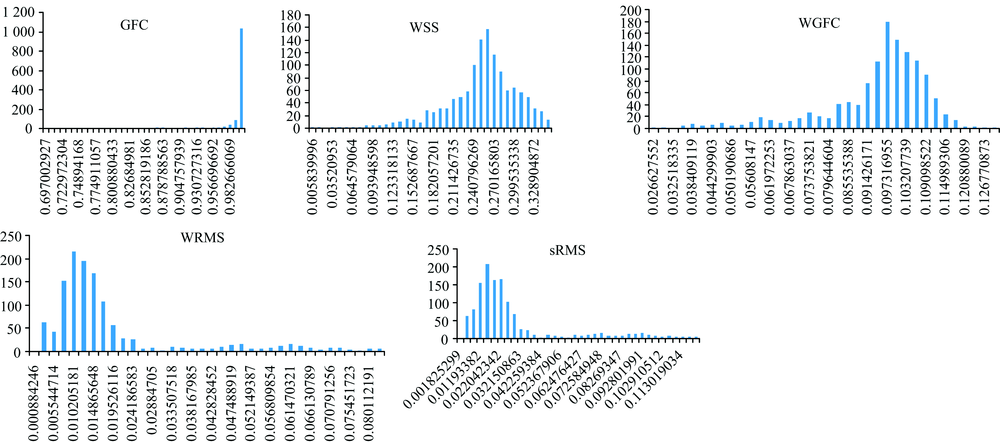 | Fig.5 Histogram of different spectral evaluation metrics with Munsell |
We compared all of spectral evaluation metrics and analysed the relationship of spectral evaluation metrics and color perception with the spectral reflectance of Munsell. Figure 6 is the relationship of hue angle of color sample and spectral reflectance metrics of adjacent patches in Munsell color.
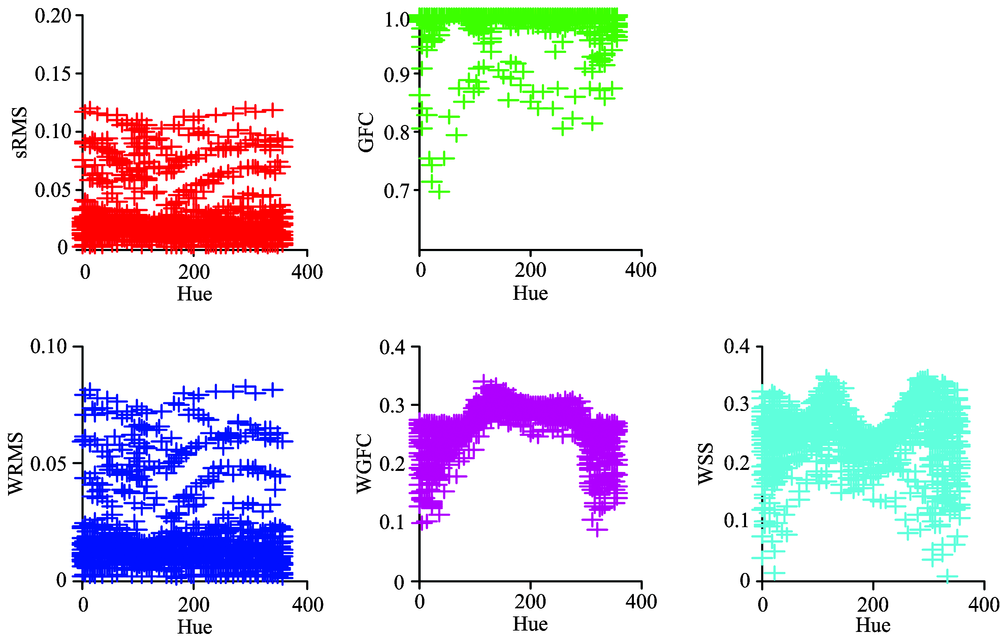 | Fig.6 Relationship of hue angle of Munsell and spectral reflectance metrics |
From Figure 6, WGFC and WSS are stablizing. Comparatively, the diagrams of WRMS and sRMS are similar, and the distributions do not vary with hue of color perception clearly. Refering to Figure 5, the histogram of different matics, sRMS, WRMS and GFC of Munsell are relative stable. WGFC of Munsell is distributed at the range of 0.09 to 0.11, and is scattered at 0 and 360 of the hue value. The similar distribution is shown at WSS. That means WGFC and WSS of Munsell are changed with the changing of color hue and the largest changing at red color.
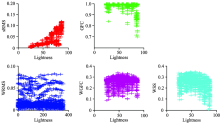
Figure 7 is the relationship of lightness of Munsell and spectral reflectance metrics. WGFC and WSS are distribted uniformly with lightness. That means that matrics could indicate the spectral difference and lightness difference at same time.
 | Fig.7 Relationship of lightness of Munsell and spectral reflectance metrics |
The spectral estimation metric is important for analyzing the precise of color spectral reconstruction and color reproduction. The spectral estimation metric presents not only the spectral error, but also the color perception when it is used for color reproduction. We proposed weighted metric that could indicate the actual human color perception and spectral error at the same time. The empirical evidence obtained shows that the values of the metrics range from the given range, and closing to the middle of the range are the conditions for good and excellent spectral matches. The human-vision weighted metrics are better than sRMS and color difference for the distinguishing the difference of human color perception and spectral error of based spectral-based color reproduction. The human-vision weighted evaluation metric solves the problem of quantitative evaluation of spectral estimation accuracy of natural spectrum matching and color spectral reconstruction.
The authors have declared that no competing interests exist.
| [1] |
|
| [2] |
|
| [3] |
|
| [4] |
|
| [5] |
|
| [6] |
|
| [7] |
|
| [8] |
|
| [9] |
|
| [10] |
|
| [11] |
|
| [12] |
|
| [13] |
|
| [14] |
|