

能量色散X射线荧光光谱检测土壤重金属砷、锌、铅和铬
[王世芳 , 罗娜, 韩平
* ]
, 罗娜, 韩平]
|
|


利用X射线荧光光谱检测土壤重金属砷、 锌、 铅和铬元素的含量。 通过分析仪器检出限和准确度, 得出仪器适用性良好。 然后, 利用二维相关同步光谱获得重金属元素的X射线荧光光谱能谱范围和变量数, 得出铅元素的能谱范围分别为10.380~10.740和12.435~12.900 keV,砷元素的能量范围是10.380~10.740和11.610~11.880 keV,铬元素的能量范围是5.310~5.520和5.805~6.015 keV, 锌元素的能量范围是8.520~8.805和9.555~9.630 keV, 铅、 砷、 铬和锌的变量数分别为57, 44, 30和26。 最后, 根据获得的能谱范围, 采用偏最小二乘回归方法建立重金属元素的X射线荧光光谱定量分析模型, 得出砷元素的模型性能最佳, 其次是铅、 锌和铬, 预测相关系数都高于0.92。 研究表明, 利用二维相关光谱获得的能谱范围有助于提高模型的预测性能和便携式X射线荧光光谱检测仪器适用于土壤重金属的原位监测。
Biography: WANG Shi-fang, (1989-), master, Beijing Research Center for Agriculture Standards and Testing e-mail: wangshifang1302@126.com
Total concentrations of As, Zn, Pb and Cr were determined in soil samples by using X-ray fluorescence spectrometry. The instrument applicability was good by analyzing the detection limit and accuracy of the instrument. Then, the energy rangesand variable numbersof heavy metal elements were obtained by using two-dimensional correlation spectroscopy. The variable numbersof Pb (10.380~10.740 and 12.435~12.900 keV), As (10.380~10.740 and 11.610~11.880 keV), Cr (5.310~5.520 and 5.805~6.015 keV) and Zn (8.520~8.805 and 9.555~9.630 keV) were 57, 44, 30 and 26, respectively. Finally, X-ray fluorescence spectrometry analysis models for heavy metal elements were established based on selected energy ranges by using partial least-squares regression. The results showed that the model performance was best for As, followed by Pb, Zn and Cr, and Rp were higher than 0.92. The study indicated that the prediction performance of model is improved using optimal energy ranges and the PXRF analyzer is suitable for in-situ monitoring of heavy metals in soil.
Agricultural soils are seriously threatened by heavy metals contamination in China. A large amount of chemicals are applied annually to agricultural soils in the form of fertilizers and pesticides. Such applications might result in increasing heavy metals in soil, particularly As, Zn, Pb and Cr and increasing potential environmental risk[1]. Heavy metals in soil are not easily degraded by microorganisms and can bio-accumulate through the food chain in humans, leading to a range of human diseases[2]. The monitoring of heavy metals in soil is not only important for environmental protection and agricultural production; but also is one of the primary components of governance and remediation of contaminated soil.
There are many different detection methods for soil heavy metals. To improve detection efficiencies, X-ray fluorescence (XRF) spectrometry was applied to the detection of heavy metals in soil[3, 4, 5]. This method features many advantages when compared with chemical analyses. It is non-destructive, cost-effective and offers extremely rapid in-situ determination of total elemental concentrations.XRF spectrometry provides a multi-element analytical method[6] for the routine non-destructive analysis of many materials with minimal sample preparation.
There are many studies on the detection of heavy metals in soil by XRF spectrometry. A multivariate calibration algorithm was utilized to establish a model of Cr concentration and the results showed that the partial least-squares regression (PLSR) model for total Cr concentration was optimal[7]. A prediction model of Pb content was established to improve accuracy by PLSR in the 10.40~10.70 and 12.41~12.80 keV ranges[8]. The wavelet threshold noise filtering method [9]and orthogonal signal correction algorithm[10]were used to improve the accuracy of the model. The concentrations of 23 chemical elements of street dust were determined by using energy dispersive X-ray fluorescence (EDXRF)[11]. The feasibility of EDXRF analysis for determination of soil heavy metals was verified by using quantitative analysis[12].
The selection of the energy spectrum range in the detection of soil heavy metals based on XRF is one of the biggest problems in current researches. The selection methods of the spectrum range have uninformative variable elimination, successive projections algorithm and so on. Here, two-dimensional (2D) correlation spectroscopy as a novel method was introduced. The generalized term “ 2D correlation” formally defines the synchronous and asynchronous correlation spectroscopy[13, 14]. 2D spectroscopy based on various static perturbations, like temperature, concentration, pressure, position, and other physical variables, applied to different systems, including polymers, biomolecules, solutions, liquid crystals, and others, have been examined. 2D correlation spectroscopy relying on transient phenomena, like chemical reactions, diffusion and other relaxation processes, have been studied[14]. Two-dimensional correlation spectroscopy generally applicable to various types of spectroscopy, including infrared[15, 16, 17, 18], Raman, and terahertz[19] spectroscopy, has been introduced.
The aim of this work was to obtain optimal models based on the energy spectrum range of soil heavy metals by using a novel method, two-dimensional synchronization correlation spectroscopy. The variable numbers of the energy spectrum range were selected based on known intensities of Pb, As, Cr and Zn fluorescence energy spectra. We explored the feasibility of quantitative analysis models for soil heavy metal elements by using PLSR in the selected energy range.
Several parameters are known to affect the quality and the precision of portable XRF (PXRF) analyses, including: sample matrix[20, 21], interfering elements, sample homogeneity, particle size[7, 22]and soil moisture[23, 24, 25]. In this paper, a total of 52 soil reference materials, purchased from National Research Center for Certified Reference Materials, the People’ s Republic of China, were employed as analysis samples. The soil samples came from Xinjiang, Neimenggu, Sichuan provinces in China, and so on.The contents of heavy metals in these reference materials have been previously detected by chemical analyses (atomic absorption spectrometry, atomic fluorescence spectrometry and X-ray fluorescence spectrometry, et al)and are available online at http://www.bzwz.com/.The XRF measurements of soil reference materials were conducted under room temperature condition (25± 1)℃ with 60% relative humidity to provide standardized measurement conditions.
The equipment used in this study was a field PXRF analyzer NITON XL3t 600 (Thermo Fisher Scientific Corporation, USA), a 40 keV X-ray tube with Ag anode target excitation source, and a Si-PIN-diode with a Peltier cooled detector. The download and export of data from the instrument were facilitated by NITON data transfer software.
EDXRF spectrometry was used to analyze the detection of soil heavy metals. The energy spectra (0~40 keV) were selected to analyze the detection of soil heavy metals.The filter of this instrument has main, high and low filter plates. The test time for each filter plate is set to 30 s. The testing range of heavy metals in each filter plate is different. The four kinds of heavy metals in this study were determined by using the main filter plate and the low filter plate. The heavy metals tested by using the main filter plate were Pb, As and Zn, whereas Cr was tested by usingthe low filter plate.
The steps for detection of heavy metals content in soil by XRF spectrometry were as follows:
Step 1. Soil standard samples were filled into a polyethylene sample cup (diameter 31 mm and height 40 mm) with a collar of fixed Mylar film (thickness 6 μ m). The polyethylene sample cup bottom was sealed by using Mylar film to ensure that there was no sample leakage. Then 2.0 g soil sample was loaded into the sample cup and compressed to provide a smooth sample surface.
Step 2. The sample cup was placed in the testing stand and the side of the cup covered with Mylar film was aimed at the instrument probe window. Sample testing was repeated 5 times. Acquisition time was 90 s.
Statistical analyses were performed by using EXCEL2010, MATLAB R2015a, 2Dshige software and Unscrambler 9.7. Linear regression was performed in EXCEL2010. 2D synchronization correlation spectroscopy was performed in 2Dshige version 1.3 software (2Dshige (c) Shigeaki Morita, Kwansei-Gakuin University, 2004— 2005). A statistical procedure of the data set directly measured from the PXRF instrument was followed using Unscrambler 9.7 (CAMO Software, AS). The PLSR quantitative models were established in MATLAB R2015a (The MathWorks, Inc., Natick, MA, USA). Simple linear regression and 2D synchronization correlation spectroscopy were introduced in some detail below.
1.3.1 Simple linear regression
For each element, a simple linear regression model was used to investigate the relationship between the real concentrations and those measured by PXRF. The relationship produced a linear model
where y is the PXRF concentration, x is the real concentration, b is the intercept of the regression line, a is the slope, and ε is the residual in the regression equation. The correlation coefficient and standard error were employed to determine instrument accuracy.
1.3.2 2D synchronization correlation spectroscopy
In this study, the static perturbation was the concentration of soil heavy metals. The correlation type was synchronous. The slice of synchronous spectra was taken at 50. The moving window size (2m+1) was 11. The draw type was contour and the counter layer was 8.
The detection limit is defined as three times the standard deviation of the blank test according to the International Union of Pure and Applied Chemistry (IUPAC, 1976). The SiO2 (analytical purity) sample testing was repeated 11 times, and the instrument detection limits were shown in Table 1. The detection limits of As, Pb, Cr and Zn were 3.95, 5.13, 16.35 and 10.20 mg· kg-1, respectively. The quantitative detection limit of Cr was the highest and the result indicated that the detection sensitivity of Cr in soil by using this instrument was relatively low. The detection limit values of the four elements were lower than the primary soil standard value in the environmental quality standard for soils of China (GB15618— 1995).
| Table 1 Instrument detection limit (n=11) |
The accuracy analysis results were obtained according to the equation:
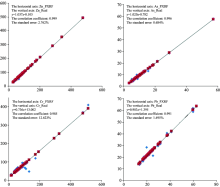
where A is accuracy, Ci is the content of soil heavy metals by the instrument and Cs is the standard value of soil heavy metals. The units of Ci and Cs are mg· kg-1. The correlation analyses between the soil heavy metals content by the instrument with the standard values using simple linear regression were shown in Fig.1.
 | Fig.1 Linear regression between soil heavy metals content by the instrument with the standard values |
The accuracies of Zn, Pb, Cr and As were 92%~105%, 70%~120%, 71%~180%, 84%~138%, respectively, according to Eq. 1. The accuracy was the lowest for Cr, although the correlation coefficient was more than 0.98 (Fig.1). The degree of dispersion and standard error for Cr were the largest. The results indicated that the detection sensitivity of Cr in soil using this instrument was relatively low and that the detection sensitivities of Zn, Pb and As in soil were good. Overall, testing heavy metal elements in soil using this instrument was feasible.
Taking GBW07405 (GSS-5) as an example, the main and low range Energy-Counts maps in the low energy spectra were shown in Fig.2. The low-range Energy-Counts map was selected to cover the 0~20 keV energy range because the energy intensities of 20~40 keV were almost 0. The heavy metal types in the different filter plates were different and the counts of heavy metal elements also showed differences. Zn and As were determined using each filter plate, and Cr was determined using low filter plate (Fig.2). K lines of Pb required high energy, but voltage of handheld instrument was not enough to stimulate the signal of high energy intensity. So L lines of Pb were analyzed in the study. Therefore, it is necessary to select the appropriate range of spectral lines to generate a quantitative analysis model of heavy metals.
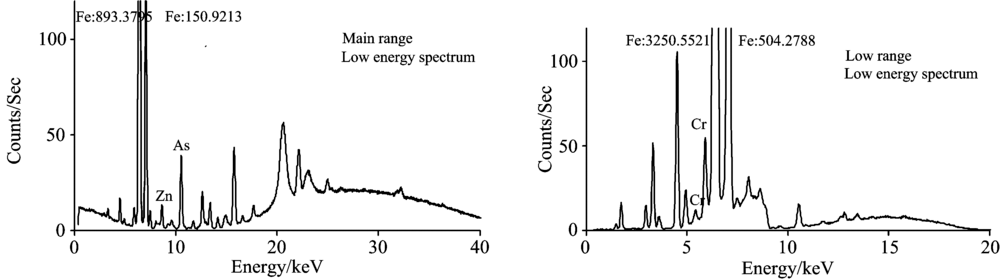 | Fig.2 Main and low range Energy-Counts maps of GSS-5 in the low energy spectra |
To reduce or eliminate the influence of non-target factors, PLSR was applied to the 52 soil standard samples to determine the accuracy of different ranges in the low energy spectra for model prediction. The results were shown in Table 2. The optimal number of regression factors for the PLSR model was determined by the correlation coefficient, R-square, root mean standard error of calibration (RMSEC) and standard error of calibration (SEC) of cross validation. The model performance depends on the comprehensive evaluation of the correlation coefficient, R-square, RMSEC and SEC. The judging standard of the model is that the correlation coefficient is close to 1 and the difference between SEC and RMSEC is the lowest. According to Table 2 and the evaluation standard, the model performance for Pb, As and Zn in the main range was good and the model performance for Cr in the low range was good. The results were consistent with the heavy metal range of the filter plate.
| Table 2 Influence of different range on the precision of the model |
Generally, it is meaningful to reduce the spectra dimension for variable detection. Calibration with the full range of variables is time consuming and irrelevant information within the spectra would affect the accuracy and robustness of the model. To meet the need for rapid detection, variable selection was applied to simplify the models and improve detection efficiency. There are many variable selection methods that have been investigated such as genetic algorithm, uninformative variable elimination and successive projections algorithm. In this paper, 2D synchronization correlation spectroscopy was introduced as a novel variable selection method to determine the variable range for detection of heavy metals using XRF spectroscopy.
Characteristic XRF energy intensities of heavy metal elements were shown in Table 3. Lα and Lβ line intensities of Zn, As and Cr are lower than 1.5 keV, which can be negligible. So Kα and Kβ of Zn, As and Cr were selected as the quantitative spectral line intensities. Kα and Kβ line intensities of Pb are higher than 70 keV. The excitation energy of the NITON XL3t 600 X-ray fluorescence spectrometer is 30 keV. So Kα and Kβ of Pb can be considered negligible and Lα and Lβ of Pb were selected as the quantitative spectral line intensities.The EDXRF Kα and Kβ line intensities were measured for all elements except Pb, for which the Lα and Lβ line intensities were measured.
| Table 3 Characteristic X-ray energy values of elements during X-ray fluorescence analysis |
To obtain the energy analysis range of heavy metal elements, representative samples of Pb (552, 61, 40, 28 and 14 mg· kg-1), As (412, 58, 21.7, 10.6 and 6.3 mg· kg-1), Zn (494, 210, 127, 66 and 22 mg· kg-1) and Cr (410, 370, 92, 65 and 43 mg· kg-1) were selected and analyzed using 2D synchronization correlation spectroscopy as a novel qualitative analysis method. The 2D fluorescence contour maps of Pb, Cr, As and Zn were shown in Fig.3 using 2Dshige software according to Kα , Kβ of Zn, As, Cr and Lα , Lβ of Pb. The diffusion range of the correlation coil was used to determine the energy range of quantitative analysis and variable numbers. The results were shown in Table 4.
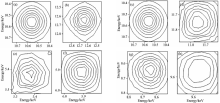 | Fig.3 Two-dimensional fluorescence contour maps of Pb (a, b), As(c, d), Cr (e, f) and Zn (g, h) |
| Table 4 Energy range and variable numbers |
The auto-correlation peak was very close to Kα , Kβ of Zn, As, Cr and Lα , Lβ of Pb in Fig.3. The contribution rates of Kα (Zn and As), Kβ (Cr) and Lα (Pb) line intensities were the largest from the correlation analysis. The energy resolution was 0.015 keV. In Table 4, the variable numbers of Pb, As, Cr and Zn were 57, 44, 30 and 26, respectively.
The quantitative analysis model of heavy metals was established according to the energy range obtained by 2D synchronization correlation spectroscopy. The 52 standard samples were divided into a calibration set (n=39) and a prediction set (n=13) using the Kennard-Stone algorithm. Multivariate calibration models were built using PLSR and the results were shown in Table 5. The correlation coefficients (Rp) of Pb and As prediction sets were higher than 0.97, Rp of Zn was 0.963 and Rp of Cr was 0.922. The differences between SEP and RMSEP of Pb, As, Zn and Cr elements were 0.040, 0.029, 0.378 and 1.933 mg· kg-1, respectively. Overall, the prediction performance of Cr was relatively poor. Given spectra within the selected energy range, multivariate calibration models for the heavy metals Pb, As, Cr and Zn can be built to achieve excellent accuracy. The results indicated that the instrument was suitable for the detection of heavy metals Pb, As, Cr and Zn in soil and the principle could be expanded for the determination of other elements.
| Table 5 Statistical parameters of the calibration and prediction set |
This work focused on the application of 2D synchronization correlation spectroscopy for ascertaining the energy range of soil heavy metals in quantitative analysis. Thus we concluded that:
(1) The instrument applicability was good based on the detection limit, accuracy and correlation analysis.
(2) Variable numbers and energy ranges were obtained using 2D synchronization correlation spectroscopy. The performance of models established using PLSR according to selected variables was excellent.
Overall, the PXRF analyzer was applicable for in-situ detection of soil heavy metals.
We would like to thank the Beijing Research Center for Agriculture Standards and Testing for technical support.
The authors have declared that no competing interests exist.
| [1] |
|
| [2] |
|
| [3] |
|
| [4] |
|
| [5] |
|
| [6] |
|
| [7] |
|
| [8] |
|
| [9] |
|
| [10] |
|
| [11] |
|
| [12] |
|
| [13] |
|
| [14] |
|
| [15] |
|
| [16] |
|
| [17] |
|
| [18] |
|
| [19] |
|
| [20] |
|
| [21] |
|
| [22] |
|
| [23] |
|
| [24] |
|
| [25] |
|