

南海砗磲Sr/Ca比值测试: XRF和ICP-OES方法对比研究
[梅衍俊1  , 邵达
, 邵达1 , 王玉宏1 , 杨仲康1 , 杨文卿1 , 高月嵩1 , 何上明2 , 郑怡2 , 李爱国2 , 孙立广1, * ]
, 邵达]
|
|


对采自中国南海的5个砗磲(1个现代砗磲、 4个化石砗磲)进行了两种高分辨率Sr/Ca比值分析。 电感耦合等离子体发射光谱法(ICP-OES)得到的Sr/Ca比值呈现出年周期变化, 且与海表面温度呈现负相关关系, 这表明Sr/Ca可作为良好的SST替代性指标。 ICP-OES是测试砗磲壳体Sr/Ca常用的方法, 但大量的样品需要钻样及预处理, 相当耗时。 而同步辐射X射线荧光分析(SR-XRF)可以克服这些缺点, 它只需要前期的样品制备, 并允许固态样品原位无损快速分析, 具有高空间分辨率(微米级)、 高灵敏度和多元素分析的特点。 在本研究中, 我们用SR-XRF方法测试砗磲样品化学元素的可行性。 据查阅, 目前尚未有类似的相关研究文献。 本文实验结果显示SR-XRF 数据能够揭示元素含量及其比值变化。 且SR-XRF测得的砗磲Sr/Ca比值与ICP-OES分析方法测得的Sr/Ca通过相关统计分析发现其显著性水平 p值(5个砗磲样品的 p值均<0.05)非常显著, 表明高分辨率SR-XRF测得的砗磲Sr/Ca比值在一定程度上代替ICP-OES分析方法的可能性非常大。 SR-XRF方法在砗磲重建古气候领域有很大的应用前景。
, SHAO Da
Biography: MEI Yan-jun, (1991-), female, Ph. D, Anhui Province Key Laboratory of Polar Environment and Global Change, School of Earth and Space Science, University of Science and Technology of China e-mail: mayyu@mail.ustc.edu.cn
Two different analysis methods were applied and compared for determining high-resolution Sr/Ca ratio profiles of one modern (live-caught) and four fossil (dead-collected) Tridacna spp. samples from South China Sea. The Sr/Ca profile of Tridacna gigas in the South China Sea determined by Inductively coupled plasma optical emission spectrometry (ICP-OES) had well defined annual cycles and was significantly, negatively correlated with sea surface temperature, implying that they can be used as good proxies of historical Sea Surface Temperature (SST). ICP-OES is an commonly used method for measuring Sr/Ca ratios in Tridacna spp. shells, but it needs ex-situ, time-consuming chemical pretreatments using variable acids and considerable amounts of sample. While the synchrotron radiation X-ray fluorescence (SR-XRF) technique does not have these shortcomings, it requires little sample preparation and allows rapid in situ analysis of solid-state samples at high spatial resolution (submicron scales), and it is characterized by non-destructive, high sensitivity, and multi-elemental distribution. In this study, we tested the feasibility of determining chemical elements in shell samples of Tridacna spp. by using SR-XRF. To the best of our knowledge, no similar studies have been reported in the literature.Our study showed that the data of SR-XRF can reflect the elements contents and their ratios change. SR-XRF derived Sr/Ca ratio profiles are significantly correlated with those from ICP-OES (P-values for five Tridacna spp. samples are all <0.05); therefore, SR-XRF can be a promising alternative to ICP-OES. And it has a broad application potential in palaeoclimate reconstructions by using Tridacna spp..
In the tropical and subtropical regions, instrumental records as well as historical documents are relatively short compared with those in temperate zones[1]. In low latitudes, dendroclimatology is also difficult to apply. Fortunately, in the tropical marine, skeletal remains of biogenic carbonates, such as corals and marine bivalve shells, are sensitive to the surrounding environmental changes[2, 3, 4, 5]. These biogenic carbonates in the growth process typically generate obvious annual lines which secrete rich climate information, and they can provide important, multi-proxy records of environmental variables[3, 4, 5] such as past seawater temperature, salinity, pH, and nutrients.
The marine bivalve, Tridacna spp., is a prominent member of the Indo-Pacific coral reef communities from Eocene to present[2]. Tridacna gigas is the largest bivalve species, it can grow to over 1 m in length and live up to 100 years, and it has hard and dense aragonite shells with daily growth lines in their inner shell layer, an ideal material for high-resolution paleoclimate reconstructions[2]. Using elemental ratios of coral and other biogenic carbonates to reconstruct palaeotemperature is an important branch of paleoclimate research, and it plays an important role in high-resolution reconstruction of the Quaternary marine climate change. A large number of studies have shown that in the non-upwelling region, Sr/Ca ratio of coral is not affected by changes in salinity and it accurately reflects changes in sea surface temperature (within the accuracy of 1 ℃)[6, 7]. Recently, Yan et al.[8] collected a modern Tridacna gigas specimen from Xisha Islands of South China Sea, analyzed the high resolution Sr/Ca ratios of its inner shell, and found that the Sr/Ca of Tridacna gigas displays regular seasonal variations and is well correlated with the SST. And further study[2] suggested that the high-resolution ICP-OES derived Sr/Ca ratios of Tridacna gigas in the South China Sea had the potential of providing a good proxy of historical SST. Sudden climate change is a hot topic in paleoclimate research. Understanding the processes and dynamics of rapid and large-amplitude climate shifts (e.g., El Niñ o— Southern Oscillation (ENSO), the Pacific Decadal Oscillation (PDO), North Atlantic Oscillation/the Arctic Oscillation (NAO/AO), Younger Dryas) is crucial for predicting such events in the future. However, studying these rapid paleoclimate variations need fine resolution in data and precision sampling.For example, in order to obtain clear signal of annual cycles, Tridacna shells need to be sampled at 0.12~0.3 mm intervals using a micro drill[2, 9]. Hori et al.[10] studied a fossil giant clam shell collected at Ishigaki Island in southern Japan for reconstruction of variations in solar insolation during the middle Holocene at a multi-hourly resolution. By using laterally high-resolution secondary ion mass spectrometer of 2 μ m resolution, a recent study[1] has reported that the Sr/Ca ratios in cultivated giant clam shells exhibit striking diurnal variation, reflecting the daily light cycle. The secondary ion mass spectrometry, however, is too expensive to be practical for such studies.
Generally, Sr/Ca, Mg/Ca and other element/Ca ratios in Tridacna are measured by inductively coupled plasma optical emission spectrometry (ICP-OES) method in previous studies[2, 9, 11]. ICP-OES has the advantages of employing a less expensive instrument and having reduced costs and relatively good resolution (200 μ m). However, it needs time-consuming off-line chemical pretreatments using variable acids and considerable amounts of sample. And an obvious disadvantage of ICP-OES is that it is an ex-situ sampling method. The synchrotron radiation X-ray fluorescence (SR-XRF) is a new method to analyze the elements under a synchrotron beam combined with measurements of XRF. It is an alternative, non-destructive technique, which requires little sample preparation, by it is highly sensitive, and it allows rapid in situ multi-elemental analysis of solid-state samples at high spatial resolution (submicron scales). SR-XRF has been applied in paleoenvironment and paleoclimate studies with encouraging results. Kurunczi et al.[12] analyzed Mussel shell samples with SR-XRF, determined the distribution of trace elements, and demonstrated the power of this technique for extracting elemental information. They also used elements/Ca ratios to compare elements distribution and changes. Frisia et al.[13] applied XRF to analyze speleothems and gain annually resolved archives of S, Mg, Si and P, and reported that speleothem S records are strongly influenced by atmospheric anthropogenic and volcanic sources. Hendy et al.[14] used XRF analysis techniques to detect distribution of trace elements in Pandora coral reef skeleton, and found that coral bleaching events occurred with low growth rate, low calcification and high skeletal density. Toshihiro Yoshimura et al.[15, 16] combined XRF and XANES to investigate element profiles of sulfur and evaluate the local environment of sulfur in the Hippopus hippopus shell, and reported that sulfur profiles had clear annual fluctuations and trace sulfur profiles may be related to environmental factors such as insolation temperature and ontogenetic changes of the calcifying fluid chemistry mediated by physiological processes. Furthermore, Tamenori et al.[17] and Nguyen et al.[18] applied SR-XRF to the study of the elemental distribution in pink corals and red corals, and found that the sulfate concentration was negatively correlated with the magnesium concentration and positively correlated with that of phosphorus. Recently, Lu et al.[19] collected two black coral specimens from the northern South China Sea to investigate the Pb contents by SR-XRF analysis. The results[19] showed that sample near the continent exhibited higher Pb levels and greater fluctuations than sample off the continent, reflecting the influence of terrestrial input and atmospheric deposition in coastal surface seawater.
In this study, we determined five Sr/Ca ratio profiles of Tridacna samples by using SR-XRF and compared these Sr/Ca profiles with those derived from ICP-OES. Our goal is to test whether XRF can be an alternative method of ICP-OES.
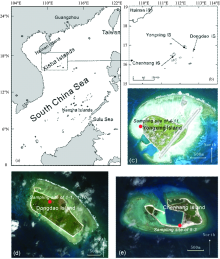
In this study, we collected four fossil Tridacna spp. samples from three islands in the Xisha archipelagos, South China Sea. The sampling locations are shown in the Fig.1. One dead specimen of Tridacna, named 4-11, was collected from the coral reef in the western of Yongxing Island, South China Sea. Two dead specimens, named 1-1 and 1-10, were collected from the interior of Dongdao Island. And one dead Tridacna spp. sample, named 5-3, was collected from Chenhang Island. The four samples were all collected on March/April 2012. The modern sample XSN was captured alive by local fisherman from the Xisha archipelagos on March 2013, and its exact site was not known. X-ray diffraction (XRD) results showed that all the Tridacna spp. shells studied here were entirely made of aragonite, and shell recrystallization did not occur, consistent with previous study on Tridacna gigas from the Ryukyu Islandson[20] and Tridacnidae species from the South China Sea[2, 9, 11]. The center of each studied shell was cut from its umbo to the ventral margin along the maximum growth axis[2, 20]. The clear inner and outer shell layers could be observed in radial sections of all Tridacna spp. samples (Fig.2). The inner shell was well preserved, but the outer layer was bio-eroded[2]. And growth bands could be observed in inner layer but not in outer layer[2]. In this study, the Sr/Ca measurements were performed on the inner layer of all Tridacna spp. samples. These shells were sectioned into slabs with an average 1 cm thickness, ultrasonically rinsed with de-ionized water, and air-dried.
 | Fig.1 The sampling map of Tridacna location (a): South China Sea; (b): Xisha Islands; (c): Yongxing Island (sampling site for 4-11); (d): Dongdao Island (sampling site for 1-1 and 1-10); (e): Chenhang Island (sampling site for 5-3) The map of c, d, e are from Google Earth |
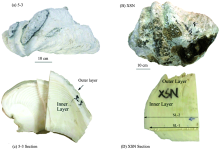
 | Fig.2 (a): Fossil Tridacna spp. sample 5-3; (b): Modern Tridacna spp. sample XSN; (c): Section of the Tridacna spp. sample 5-3; (d): Section of the Tridacna spp. sample XSN |
Each Tridacna sample’ s thickness for ICP-OES is about 1 cm. After micro drilling for ICP-OES analysis, the sample slabs were unsuitable for SR-XRF analysis, so the sample slabs for SR-XRF analysis were cut separately, and the samples for ICP-OES and SR-XRF analyses were not from the same sampling line. For ICP-OES and SR-XRF analysis, each scanning line on the sample slabs was along the sampling lines from the inner surface toward the outer surface (Fig.2).
The lines with arrows indicated the sampling lines for Sr/Ca ratios of ICP-OES (SL-1, solid line) and that of SR-XRF (SL-2, dashed line). Arrows pointed to the directions of sampling. Photos of A and B are showing the appearance of the Tridacna with a mark of 10 cm.
Samples for accelerator mass spectrometry (AMS) 14C measurements were taken in the middle of the section. The analysis was performed at Application of Isotope Laboratory, University of Georgia. The ages results are given at Table 1.
| Table 1 The dating results of Tridacna samples |
Powder samples for Sr/Ca ratio analysis were obtained along the sampling lines from the inner surface toward the outer surface of the studied shells using a micro-drill at 0.2 mm intervals[2, 11] (Fig.2). For each sample, about 0.5~3 mg material was completely dissolved in 1 mL 1∶ 1 HCl, and then diluted to 10 mL. The Sr/Ca ratios were determined by the Inductively Coupled Plasma Optical Emission Spectrometer (ICP-OES, Perkin Elmer, 2100DV) at the Institute of Polar Environment, University of Science and Technology of China[2, 11]. The instrument was equipped with CCD photomultiplier tubes that allowed the simultaneous collection of all spectral lines within the analyzed wave range[11]. This technique significantly reduces the analytical uncertainty (otherwise caused by the fluctuation of signal intensity and thus plasma instability), and improves the overall analytical precision to better than 1%[11]. Raw elemental concentration data (Ca and Sr) were drift-corrected using the sample-standard correction method described by Wei et al.[21]. External precision of a laboratory standard was ± 0.46% for Sr/Ca [(2.183± 0.001) mmol· mol-1].
Tridacna spp. samples for synchrotron radiation X-ray fluorescence (SR-XRF) analysis were first sliced into 1cm thickness slab and then polished into 2-3mm thickness (XSN: 2 mm, 1-1: 2 mm, 4-11: 2.5 mm, 5-3: 3 mm)by a polishing sheet with fine alumina grains embedded on the surface. The thickness of 1-10 sample was 1.3 cm, without being polished, because the slab had multiple cracks. Shells of such cracks could easily break when being polished. These slabs were ultrasonically rinsed with de-ionized water and air-dried before SR-XRF measurement.
SR-XRF analysis of the Tridacna spp. samples were performed at the BL15U1 beam-line of the Shanghai Synchrotron Radiation Facility (SSRF), China. The sample was mounted in a sample holder that could be moved in the X and Y directions by computer-controlled step motors. (For detailed description of SR-XRF experimental station, please visit SSRF site: http://ssrf.sinap.ac.cn/). The electron beam energy used was 3.5 GeV and the maximum stored current was 240 mA. The beam size was 80 μ m, and the X-ray energy was tuned to 16.18 keV. Fluorescence maps were analyzed by using Origin software and the element count rates were normalized to the measured intensity of the incident X-ray beam (I0). SR-XRF analysis used line scan format (using mapping scanning as needed), the step size was 80 μ m, and dwell time was a 1 second per pixel. All the spectra were evaluated by means of the AXIL program package. All the Tridacna spp. shells studied here were mainly made of aragonite, and the X-ray attenuation length of these shells was about 235.679 μ m.
For two time series, X and Y, the Pearson correlation coefficient rxy was calculated as
where n is the number of samples, and
For two time series (X and Y) with smoothing, we have to consider and adjust the autocorrelation in X and Y by using the effective sample size or effective number of independent values. Following Trenberth[23] and Bretherton et al.[24], we first calculated τ , the time between independent values (or the time to obtain a new degree of freedom) according to the following equation[25]
where rxl and ryl are the autocorrelation at lag l for X and Y. The effective number of independent values was calculated as neff=n/τ , and the student t-value for assessing significance was calculated as

In the experiment of SR-XRF, the instrument software was used to analyze signal of synchrotron radiation X-ray fluorescent irradiated samples from detector and identify the corresponding peak. These experimental data was further processed using International Atomic Energy Agency (IAEA) of AXIL computer software to determine the Tridacna’ s SR-XRF spectrum of each peak, which represents one type of element. Fig.3 showed one such spectrum. After this, the samples underwent line scanning analysis using the same scan mode. The X-ray counts of Sr and Ca elements were normalized by the incident light intensity and the actual acquisition time for the detector.
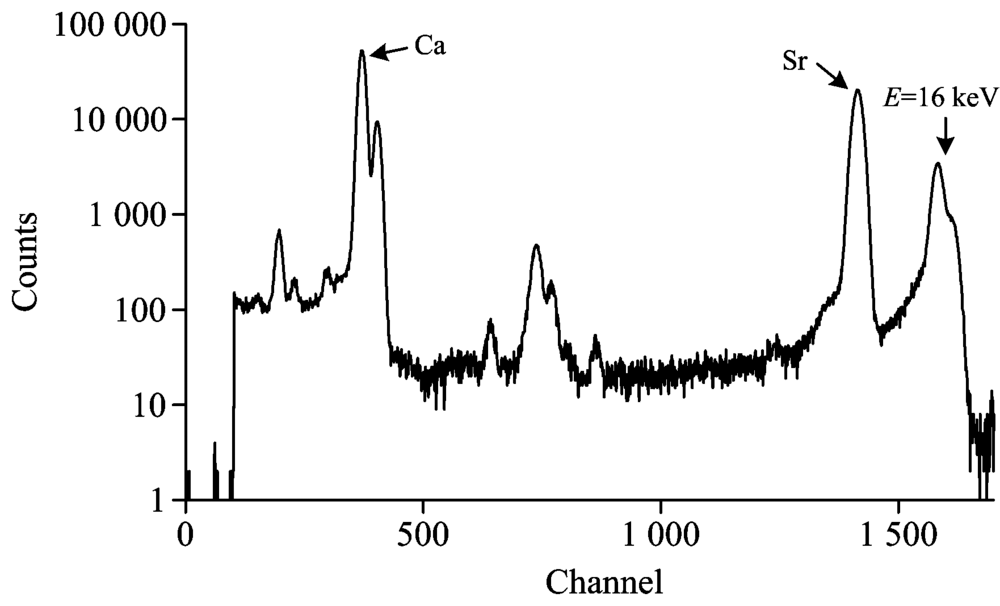 | Fig.3 X-ray fluorescence spectrum of the Tridacna spp. on the crosssection measured at 16.18 keV of excitation photon energy Measurement time was 30 s. Main components are indicated. |
The determined Sr/Ca ratio profiles from SR-XRF and ICP-OES for the five studied samples were plotted and compared in Fig.4. The spatial resolutions for SR-XRF and ICP-OES are, respectively, 80 and 200 μ m. To some extent, the Sr/Ca profiles from SR-XRF and ICP-OES have consistent seasonal variability trends and peaks and valleys are in agreement.However, there are two noticeable differences. First, the high resolution Sr/Ca ratios profiles by SR-XRF appear to be noisier than those from ICP-OES. One likely explanation is that SR-XRF may capture weekly SST variations, whereas ICP-OES more likely reflects monthly or seasonal SST variations. Second, SR-XRF profile has numerous extreme value points. This may be attributed to the crevices in the sample slab; such crevices are quite common in clam shell samples.
 | Fig.4 Comparisons of Sr/Ca ratios in Tridacna spp. obtained by ICP-OES and SR-XRF (a): 1-1; (b): 1-10; (c): 4-11; (d): 5-3; (e): XSN The black line graphs show the results of ICP-OES, and the grey line graphs show those of SR-XRF; The red bold lines represent the data of SR-XRF filtered by a 5 points moving average. |
For sample 1-1, the peaks and valleys of Sr/Ca ratios obtained by ICP-OES from 0 to 22.5 mm correspond to those of SR-XRF [Fig.4(a)]. From 22.5 mm to the end, two profiles have noticeable difference. The Sr/Ca ratios from SR-XRF show smaller fluctuations, but the downward trend is consistent with that of ICP-OES. For sample 1-10 [Fig.4(b)], there exists a phase shift in the Sr/Ca ratio profiles from two methods. One likely cause is the error in sample positioning for SR-XRF analysis. For sample 4-11 [Fig.4(c)], two Sr/Ca ratio profiles are overall in good consistence. There are some individual differences. At 8 mm, the Sr/Ca ratio from ICP-OES is at an extreme low value point, but the Sr/Ca ratio from SR-XRF is not. The noisier SR-XRF results may cover up the extreme low value point. For sample 5-3 [Fig.4(d)], two profiles are consistent between two segments: 0~16 and 25~41.6 mm. From 16 to 25 mm, there are substantial differences. Depending upon the growth conditions, Tridacna spp. may have heterogeneous fine-scale composition and structure; and the small variations in sampling position for SR-XRF and ICP-OES analysis may lead to noticeable differences in measured Sr and Ca content. For sample XSN [Fig.4(e)], the Sr/Ca profiles seem to have phase difference similar to that for sample 1-10.
To evaluate the accuracy of this method, we filtered the SR-XRF data by 5 point moving average, and then performed correlation analysis.The correlation results were shown in the Table 2. This accuracy evaluation method may be useful in the absence of international standards for SR-XRF measurement on Tridacna spp..
| Table 2 Correlation analysis results |
P-values for the correlation analysis results for five samples are all < 0.05. The results demonstrate that the correlations between the Sr/Ca ratio profiles of SR-XRF and ICP-OES are significant and the SR-XRF method is likely a promising alternative for Sr/Ca ratio analyses of Tridacna spp.. The relatively smaller correlation coefficients, in particularly for XSN and 5-3, are likely due to the fact that different sampling slabs were used for SR-XRF and ICP-OES; the sampling slab for ICP-OES cracked and could not be used for SR-XRF. The growth lines of Tridacna spp. are not straight lines, the locations of crevices common in the two sampling slabs are different, and the sampling lines for ICP-OES and SR-XRF analyses are not identical.
Synchrotron radiation is an advanced technology, and it provides a cutting-edge experimental platform for many researches. SR-XRF in situ analysis of samples has been proven to be a powerful tool for the analysis of minor elements with high resolution, and in particular it has great potential for detecting high resolution signals in records of paleoclimatic variations (ENSO and PDO). In this study, we tested the feasibility of determining chemical elements in shell samples of Tridacna spp. using SR-XRF. To the best of our knowledge, no similar studies have been reported in the literature.
SR-XRF has been applied in studying other shell samples such as corals and bivalve shells. As early as 1995, Thorn et al.[26] measured the concentrations of elements from Mn to Pb in the marine bivalve shells using SR-XRF over a time span of several months. And they suggested that this technique could be used to study historical water temperatures[26]. However, there exists one complicating issue in using SR-XRF for measurement of Sr/Ca ratios and as paleothermometry. For samples thinner than 200 pm, variation in sample thickness influences the Sr count rate and thus the Sr content, and in practice, it is difficult to prepare and polish samples to a uniform thickness within a few percent of variation[26]. One effective way to avoid such effects is to use samples thicker than the mean fluorescence depth for Sr K X-rays[26]. In that case, the Sr count rate is less affected by small variations in sample thickness[26]. In this study, the sample thickness is about 1 cm, much greater than the mean fluorescence depth for Sr K X-rays.
During the growth process, different growth conditions, such as sample porosity, organic matter content, particle size, water content, and other factors, could lead to heterogeneous distribution of elements in Tridacna spp.; and thus affect element content analysis. As described above, there are breaks in the growth lines of Tridacna samples. Nishida et al.[27] found that Scapharca broughtonii (Mollusca: Bivalvia) had growth breaks and shell oxygen isotope records indicated that the clams can form their shells at temperature higher than approximately 12 ℃ with no record of lower winter temperatures. We may think that under extreme temperatures (winter or summer), the growth of Tridacna spp. shells also may be interrupted, leading to growth breaks. All of these will affect SR-XRF analysis results, and further researches are apparently needed to examine and address these issues.
To some extent, our study showed that the SR-XRF derived Sr/Ca ratios of Tridacna spp. collected from South China Sea are in correspondence with those from ICP-OES. This demonstrates that SR-XRF is a promising method for determining Sr/Ca ratios of Tridacna spp. samples. SR-XRF method does not require sample pre-treatment; it is simple, non-destructive, and quick. What’ s more, it has high sensitivity. Therefore, SR-XRF method has broad application potential in Tridacna study. We may consider improving the way of sample preparation and sampling to carry out the exploratory study of SR-XRF method.
The authors have declared that no competing interests exist.
| [1] |
|
| [2] |
|
| [3] |
|
| [4] |
|
| [5] |
|
| [6] |
|
| [7] |
|
| [8] |
|
| [9] |
|
| [10] |
|
| [11] |
|
| [12] |
|
| [13] |
|
| [14] |
|
| [15] |
|
| [16] |
|
| [17] |
|
| [18] |
|
| [19] |
|
| [20] |
|
| [21] |
|
| [22] |
|
| [23] |
|
| [24] |
|
| [25] |
|
| [26] |
|
| [27] |
|