


三维荧光指纹技术在牛乳兽药残留检测与受热程度判别中的应用研究
[刘欢 , 刘文, 韩东海
* , 王世平* ]
, 刘文, 韩东海, 王世平]
|
|


牛乳作为一种营养全面的理想食物, 已成为人们日常生活中不可或缺的一部分, 与此同时人们也越来越关注乳制品的品质, 因此快速、 灵敏的检测方法的开发和使用显得尤为重要。 基于三维荧光指纹技术, 建立了一种牛乳品质检测与评价的新方法, 该方法可以通过三维荧光特征图谱, 得到相对应的牛乳成分信息。 和常规的荧光方法相比, 三维荧光法可以提供更丰富, 更全面的物质信息。 首先根据牛乳在不同实验条件影响下荧光强度的变化及图谱的改变, 确定了最佳的预处理条件, 接着分别对牛乳抗生素残留以及受热程度的判别进行了研究。 对于兽药残留分析, 可以检测出牛乳中含量在0.5 mg·L-1以上的新霉素; 对于牛乳受热程度判分析, 利用三维荧光技术结合平行因子法(PARAFAC)对生鲜乳、 巴氏杀菌乳及UHT灭菌乳的定性判别, 当组分数为3时, 中心连续系数可达97.63%。 因此, 三维荧光指纹技术具有快速准确的检测牛乳品质的潜力。
Biography: LIU Huan, (1988-),female, Dr., College of Food Science and Nutritional Engineering, China Agricultural University e-mail: mcgrady830@sina.com
The evaluation of milk quality is very important, which has already become a research hotspot. The non-destructive, rapid and sensitive analytical technique is urgently needed for ensuring the quality of milk. In this research, we established a new analytical technique based on three-dimensional (3-D) fluorescence spectrum, which can reflect the components information of milk with their unique fluorescence fingerprint. Compared with conventional fluorescence spectrum, the 3-D fluorescence spectrum provides more detailed and comprehensive information. By utilizing this technique, the pretreatment factors of milk are optimized by analyzing the changes of fluorescent components. Furthermore, the method can detect out 0.5 mg·L-1 antibiotic residual in milk. The 3-D fluorescence technique combined with Parallel Factor Analysis (PARAFAC) was used to evaluate the heat treatment of milk. A good consistency of 97.63% was calculated, which indicated that the developed 3-D fluorescence fingerprint technique was credible and could be utilized as a powerful tool to examine the quality of milk.
Fluorescence spectroscopy is a rapid and non-destructive analytical technique with high sensitivity and good selectivity. It can provide spectral signatures in a few seconds, which can be utilized as fingerprints of the food products. During the last decades, the fluorescence spectroscopy fingerprint technique has been widely used in analysis of the property and quality of milk[1, 2, 3]. However, fluorescence spectroscopy technique is non-selective because the fluorescence spectra are usually overlapped when analytical components with slight spectral differences. Therefore, the information contained in spectra is multivariate and creates analysis paralysis. Additionally, the fluorescence spectroscopy technique is usually carried out under single excitation wavelength, which is unsuitable for complex analytes with different excitation and emission wavelengths. For milk, there exists a series of fluorophores such as tryptophan, tyrosine, phenylalanine, nicotinamide adenine dinucleotide (NADH) and flavin adenine dinucleotide (FADH)[4, 5, 6]. Additionally, some other fluorescence products can be produced after heat-treated by Maillard reaction[7]. As a result, the fluorescence components of milk are very complicated, which means that the conventional fluorescence spectroscopy method cannot get the information of all fluorescent compounds simultaneously.
In this work, we have developed a new three-dimensional (3-D) fluorescence fingerprint technique to distinguish various fluorescence analytes in the milk simultaneously. The technique isbasedon three-dimensionalexcitation-emission matricesspectroscopy[8], which is made up of serial emission spectra by exciting under different wavelengths. The characteristic bands of fluorescent components in milk were plotted as 3-D landscapes against excitation-emission matrices in the 3-D fluorescence spectrum, which could be applied for the quantitative analysis of fluorescence compounds[9]. We optimized the experimental conditions including the concentration of the solution, solvent, temperature, pH and pretreatment condition to obtain better 3-D fluorescence fingerprint spectra to characterize the quality of milk[10]. The reliability of 3-D fluorescence fingerprint technique was verified by the Parallel Factor Analysis (PARAFAC) method. At last, we successfully evaluated the property and quality of milk by the developed method.
Raw milk was obtained from the experimental pasture of China Agricultural University; pasteurized milk and UHT milk were purchased from a commercial market in Beijing. Milli-Q water (18.2 MΩ cm) was used. All the chemicals used in the experiments were analytical reagent grade or better. Buffer solutions were prepared with acetic acid and sodium acetate. Neomycin and fluorescamine were purchased from Sigma-Aldrich.
The 3-D fluorescence spectra of milk samples were obtained by a HITACHIF-7000 fluorescence spectrophotometer with a 5 mL quartz cuvette. Excitation wavelengths were from 200 to 600 nm and the emission wavelengths were collected from 300 to 800 nm, respectively. The scanning interval was set at 5 nm and the scanning speed was set at 12 000 nm· min-1. Each sample was measured for three times.
To prepare casein precipitated milk, 0.5 mL milk was added into 4 mL acetate buffer (0.1 mol· L-1, pH 4.6) and centrifugated at 4 500× g for 15 min, then filtered through 0.22 μ m membrane to remove particulate matters and stored at 4 ℃. To get the skimmed milk, 40 mL milk was firstly putted into a 50 mL tube and centrifugated at 12 000× g for 15 min at 4 ℃. After removing the fat from the supernate, the centrifugation was repeated. All of above steps have been repeated for three times[11].
The 3-D fluorescence spectra of ten raw milk samples, pasteurized milk samples and ultra-high temperature treated (UHT) milk samples were collected by the 3-D fluorescence spectrometer, respectively. And 30× 81× 81 excitation-emission matrixes (EEMs) of these milk samples were established. Then, the EEMscat program was applied to eliminate the distractions of the Rayleigh and Raman scattering peaks in the spectra[12].
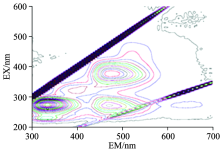
Firstly, the original information of raw milk was detected by 3-D fluorescence spectra, which would not be influenced by interference factors. As shown in Fig. 1, a series of fluorescence peaks was collected. The fluorescence peaks whose emission wavelengths were integer multiples of excitation wavelengths were induced by higher diffraction[13]. The fluorescence peaks whose emission wavelengths are twice greater than the excitation wavelengths are the secondary fluorescence peaks, which caused by the dispersion of grating. The above fluorescence peaks were interference peaks, which could not provide pivotal information. Thus, the other four fluorescence peaks which clearly identified from the 3-D fluorescence spectra at Excitation/Emission (Ex/Em): 230 nm/350 nm, 280 nm/345 nm, 370 nm/520 nm and 445 nm/520 nm were characteristic peaks of milk.
 | Fig.1 The 3-D fluorescence contour spectrum (a) and isometric projection spectrum (b) of raw milk |
It was known that tryptophan (Trp), tyrosine (Tyr), and phenylalanine (Phe) are mainly fluorescent amino acids in milk[4]. The related study showed that aromatic amino acids can be recorded with the excitation wavelengths at 290 and 250 nm, and the maximum fluorescent spectrum is located at about 340 nm[14]. Thus, the fluorescence peaks at Ex/Em of 230 nm/350 nm and 280 nm/345 nm were both the mixed peaks of amino acids. Considering the quantum yield of Phe was too low to be detected out[15], the above fluorescence peaks were mostly attributed to the aromatic amino acid Try and Tyr.
The coenzymes in raw milk, such as NADH and FADH were the derivatives of Vitamin B with strong fluorescence, which were supposed to be clearly observed in the 3-D fluorescence spectrum[16]. It had been verified that the maximal excitation and emission of FADH were 445 and 520 nm in water, respectively[17]. And the fluorescence of NADH had been monitored at Ex/Em of 330~390 nm/430 nm in rat livers by high-resolution fluorescence microscopy[18]. Additionally, the excitation wavelengths of 370 and 445 nm which assigned to NADH and FADH had been observed for milk samples when the emission wavelength was set at 518 nm[19]. All above results indicated that the fluorescence peaks at Ex/Em of 370 nm/520 nm and 445 nm/520 nm in the 3-D fluorescence spectrum could be identified as the characteristic peaks of NADH and FADH.
2.2.1 The effect of dilution ratio
To examine the influence of dilution ratios on the fluorescence intensities of Trp and Tyr1 (Y1), Trp and Tyr2 (Y1), NADH (Y2) and FADH (Y2), raw milk with different dilution ratios (diluted 0, 10, 20, 30, 50, 100, 200 times) were tested. As is shown in Fig.2, the fluorescence intensities of NADH and FADH decreased gradually with the decrease of their concentration. But, the fluorescence intensities of Try and Tyr increased firstly with dilution and reached its maximum when the milk sample diluted 10 times. The results indicated that the inner filter effect occurred in high concentration of Try and Tyr, which influenced the light transmittance, mading Try and Tyr can not absorb sufficient exciting light. Additionally, high concentration of interfering substances would scatter and absorb the exciting light, which further reduced the utilization rate of exciting light[10]. Therefore, the fluorescence intensities of Trp and Tyr increased with the exciting light utilization improving after the moderate dilution of milk. However, the fluorescence intensity of NADH and FADH was very low if the milk was diluted for too many times. In order to obtain the highest fluorescence intensity of all these fluorescent, the optimal dilution ratio of milk was 10 times, which was used for further study of the optimization of experimental conditions.
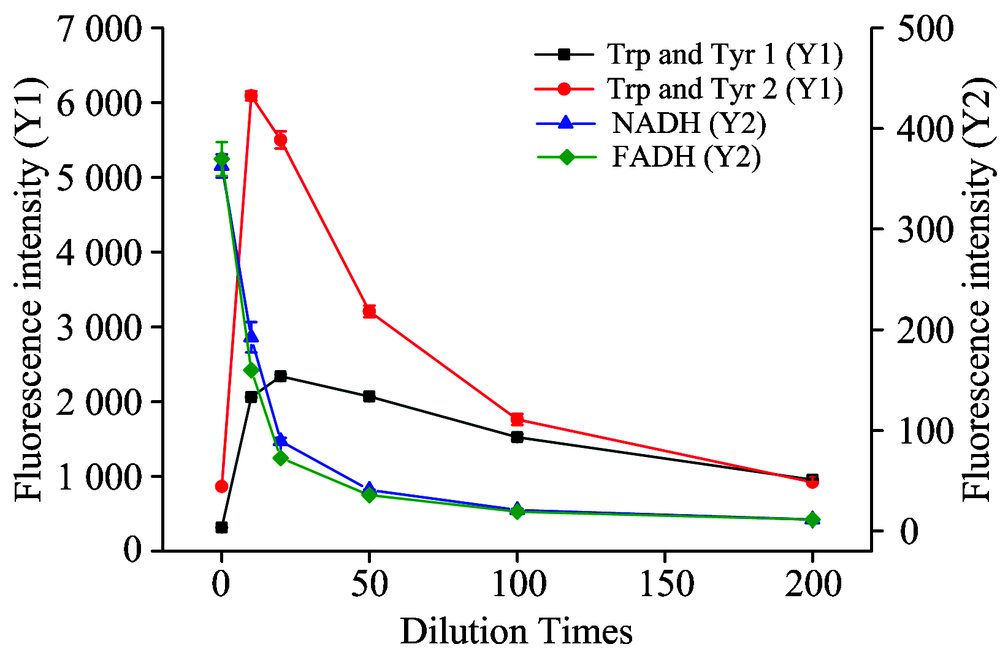 | Fig.2 Fluorescence intensity of characteristic peaks with different dilution ratiosin 3-D fluorescence spectra (diluted 0, 10, 20, 30, 50, 100 and 200 times) |
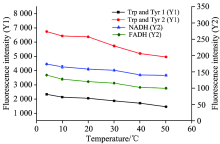
2.2.2 The effect of temperature
To investigate the effect of temperature on the fluorescence intensity of analytes in milk, the milk samples were incubated under different temperatures (from 4 ℃ to 50 ℃) for 10 min after 10 times dilution. As it shown in Fig.3, the fluorescence intensities of milk decreased slightly with temperature increasing. Under low temperature condition, the solution viscosity increasingly reduced the relaxation effect of solvent and promoted the collision frequency between the molecules in the solution, which further reduced the molecular energy and the molecular transition probability[17]. Considering the experiment error could be reduced under low temperature, 4 ℃ was used for the next investigation.
 | Fig.3 Fluorescence intensity of characteristic peaks in different temperatures (4, 10, 20, 30, 40, 50 ℃) in 3-D fmuorescence spectra |
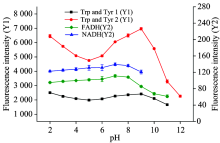
2.2.3 The effect of pH values
Nextly, we examined the effect of pH values. The raw milk was adjusted to different pH values from 2.0 to 12.0 by 0.1 mol· L-1 H2SO4 and 0.1 mol· L-1 NaOH after 10 times dilution and incubated at 4 ℃. As is shown in Fig.4, the fluorescence of NADH and FADH increased slightly with the elevation of pH values at acidic conditions and reached maximum value at pH 8.0, resulting from their different ion state under different pH values[17]. The fluorescence intensities of Trp and Tyr reached maximum value at pH 9.0 because their tryptophan residue in the hydrophobic interior was more easily exposed to the hydrophilic environment under alkaline conditions[20]. In order to obtain the high fluorescence intensity of all these four analytes, pH 8.0 was chosen for the further test.
 | Fig.4 Fluorescence intensity of characteristic peaks with different pH values (2.0, 3.0, 4.0, 5.0, 6.0, 7.0, 8.0, 9.0, 10.0, 11.0 and 12.0) in 3-D fluorescence spectra |
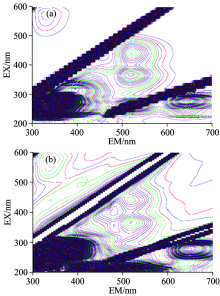
Next, we verified the sample pretreatments on the influence of the 3-D fluorescence spectrum of milk. Theun-pretreatedcasein precipitated, skimmed milk samples were detected by 3-D fluorescence spectra under optimal experimental condition. As is shown in Fig.5, a new fluorescence peak occurred at Ex/Em of 320 nm/390 nm in casein precipitated milk samples, which was induced by the generation of Maillard reaction product[7]. Additionally, the fluorescence intensities of analytes in milk samples were also increased after skimmed. Compared with casein precipitated or skimmed milk, the fluorescence intensities of un-pretreated milk samples were quite low (Fig.6). The results indicated that casein precipitation could enhance the fluorescence intensities of analytes in milk and reveal the new fluorescence peak of Maillard reaction product. And the skimming of milk was also beneficial to increase the fluorescence intensities of analytes. In conclusion, all above results reveal that the milk samples should be casein precipitated, skimmed, diluted for 11 times and incubated at 4 ℃ and pH 8.0 to collect optimal 3-D fluorescence spectra.
 | Fig.5 The 3-D fluorescence spectra of casein precipitation (a) and skimmed (b) milk |
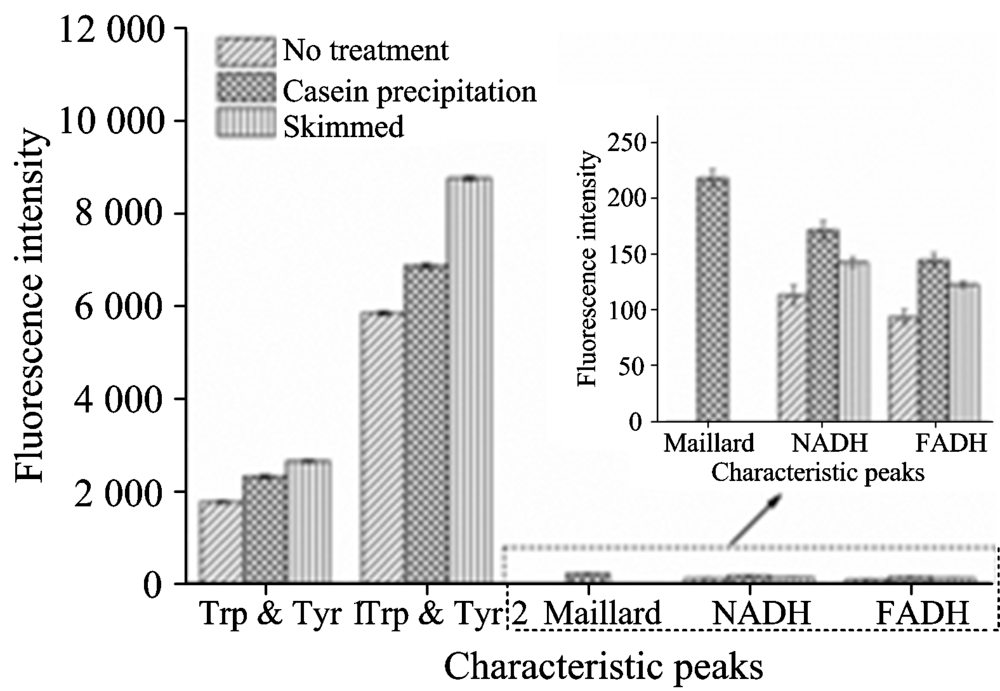 | Fig.6 Fluorescence intensity of characteristic peaks with different pretreatments (un-pretreated, casein precipitated and skimmed) in 3-D fluorescence spectra |
Neomycin cannot produce fluorescence itself, but the primary amine of neomycin can react with fluorescamine and generate strong fluorescence under neutral or alkali conditions[21]. Therefore, we investigated the ability of detecting neomycin residues in milk samples by 3-D fluorescence spectra. Different concentrations of Neomycin (0, 0.5, 1, 10, 100 mg· L-1) were added into 100mL milk and incubatedwith 0.1 mg fluorescamineat pH 8.0, 25 ℃ for 10 min. Then the solution was detected by 3-D fluorescence spectra. As is shown in Fig.7, two new fluorescence peaks appeared compared with the original spectrum (Fig.1). The maximal emission wavelengths of these two peaks were both 480 nm which was totally consistent with previous report[22]. And the fluorescence intensity of neomycin was so strong that the emission peaks of NADH and FADH were covered in 3-D fluorescence spectra.
 | Fig.7 The 3-D fluorescence spectrum of milk with neomycin (the concentration of neomycin is 0.5 mg· L-1) |
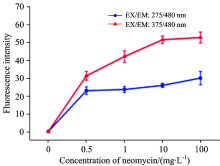
The fluorescence intensities of these two new peaks underdifferent neomycin concentrations were shown in Fig.8. The results verified thatneomycin above 0.5 mg· L-1 could be convenientlydetected by this method.
 | Fig.8 Fluorescence intensity of characteristic peaks of neomycin in milk withdifferent concentration (0, 0.5, 1, 10, 100 mg· L-1) |
Therefore, the 3-D fluorescence technique can be used as a sensitive and rapid method to detective the neomycin residue in milk. Additionally, the 3-D fluorescence technique is of great potential for further utilizing in the measurement of other antibiotics, such as penicillin, tetracycline and sulfamethoxazole[11, 23].
The fluorescence intensities of pasteurized milk and UHT milk were collected by the established 3-D fluorescence technique. As is shown in Fig. 8, the fluorescence intensities of Try and Tyr decreased, while the fluorescence intensities of advanced Maillard reaction product, NADH and FADH increased with heat treatment degree increasing. The results indicated that 3-D fluorescence technique could be utilized to determine the heat treatment degree of milk collectively.
In recent years, a variety of methods had been applied to analyze 3-D fluorescence spectra[24]. In this research, the heat treatment of milk was estimated by means of 3-D fluorescence spectroscopy combined with PARAFAC method. PARAFAC was a kind of multi-way model to decompose data. For obtained 3-D fluorescence spectra, the data arranged in an X (I× J× K) would be trilinear decomposed to A (I× F), B (J× F) and C (K× F), which referred to samples, emission wavelengths and excitation wavelengths, respectively[25]. F was the number of components. The n-way toolbox was applied with Matlab 7.0 to execute the PARAFAC program.
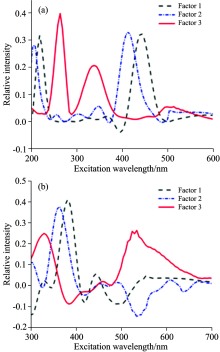
The optimal exciation and emission wavelengths of each factor were shown in Fig.10, these wavelengths are almost consistent with the real 3-D fluorescence spectra.Factor 1 and factor 2 were mainly decomposed from the peaks of amino acid and FADH, factor 3 represented the fluorescence characteristics of amino acid and NADH.
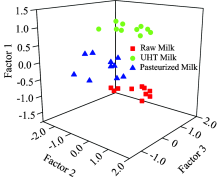
As is shown in Fig.9, the three-component model had a core consistency of 97.632 9%. All above results indicated that the developed 3-D fluorescence fingerprint technique had great potential to become a rapid and simple analytical technique to evaluate the heat treatment of milk.
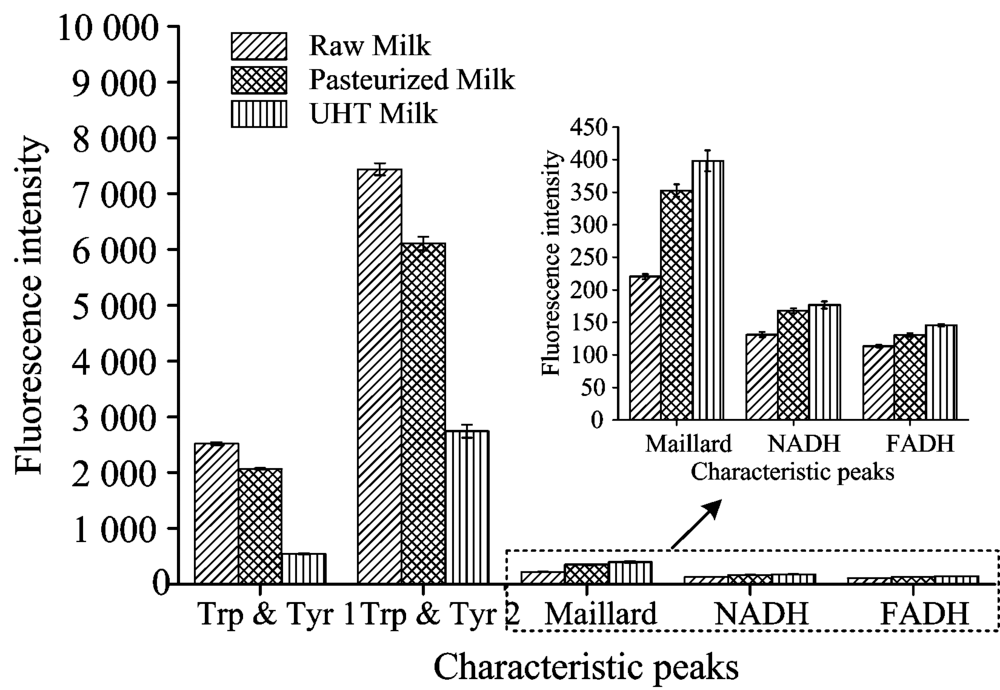 | Fig.9 Fluorescence intensity of characteristic peaks of three kinds of milk(raw milk, pasteurized milk and UHT milk) in 3-D fluorescence spectra |
 | Fig.10 Exciation (a) and emission (b) profiles of three factors obtained from PARAFAC model |
 | Fig.11 PARAFAC projection plots forthree kinds of milk (raw milk, UHT milkand pasteurized milk) |
In this research, we developed a new 3-D fluorescence fingerprint technique for milk quality evaluation. The characteristic fluorescence peaks of Trp, Tyr, NADH and FADH were established and analyzed in the original 3-D fluorescence spectra of raw milk. And the optimal conditions were investigated to improve the quality of characteristic peaks in 3-D fluorescence spectra, which found that the milk samples should be casein precipitated, skimmed, diluted for 10 times and incubated at 4 ℃ and pH 8.0 to obtain the best 3-D fluorescence spectra. Among these experimental factors, solution concentration and casein precipitation played more important roles than other parameters. Additionally, the established 3-D fluorescence fingerprint technique was successfully utilized in the detection of antibiotic residual and the evaluation of milk quality change under different heat-treated degrees. Therefore, the 3-D fluorescence fingerprint technique, as a new kind of sensitive, rapid and simple method, has a great potential for the evaluation of milk quality.
The authors have declared that no competing interests exist.
| [1] |
|
| [2] |
|
| [3] |
|
| [4] |
|
| [5] |
|
| [6] |
|
| [7] |
|
| [8] |
|
| [9] |
|
| [10] |
|
| [11] |
|
| [12] |
|
| [13] |
|
| [14] |
|
| [15] |
|
| [16] |
|
| [17] |
|
| [18] |
|
| [19] |
|
| [20] |
|
| [21] |
|
| [22] |
|
| [23] |
|
| [24] |
|
| [25] |
|