

基于二维相关红外光谱的鱼糜品质检测可行性分析
[由昭红1, 2  , 洪寒梅
, 洪寒梅2 , 成芳2, * , 杨小玲3 ]
, 洪寒梅, 杨小玲|
|


对二维相关光谱在鱼糜品质检测中的可行性进行了分析。 利用二维相关技术结合中红外光谱技术对冻融处理后白鲢鱼糜蛋白二级结构变化进行了分析。 在冻融次数和温度双重外扰的作用下对样品进行了分析。 以冻融次数为外扰的二维相关光谱分析结果揭示了鱼糜蛋白二级结构的变化顺序: α-螺旋结构、 分子内聚集的β-折叠结构→反平行的β-折叠结构→羰基结构; 基于温度外扰的二维相关光谱分析结果表明: 冻融处理1次和2次后鱼糜蛋白二级结构变化轻微。 而冻融处理3次之后鱼糜蛋白二级结构已遭到严重破坏。 结果分析还发现: 外扰温度为45℃时, 温度对羰基的影响比大大小于冻融循环对鱼糜蛋白二级结构的影响。 以上结果说明二维相关光谱技术可以探测并直观的反应出鱼糜蛋白二级结构变化程度。 如果能将这种变化程度量化, 则可以利用该技术对鱼糜新鲜度等品质进行快速检测。
Biography: YOU Zhao-hong, (1979-), female, lecturer, College of Life Sciences, Zaozhuang University e-mail: zijing1979@163.com
The feasibility of 2DCOS (two-dimensional correlation spectroscopy) in the quality inspection of surimi was tested in this study.The changes of silver carp surimi protein secondary structure induced by freeze-thaw treatment were studied in suit using 2DCOS combined with ATR-MIR (attenuated total reflectance mid-infrared). The results showed that freeze-thaw cycles accelerated the oxidation process of surimi protein. The content of α-helix and intramolecular aggregated β-sheet all decreased, however the content of the anti-parallel β-sheet increased. 2DCOS analysis under the external perturbation of freeze-thaw cycles showed the change order was: α-helix, intramolecular aggregated β-sheet→antiparallel β-sheet→carbonyl. 2DCOS analysis under the perturbation of temperature showed that the protein secondary structure has been seriously damaged after three freeze-thaw cycles. And the effect of temperature on the carbonyl group of proteins was much smaller than that of the freeze-thaw cycles. These results indicated that the 2DCOS could explore and reflect the change degree of surimi protein. If these changes can be quantified, the 2DCOS could be used to detect the freshness of surimi.
Frozen surimi is rich in protein and suitable to be made into convenient food. So it is an important food raw material. However, frozen surimi production is seasonal, in order to ensure supply, it must be stored at low temperature. Long-time frozen storage could seriously damage fish protein[1], leading to protein denaturation and loss-of-function. These changes would eventually influence the quality of surimi products, especially when the storage conditions was not stable[2]. Because unstable storage condition usually causes freeze-thaw cycles, and results in serious surimi recrystallization, fat oxidation, decreased freshness, reduced soluble protein content and surimi gel forming ability, and also ultimately affects the flavor and texture of surimi products. Freeze-thaw cycles damags the structure of cod muscle cells[3], reduces the activity of Ca2+-ATPase[4], the content of sulfhydryl group and protein solubility in white shrimp muscle[5]. And it also decreases the shear force of tiger shrimps, damaged the muscle fibers[6]. To surimi gel, the breaking force, deformation and water-holding ability[4] decrease with the increasing freeze-thaw cycle numbers, which suggested that during the freeze-thaw cycles treatment, the proteins undergo denaturation. So we can preliminarily determined the quality of surimi and surimi product through analysis of protein denaturation. The traditional methods to study surimi protein secondary structure change and monitor surimi quality need the protein to be purified. Protein purification need many chemical reagents and will affect the protein structure. So it is very meaningful to develop a fast, nondestructive and environmentally friendly method.
Spectral method is a new rapid nondestructive method, and 2DCOS is one of them, which is an extension of the original 2D correlation spectroscopy. 2DCOS was firstly developed by Noda[7]. Compared with traditional one dimension spectra collected from some complicated biological materials, the 2DCOS could enhance spectral resolution because it spread spectral peaks over the second dimension and the asynchronous correlation spectra could separate severely overlapping bands[8]. It could also probe the information of sample molecular induced by external disturbance, such as the order of spectral intensity changes, molecular interactions, band assignments, and band correlation between different kinds of spectroscopies. And this information usually could not be provided by one dimension spectrum. Recently 2DCOS has been widely applied with NIR[9], MIR[10, 11], and Raman[12] spectra to carry out studies of various kinds of materials such as basic molecules, polymers[13], carbohydrate[13], protein[11, 14], and even water[15]. These studies included not only structural analysis but also quality testing.
Inorder to explore the feasibility of 2DCOS in the surimi quality inpection, this study carried out an in suit investigation about the changes of surimi protein secondary structure induced by freeze-thaw cycles using ATR-MIR and 2DCOS.
Frozen surimi from silver carp containing approximately 4% sorbitol and 4% sucrose as cryoprotectant was bestowed by Zhejiang Haichuan Aquatic Products Co. Ltd. Blocks of frozen surimi were subdivided into approximately 0.5 kg portions. Each portion was placed in a two layer laminated plastic bag (polyolefin), sealed and subjected to a prescribed freeze-thaw schedule: the portions were placed in a -30 ℃ freezer for 48 hours and then in a 4 ℃ cooler for 12 hours to thaw. They were again placed in a -30 ℃ freezer for 48 hours to refreeze. For evaluation, a total of four freeze-thaw cycles were made and the first cycle was marked as 0 cycle. Such abusive treatment was perhaps not representative of conditions during normal surimi storage but could normally occur during a long period of storage or transportation. After each cycle, one portion was taken out and used to carry out ATR-MIR spectra collection.
All spectra were collected using a Fourier transform infrared (FTIR) spectrometer system (Thermo Nicolet Corporation, Madison, WI, USA) equipped with a liquid nitrogen-cooled MCT (mercury-cadmium-telluride) detector. This spectrometer system also provides an removable inverted ATR detection device equipped with a single bounce germanium crystal. The collected samples were placed on the ATR plate and clamped between the ATR plate and germanium crystal. Before collecting the spectrum, we need to create a suitable pressure through pressure numerical display control operation, in order to make sure that no air is trapped between the samples and the ATR crystal.
The spectrometer was controlled by Omnic picta Software and all spectra were collected under the same ATR pressure. The spectra were collected over the range from 650 to 4 000 cm-1 at a resolution of 4 cm-1. The number of scans for each measurement was 64 resulting in a total integration time of 12 s. Each spectrum of the sample was converted to absorbance units using a single-beam background spectrum collected of a clean, dry ATR crystal. Before spectral acquisition of each sample, the ATR plate and the germanium crystal were cleaned with analytical grade absolute alcohol and then dried. A RT600/HW temperature controller (Huozi Instrument Technology Shanghai Co., Ltd.) was arranged to perform the thermal perturbation at a steady temperature (45 ℃) for 60 min. And the series of thermo-perturbation dynamic spectra were collected at each interval of 5 min (Al-Jowder and others 2002).
Two dimensional correlation IR spectra were calculated through two dimensional correlation analysis software (2D shige version 1.3, designed by Shigeaki Morita, Kwansei-Gakuin University).
2.1.1 Raw mid-infrared spectra analysis
The mid-infrared spectra of four kinds of surimi samples in the full range were shown in figure 1. Protein is the main functional and nutritional component of surimi. There were 9 amide bands in mid-infrared spectra of protein[16], and the first three amide bands were of great significance to protein analysis. The amide I vibration (near 1 650 cm-1), mostly aroused from the C=O stretching vibration, with minor contributions from the C— N stretching and N— H bending vibration[17]. The amide Ⅱ vibration (near 1 550 cm-1), mostly aroused from the N— H bending and CN stretching vibration[18]. The amide Ⅰ and amide Ⅱ were commonly used for secondary structure analysis, because they were related to the secondary structure of the backbone and hardly affected by the nature of the side chain[19]. In polypeptides, the amide Ⅲ vibration depended on side chain structure and could be used for secondary structure prediction[18].
Figure 1 showed the average ATR-MIR spectra of surimi samples experienced different freeze-thaw cycles. From figure 1 we could see the trends of all infrared spectrums were similarly, there are some differences only in the peak strength of the different infrared spectrum. The band near 3 400 cm-1 usually originated from water; the band near 3 290 and 1 220~1 800 cm-1 reflected the changes of protein; the weak band near 2 965, 2 833 and 2 874 cm-1 was usually characteristic of disulfide bond or C— H in aliphatic chain. The formation of disulfide bond was one oxidative denaturation indicator of proteins[20].
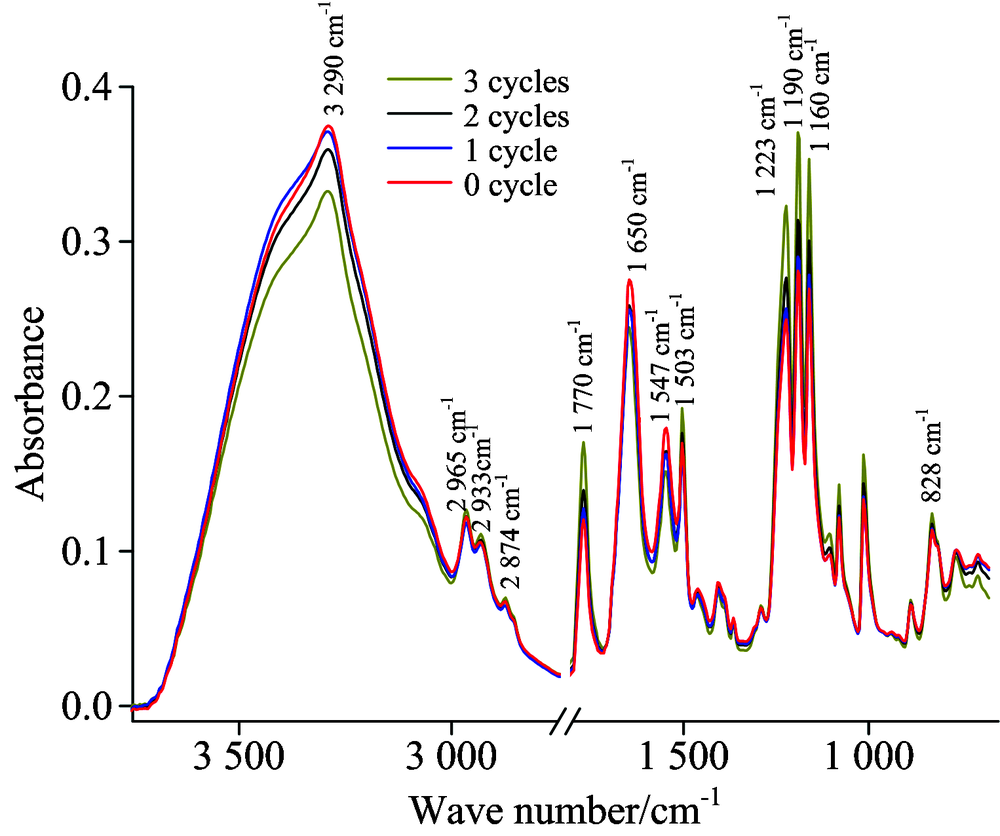 | Fig.1 The average ATR-MIR spectra of surimi samples |
The band near 3 290 cm-1 was aroused by hydrogenated N— H stretching vibration[21]; the band at 1 770 cm-1 was the characteristic absorption peak of C=O it strengthened with the increasing freeze-thaw cycle numbers indicating that the carbonyl reaction occurred to surimi protein during the freeze-thaw cycles. And the band at 1 770 cm-1 was also an oxidative denaturation indicator of proteins in meat products[22]. The major absorption peaks in amide Ⅰ (1 700~1 600 cm-1) located near 1 650 cm-1, which was assigned to α -helix[23], and the peak intensity decreased gradually with increasing freeze-thaw cycles. That indicated the α -helix in surimi protein was destroyed by freeze-thaw treatment, and the result was consistent with the results of previous study[23].
Two notable band near 1 547 and 1 503 cm-1 were observed in amide Ⅱ . The band at 1 547 cm-1 was assigned to α -helix, and its’ changing tendency was in accord with the band at 1 650 c
In amide Ⅲ the assignment of protein secondary structure were as follows: The region from 1 330 to 1 290 cm-1 was related to α -helix, the region from 1 270 to 1 245 cm-1 was assigned to random coil and the region from 1 250 to 1 220 cm-1 was aroused by β -sheet. The band near 1 223 cm-1 belonged to the region of β -sheet which increased with increasing freeze-thaw cycles.
From the analysis of the original infrared spectra, we could conclude that freeze-thaw cycle accelerated the surimi protein oxidation, the content of C=O disulfide bond increased, the hydrogen bonds were broken down after freeze-thaw cycles. Among the secondary structure of surimi protein, the content of α -helix decreased, and the content of β -sheet increased after freeze-thaw treatment.
2DCOS was calculated through two dimensional correlation analysis of a series of spectra collected under an external disturbance, including temperature, pressure, or consistence etc[8]. 2DCOS included synchronous and asynchronous correlation and the peaks were divided into autopeaks and cross peaks[7]. On the synchronous 2D correlation spectrum, autopeaks are all positive and always arise along the diagonal line; while cross peaks are located at the off-diagonal position and the cross peaks can be either positive or negative. As long as the change at a region reaches a cestain extent, a strong autopeak will appear, however the region that remaining nearly constant develops weak or no autopeak. A negative cross-peak indicates that the intensity changes at two wavelengths are totally different, that is to say when the intensity of the peaks at one wavelength is increasing while the other is decreasing; the positive cross-peak demonstrates that changes at two different wavelengths are coincident increasing or decreasing. The synchronous 2D correlation spectrum is symmetrical against the diagonal line, and the meanings of symmetrical cross-peaks are similar. On the asynchronous 2D correlation spectrum, only some cross peaks present at off-diagonal positions, and antisymmetric against the diagonal line. The positive asynchronous cross-peak (ν 1, ν 2) illustrated that the change of the intensity observed at wavenumber ν 1 occurs earlier than that of wavenumber ν 2, while the negative asynchronous cross-peak illustrate the opposite. The detailed interpretations about the theory and application of the 2D correlation spectroscopy are provided by Noda.
2.2.1 2DCOS spectra analysis perturbed by freeze-thaw treatment
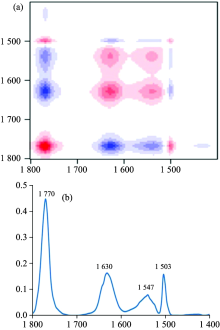
Figure 2 showed the 2D synchronous correlation spectrum [figure 2(a)] and the corresponding slice spectra extracted along diagonal line [figure 2(b)] externally disturbed by freeze-thaw cycles. In 2D correlation MIR spectrum, the red areas represented autopeaks and positive correlation peaks, while the blue areas represented negative correlation.
 | Fig.2 2D synchronous correlation spectrum (a) perturbed by freeze-thaw treatment and the corresponding slice spectra extracted along diagonal line (b) externally disturbed with freeze-thaw cycle |
From the 2D synchronous correlation spectrum and the corresponding slice spectra, we could see four autopeaks (located at 1 770, 1 630, 1 547 and 1 503 cm-1 respectively) and their correlation peaks. Carbonylation was one of the important indexes for protein oxidation[25]. The intense autopeak at 1 770 cm-1 (assigned to C=O groups) confirmed again that freeze-thaw cycle treatment lead to serious protein carbonylation in frozen surimi. That indicated freeze-thaw cycle treatment accelerated the surimi protein oxidation. The autopeak at 1 630 cm-1 was assigned to extended chain that connected the helical cylinders[23] or intramolecular aggregated β -sheet structures[21]. The autopeaks at 1 547 and 1 503 cm-1 were aroused by the changes of α -helical and N— H structures asymmetric variable angle vibration. According to the above analysis and the theory of the 2D correlation spectroscopy, the cross-peak between 1 547 and 1 503 cm-1 was negative, and the α -helical structure was damaged by freeze-thaw cycle treatment, and the content of α -helical structure in surimi protein decreased, so the symmetric variable angle vibration of N— H structures strengthened with the incremental freeze-thaw cycles. The symmetric variable angle vibration of N— H originated from and this maybe related to the breakdown of hydrogen bonds.
Similarly, the cross-peak between 1 770 and 1 503 cm-1 was positive, so the content of C=O groups increased after freeze-thaw cycle treatment. The cross-peak between 1 630 and 1 770 cm-1 was negative that meant the band at 1 630 cm-1 was weakened by freeze-thaw treatment. Based on the analysis of the second derivative MIR spectra of surimi samples, the intramolecular aggregated β -sheets exhibited a strong band near 1 694 cm-1 (figure 2), which all decreased with increased freeze-thaw cycles, so we could conclude that the band at 1 630 cm-1 should be assigned to intramolecular aggregated β -sheet structures instead of extended chain that connect the helical cylinders[23].
From the 2D asynchronous correlation spectrum [figure 3(a)] and two corresponding slice spectra which sliced at 1 503 [figure 3(b)] and 1 770 cm-1 [figure 3(c)] respectively, we can see five positive cross-peaks including (1 630, 1 770), (1 547, 1 770), (1 503, 1 770), (1 630, 1 503), and (1 547, 1 503) cm-1.
The positive cross-peaks in Figure 3(c) illustrated that the intensity change of the bands at 1 630, 1 547 and 1 503 cm-1 occurred earlier than that of 1 770 cm-1; similarly, the positive cross-peaks in Figure 3(b) illustrated the intensity changes of the bands at 1 630 and 1 547 cm-1 occurred earlier than that of 1 503 cm-1. So the change order is: 1 630, 1 547 cm-1→ 1 503 cm-1→ 1 770 cm-1 (The peaks in front of the arrow changed before the peaks behind the arrow).
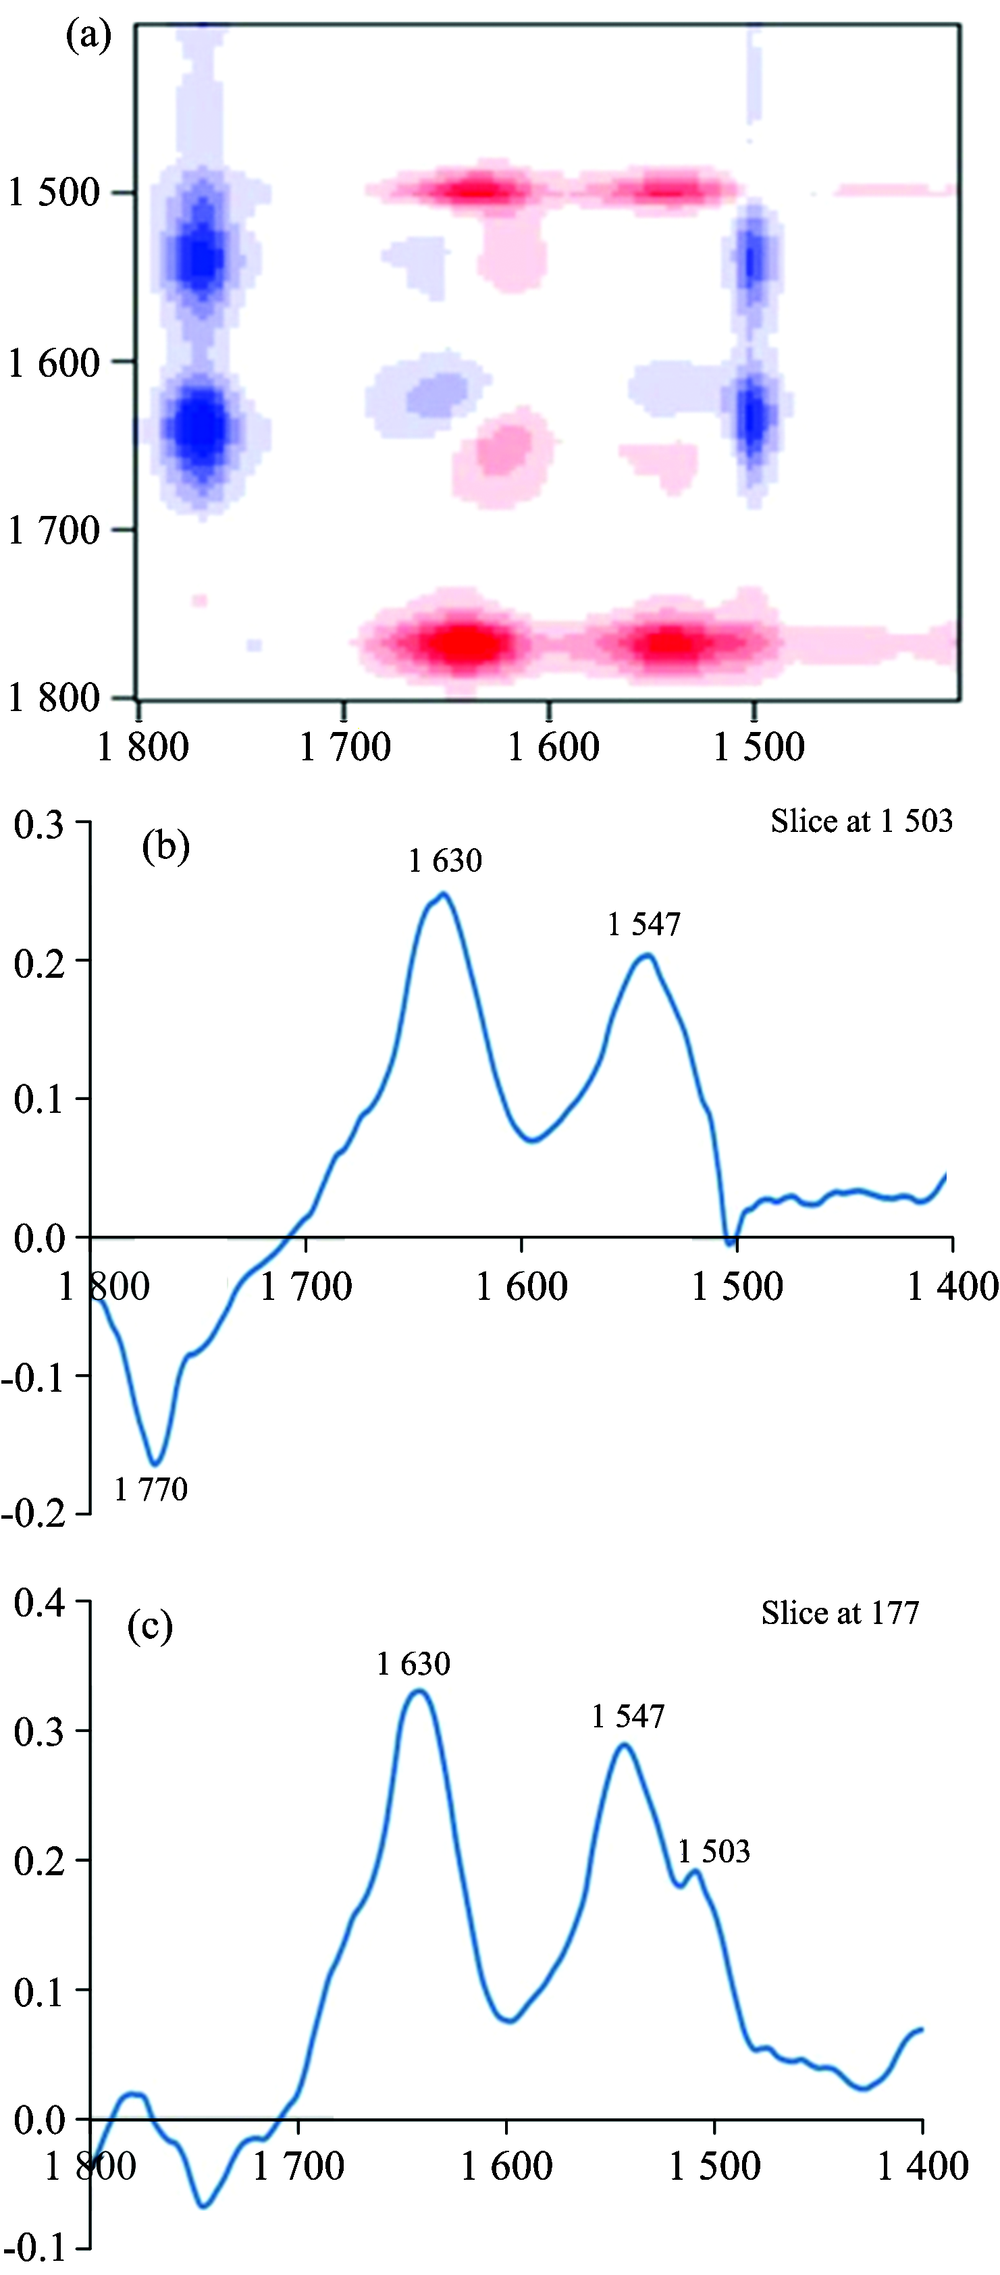 | Fig.3 2D asynchronous correlation spectrum (a) perturbed by freeze-thaw treatment and the corresponding slice spectra extracted along 1 503 cm-1(b) and 1 770 cm-1(c) externally disturbed with freeze-thaw cycle |
For surimi protein the absorption peaks at 1 630, 1 547, 1 503, 1 770 cm-1 were assigned to intramolecular aggregated β -sheet, α -helical, antiparallel β -sheet and C=O groups respectively. So during the freeze-thaw cycle treatment, the structure of intramolecular aggregated β -sheet and α -helical changed firstly, the content of them decreased; then the structure of hydrogen bonds changed, the content of it decreased; and at last the carbonyl reaction occurred and the content of C=O groups changed.
2.2.2 2DCOS spectra analysis perturbed by constant temperature
In order to investigate the damage degree of each freeze-thaw cycle to surimi samples, we collected the series thermo-perturbation dynamic MIR spectra of four surimi samples which experienced 0, 1, 2, and 3 freeze-thaw cycles respectively.
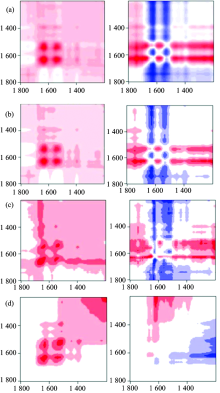
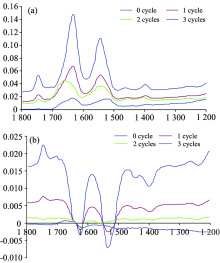
Figure 4 showed the 2D synchronous correlation spectrum and the corresponding 2D asynchronous correlation spectrum of surimi samples experienced different times of freeze-thaw cycle. Figure 5(a) showed the slice spectra of the 2D synchronous correlation spectrum in figure 4 extracted along diagonal line. Figure 5(b) showed the slice spectra of the 2D asynchronous correlation spectrum in figure 5 extracted along 1 639 cm-1.
 | Fig.4 2D synchronous and asynchronous correlation spectrum of different surimi samples externally disturbed constant temperature at 45 ℃ (a): 0 cycle; (b): 1 cycle; (c): 2 cycles; (d): 3 cycles |
 | Fig.5 The slice spectra of the 2D synchronous (a, extracted along diagonal line) and asynchronous correlation spectrum (b, extracted along 1 639 cm-1) in figure 4 |
If the secondary structure of surimi protein had been damaged by freeze-thaw treatment, it could not form effective three-dimensional network during heat preservation at 45 ℃, and the free water in surimi could not be locked effectively, a gel with high elasticity could not be by made using this kind of surimi. And the 2D synchronous and asynchronous correlation spectrum calculated from the series thermo-perturbation dynamic MIR spectra of this kind of surimi samples presented no obvious autopeaks and cross-peaks; If the surimi protein was undamaged, effective three-dimensional network could form to lock the free water in surimi during heat preservation at 45 ℃, and then a gel with high elasticity was achieved. And the 2D synchronous and asynchronous correlation spectrum calculated from the series thermo-perturbation dynamic MIR spectra of the undamaged surimi samples would present obvious autopeaks and cross-peaks. So from the intensity of autopeaks and cross-peaks in 2D synchronous and asynchronous correlation spectrum calculated from the series thermo-perturbation dynamic MIR spectra of the surimi samples, we could judge the damage degree of surimi protein.
From figure 4 we could see the positions of the autopeaks and cross-peaks did not change, while the intensity of the peaks declined after each freeze-thaw treatment. The sliced spectrum in figure 5(a) and (b) showed the changes much more clear. In the 2D synchronous and asynchronous correlation spectrum of surimi experienced 0 freeze-thaw cycle, the intensity of autopeaks and cross-peaks were the strongest; and the intensity declined gradually after each freeze-thaw cycle treatment; the autopeaks and cross-peaks became significant after 3 freeze-thaw cycles treatment, which implied that the surimi protein was denatured seriously after 3 times of freeze-thaw treatments, and at the same time the gel-forming ability of surimi was greatly weakened. Many studies also showed that the cooking loss, water-holding capacity and shear force were significantly decreased after many times of freeze-thaw cycle treatments (Wu Xiao and orhers 2012; Xia and orhers 2010; Chen and orhers 2013; Korzeniowska and orhers 2013). These parameters reflected the gel-forming ability and the quality of surimi protein.
There was another autopeak attracted our attention, it was the autopeak at 1 770 cm-1. In the 2D synchronous correlation spectrum externally disturbed with freeze-thaw cycles (Figure 2), the autopeak at 1 770 cm-1 was sharp and obvious, however in figure 4 and figure 5, this autopeak was not so obvious. It indicated that the effect of temperature at 45 ℃ on the carbonyl group of proteins was much smaller than that of the freeze-thaw cycles.
This paper studied the influence of freeze-thaw cycles on the secondary structure of surimi protein from a new perspective. By using 2DCOS, the change order and change degree of the secondary structure of surimi protein could be displayed roughly. From above statement, we could conclude that freeze-thaw cycles accelerated the oxidation process of surimi protein. The peak of carbonyl absorption and disulfide bonds was significantly enhanced due to the increased freeze-thaw cycles. The intramolecular aggregated β -sheet and α -helical were all decreased, however the content of the anti-parallel β -sheet was increased. There was no obvious change in the structure of the β -turn and random coil; Two-dimensional correlation ATR-MIR spectroscopy analysis under the external perturbation of freeze-thaw cycles showed that the α -helix structure and intramolecular aggregated β -sheet structure were affected firstly and the content decreased, while the content of antiparallel β -sheet structure increased, this was probably due to the transform between α -helix and antiparallel β -sheet structure. And then the content of carbonyl increased. The change order was: α -helix, intramolecular aggregated β -sheet antiparallel β -sheet→ carbonyl; Two-dimensional correlation ATR-MIR spectroscopy analysis under the external perturbation of temperature showed that, compared with surimi experienced one freeze-thaw cycles, the auto correlation peaks and cross peaks of surimi samples experienced two and three freeze-thaw cycles respectively, and they all became less obvious, indicating that the protein secondary structure has been seriously damaged. And the effect of temperature at 45 ℃ on the carbonyl group of proteins was much smaller than that of the freeze-thaw cycles. These results indicated that the surimi quality could be evaluated through two-dimensional correlation ATR-MIR spectroscopy analysis under the external perturbation of temperature.
The authors have declared that no competing interests exist.
| [1] |
|
| [2] |
|
| [3] |
|
| [4] |
|
| [5] |
|
| [6] |
|
| [7] |
|
| [8] |
|
| [9] |
|
| [10] |
|
| [11] |
|
| [12] |
|
| [13] |
|
| [14] |
|
| [15] |
|
| [16] |
|
| [17] |
|
| [18] |
|
| [19] |
|
| [20] |
|
| [21] |
|
| [22] |
|
| [23] |
|
| [24] |
|
| [25] |
|