
基于烟叶电子鼻-近红外数据融合的支持向量机分类判别烟叶年份
[张浩博1  , 刘太昂
, 刘太昂2 , 束茹欣1 , 杨凯1 , 叶顺1 , 尤静林2 , 葛炯1, * ]
, 刘太昂]
|
|


提出了一种基于烟叶近红外光谱(NIR)和烟叶电子鼻(EN)融合数据的烟叶年份判别的支持向量机分类模型。 在NIR和EN数据融合的基础上, 利用遗传算法来进行变量选择, 再建立烟叶年份判别支持向量机模型, 所得到的烟叶判别模型在训练集和独立测试集上都具有较高的准确率。 建立的烟叶判别NIR-E-SVM模型的建模准确率达到100%, 留一法准确率达到98.55%, 对未知样本的预报准确率为90%。
Biography: ZHANG Hao-bo, (1983-), engineer, Technology Center of Shanghai Tobacco Group Co., Ltd. e-mail: zhanghb@sh.tobacco.com.cn
Here we proposed a new simulation model constructed by support vector machine based on near infrared spectroscopy(NIR)and electronic nose (EN) data in order to predict tobacco year. After combining the data of NIR and EN, a genetic algorithm was used to analyze and pick the relevant variants to decrease variants in the calculation. The proposed model shows a high accuracy in both the training set and the independent test set. The NIR-EN-SVM model reached the accuracy of 100% and LOOCV’s accuracy reached 98.55%. The accuracy of NIR-EN-SVM model to unknown samples is 90.00%.
The quality of tobacco can be greatly affected by natural growing conditions such as soil, climate, using of fertilizer and pesticide etc. Especially some chemical compounds in the tobacco leaves such as nicotine, saccharide, nitrogen as well as some trace element such as magnesium, copper, zinc, calcium etc. may change greatly by these environmental factors[1]. In addition, during the certain process of leave seasoning, certain chemical reaction will take place. Tobacco leaves that produced in different years show slight difference in the taste even these plants are growing in the same area[2]. This is due to different environmental conditions that plants went through which finally results in differences in chemical composes. In order to control the quality of tobacco, the analysis of chemical component’ s change in different year is vital. The result of the research will finally help to classify the major variables index of tobacco leaves and give guideline to maintain the quality. Normally, the detections of different compounds as nicotine, nitrogen, total sugar[3] etc. are laborious and time-consuming, which require harmful reagents and expensive equipment. The trend of using computer based support vector machine (SVM) method shows strong potential in overcoming these drawbacks and attracts interest of numerous researchers[4, 5].
NIR spectroscopy technology is a simple, fast and non-destructive analyzing method that can measure the quality and compositional attributes of many substances[6]. The tobacco leaves contain abundant bond as C— H, N— H and C— H so that infrared spectra is a useful tool to analyze them[7, 8]. For instance, T. Chao used NIR combined with wavelet transformation based calibration method to determine the total sugar in tobacco leaves[9]. Electronic nose (EN) is frequently used in odor distinguishing[10]. It contains sensors that is able to recognize and detect odors in complex samples such as: fragrances[11], foods[12], bacteria[13] etc. Therefore, EN turns out to be a promising tool for tobaccos’ characterization and classification. For instance, Maria Rambla-Alegre et al. built new instrumental consisting EN with gas chromatography for cigarette smoke character recognition[14].
Here we combine the NIR with EN, then a prediction model of tobacco producing year was constructed by SVM (NIR-EN-SVM). In this work, the original spectrum and electron nose data were combined. Then genetic algorithm was applied to select features, the prediction model was constructed by SVM. To the best of our knowledge, it is the first time that the model of predicting tobacco year has been constructed by combing NIR and EN data together with SVM calculation method. By using the proposed method, the prediction accuracy of unknown samples reaches 90%. For comparison, the NIR-SVM and EN-SVM model were constructed respectively. The proposed method shows higher accuracy than the two models mentioned above.
1.1.1 Sample preparation
The leaves of cigarettes samples (n=178) were collected from China National Tobacco Corporation during 2010— 2013. All 178 samples were randomly divided into two groups, which were the training data set (n=138) and the independent test data set (n=40), respectively. The detailed information of sample origins and the distribution of producing year was shown in Table 1. Each of the cigarette leaves’ sample was about 50 g and stored at room temperature.
| Table 1 Description of the grades of samples used in the present study |
1.1.2 NIR analysis
The samples were oven-dried at 60 ℃ for 48 h and the dry samples were ground in a cyclone mill. All the cigarettes samples were scanned on a Nicolet Antaris FT-Near Infrared Analyzer (ThermoElectron Corp., ) equipped with an integrating sphere. Samples were put in a quartz cup (48-mm inner diameter) and subsequently scanned 64 times with 3 replications over 1 000 to 2 500 nm at their solution of 4 cm-1. Mathematical processing was performed using TQ Analyst software (Thermo Nicolet Corp., ). Figure 1 presents NIR pattern of samples produced in different year.
 | Fig.1 NIR pattern of tobacco samples produced in different year |
From Figure 1, it can be seen that from 7 000 to 10 000 cm-1 wave number contains little data information. So that the data from 7 000 to 10 000 cm-1 wave number can be negligible without affecting the original information. In this work, the data as redundant information was deleted and the data from 3 799 to 6 996 cm-1 wave number were extracted as the feature extraction of values.
1.1.3 Electronic nose analysis
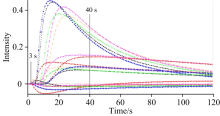
All the cigarettes samples were analyzed on a Fox 4000 nose sensor (Alpha M.O.S., France), which contains 18 different sensors. The registrations of the sensor signals were done at the following environmental conditions: air temperature 20~22 ℃, humidity of air 30%~45%, time of sampling 1 s and time of measuring window in a single test 120 s. Figure 2 presents the time responses of 18 sensors at the measurement of one sample.
 | Fig.2 Time responses of an array of eighteen gas sensors of sample |
In order to get a better correlation between EN regression and plant parts of tobacco analysis, feature data were extracted. From Figure 2, the values from 0 second to 3 second and after 40 second contain little data information. So that the data from 0 to 3 second and after 40 second can be negligible without affecting the original information. In this work, the data from 6~40 were extracted as the feature extraction of values.
1.2.1 SVM method
SVM were originally proposed by Vapnik[15]. SVM has been proven to perform well for classification and regression[16]. This method has high generalization ability and special suitability for small size of training set[17].
The geometrical interpretation of SVM is that it determines the optimal separating hyperplane, which is equidistant from two classes. Vapnik has pointed out that the hyperplane have many interesting statistical properties.
In this work, the leaving-one-out cross-validation (LOOCV)[18] was undertaken to find the suitable latent variables, the suitable capacity parameter C and the appropriate kernel function for SVM model. The accuracy of prediction (PA) of LOOCV was computed as follows:
The better is the model, the larger is PA. Where NT is the number of total samples of the data set, and NC is the number of samples whose classes are correctly predicted. Therefore, we employed PA as a criterion to distinguish SVM method.
1.2.2 Genetic Algorithm
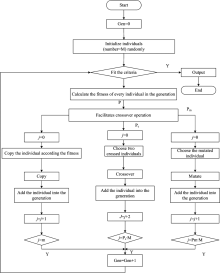
Genetic algorithm has been widely used to evolve and design the initial weights and thresholds of SVM in the course of training[19, 20]. In a genetic algorithm, a population of variable to an optimization problem is evolved towards better solution. The evolution process starts from a population of randomly generated individuals, after an iterative process, the population in each iteration forms a generation. In each generation, the fitness of every variable is evaluated. The process of selecting variant is shown in Fig.3.
 | Fig.3 The flow chart of genetic algorithm |
As is shown in table 2, the latent variables in NIR-SVM and EN-SVM are 24, however the latent variables are 20 in the model of NIR-EN-SVM.
| Table 2 Latent variables of different model |
Employing the linear kernel function with C=10, the trained SVM models with original data are as follows:
NIR-SVM:
F(x)=-0.003 9(z1)-0.258 5(z2)-0.238 0(z3)-0.204 7(z4)-0.173 75(z5)+0.250 2(z6)-0.602 7(z7)-2.692 4(z8)+1.701 4(z9)+1.227 0(z10)-0.690 9(z11)+0.759 6(z12)-0.354 1(z13)+0.268 9(z14)-0.168 7(z15)-0.006 3(z16)+0.331 4(z17)+0.259 4(z18)+0.146 7(z19)+0.176 9(z20)+0.176 7(z21)+0.160 1(z22)+0.139 1(z23)+0.107 4(z24)-1.451 0
EN-SVM:
F(x)=-0.012 8(y1)-0.006 8(y2)-0.055 7(y3)-0.307 4(y4)-0.284 2(y5)-0.096 2(y6)-0.306 8(y7)+0.096 9(y8)-0.067 2(y9)-0.192 8(y10)-0.561 2(y11)-0.238 8(y12)-0.678 9(y13)+0.311 5(y14)-3.303 1(y15)-1.934 5(y16)-1.398 8(y17)-6.476 3(y18)-4.446 3(y19)-5.161 1(y20)-1.653 8(y21)-3.008 4(y22)-4.450 8(y23)-3.973 4(y24)-0.943 4
NIR-EN-SVM:
F(x)=-0.029 6(x1)+0.004 2(x2)-0.081(y3)+0.001 1(x4)-0.106 6(x5)-0.132 4(x6)+0.090 5(x7)-0.063 7(x8)+0.012 9(x9)-0.176 3(x10)-0.271 7(x11)-0.718 0(x12)-0.014 5(x13)+0.100 9(x14)+0.119 4(x15)-0.560 2(x16)-0.800 5(x17)-0.844 9(x18)+0.169 4(x19)-3.507 0(x20)-1.376 1
The optimal model of NIR-EN-SVM for discriminating the three classes could be constructed with the linear kernel function and a capacity parameter C=10. The results are shown in Table 3. The accuracy of the optimal model was 100%.
| Table 3 Confusion matrix of training test of producing year of tobacco |
The mathematical model is considered to be more reliable because it not only fits well with the training data set, but also gives good prediction by cross-validation test. In this work, the performance of the model obtained is evaluated by implementing the LOOCV. PA of LOOCV with the rate of 98.55%. The results were showed in Table 4.
| Table 4 Confusion matrix of LOOCV of producing year of tobacco |
In order to test the validity of the trained NIR-EN-SVM model, 40 samples were handled as the test set. The results are shown in Table 5. The accuracy of test set was 90.00%.
| Table 5 Confusion matrix of independent test data of producing year of tobacco |
Under the optimal model, NIR-SVM, EN-SVM model were constructed respectively. The results were listed in table 6. As is shown in table 6, the accuracy of all three models in training set are high. The accuracy of NIR-SVM, EN-SVM and NIR-EN-SVM model were 98.13%, 99.26%, 100.00%, respectively. For LOOCV, the accuracy for three models as mentioned above were 96.65%, 96.95% and 98.53%, respectively. Though these two results showed close accuracy of all three models the accuracy of test set are varied. The accuracy of all three models in test set were 85.00%, 72.50%, 90.00%, respectively. The NIR-EN-SVM model performed well in predicting the tobacco leaves year.
The optimal model of NIR-SVM for discriminating the three classes could be constructed with the linear kernel function and the capacity parameter C=10. The results are shown in Table 6. The accuracy of training set with three classes was 98.55%.
| Table 6 The comparison of different models’ accuracies |
In this work, the PA of NIR-SVM model and LOOCV results are 100% and 98.55% respectively, they still cannot be applied in the use of recognition of producing year of tobacco due to the low accuracy for unknown samples. The prediction accuracy for 2012 tobacco leaves was only 60%.
The PA of EN-SVM model and LOOCV results are 98.55% and 97.10%, they still can’ t be applied in the use of recognition for producing year of tobacco due to the low accuracy for unknown samples. Especially in the unknown samples of 2010 and 2012, the accuracy only reaches 60%.
Therefore, neither NIR nor EN can build a good model for producing year of tobacco recognition.
While we combined the data of NIR with EN, the NIR-EN-SVM model reached the accuracy of 100% and LOOCV’ s accuracy reached 98.55%. The accuracy of NIR-EN-SVM model to unknown samples is 90.00%. Especially there is a major rise in the accuracy of the year 2010, 2011 and 2012 respectively. This is because NIR-EN-SVM model contains more data of tobacco leaves produced by NIR and EN. NIR-EN-SVM model retains the merit of both NIR-SVM and EN-SVM model. Besides, by using Genetic Algorithm, redundant variables were eliminated. Compared with NIR-SVM and EN-SVM model, the NIR-EN-SVM model results in higher accuracy, since the combined model consists more data than the single model.
The authors have declared that no competing interests exist.
| [1] |
|
| [2] |
|
| [3] |
|
| [4] |
|
| [5] |
|
| [6] |
|
| [7] |
|
| [8] |
|
| [9] |
|
| [10] |
|
| [11] |
|
| [12] |
|
| [13] |
|
| [14] |
|
| [15] |
|
| [16] |
|
| [17] |
|
| [18] |
|
| [19] |
|
| [20] |
|