引用本文
唐东林, 王瞧, 出毅能, 李瑞海. [J]. 光谱学与光谱分析, 2018,38(4): 1319-1323.
TANG Dong-lin, WANG Qiao, CHU Yi-neng, LI Rui-hai. Detecting H2S Gas Concentration by 1,8-Naphthalimides Fluorescent Probe [J]. Spectroscopy and Spectral Analysis, 2018,38(4): 1319-1323.
Doi:10.3964/j.issn.1000-0593(2018)04-1319-05
Permissions
TANG Dong-lin, WANG Qiao, CHU Yi-neng, LI Rui-hai. Detecting H2S Gas Concentration by 1,8-Naphthalimides Fluorescent Probe [J]. Spectroscopy and Spectral Analysis, 2018,38(4): 1319-1323.
Doi:10.3964/j.issn.1000-0593(2018)04-1319-05
Copyright©2018, 《光谱学与光谱分析》期刊社
《光谱学与光谱分析》期刊社 所有
摘要
针对传统硫化氢检测方法灵敏度低的问题, 以1,8-萘酰亚胺为荧光基团, 基于H2S的还原性, 通过在荧光分子结构上引入具有氧化性的硝基, 合成一种可与硫化氢气体发生氧化还原反应生成有荧光响应的小分子荧光探针。 该探针本身荧光十分微弱, 且荧光峰值在 λ=467 nm和 λ=522 nm处。 与H2S反应之后, 522 nm处的荧光效应消失, 467 nm处的荧光效应显著增强。 测定小分子荧光探针在通入H2S气体前后的荧光光谱, 分析467 nm处的荧光强度与气体浓度关系。 结果表明: 荧光光谱法检测出的H2S气体浓度与荧光强度之间存在很强的线性关系, 相关系数为0.979 3, 最低可检测极限可达0.88×10⁻⁶ mol·L-1量级。 表明基于1,8-萘酰亚胺衍生物的荧光光谱检测法可为油气田H2S气体浓度的的快速测定提供参考。
关键词:
光学测量; 硫化氢浓度; 1; 8-萘酰亚胺衍生物; 荧光光谱
中图分类号:TN383.2
文献标志码:A
Detecting H2S Gas Concentration by 1,8-Naphthalimides Fluorescent Probe
Abstract
Aim
ing at the low sensitivity of traditional hydrogen sulfide detection method, a small-molecule fluorescent probe was designed and synthesized for hydrogen sulfide detection via introducing oxidizing group of nitro on the 1,8-naphthalimide fluorescence group, based on the nitro group could be reduced by hydrogen sulfide to produce the corresponding amino group. The fluorescence intensity of probe was very weak, and the fluorescence peaks were at λ=467 nm and λ=522 nm. After reacting with H2S, fluorescent effect disappeared at 522 nm, it significantly enhanced at 467 nm. The fluorescence spectrum of fluorescent probe was measured after being introduced into H2S, and the fluorescence intensity at 467 nm was analyzed. The experimental result showed an excellent linear relationship between H2S gas concentration and fluorescence intensity, while the linear correlation coefficient was up to 0.979 3. Meanwhile, the minimum H2S gas concentration that could be detected was only 0.88×10⁻⁶ mol·L-1. Fluorescence spectrometric detection of 1,8-naphthalimides solution can be used for the H2S gas rapid determination in oil and gas fields.
Keyword:
Optical measurement; Hydrogen sulfide concentration; 1; 8-naphthalimides; Fluorescence spectrum


Introduction
Hydrogen sulfide (H2S) is a toxic, colorless gas that may be encountered during production of oil and gas. Detection and monitoring of H2S is very important since levels above 1 g· m-3 are considered hazardous[1]. The traditional detection methods are mainly titration[2], spectrophotometry[3], electrochemical analysis[4], and gas phase chromatography[5, 6], etc. Fluorescence detection method, by contrast, has been widely used due to the characteristics of easy-to-use and high sensitivity[7]. In medical, endogenous H2S is recognized to be the most recent endogenous gasotransmitter along with nitric oxide (NO) and carbon monoxide (CO), and is linked to many physiological and pathological processes[8, 9]. There are many fluorescent probes for Hydrogen sulfide detection by using its reducibility[10, 11] and nucleophilicity[12, 13], however, only very few can be applied as analytical tools for detection of H2S which is in atmosphere and H2O. 1, 8-naphthalimide compounds is a very important kind of fluorescent materials with advantages of high fluorescence quantum yield, good thermal stability, and easy to be modified and so on. Two derivatives of 4-amino-1, 8-naphthalimide were synthesized by Yan Xiao-li, et al., both of them could make very strong yellow-green fluorescence, and their fluorescent properties in different solvents were studied[14]. Nitro and azide group of naphthalimide are reduced to molecular with fluorescence excitation response by H2S under mild conditions. This feature extends naphthalimide potential use to Hydrogen sulfide detection. Pluth synthesized two H2S fluorescence probes HSN1 and HSN2 to be used to detect signal molecules in organisms, the experimental results showed that HSN2 has a higher selectivity[15].
In the present paper, a new type of small molecular probes has been designed and synthesized. Taking advantage of 1, 8-naphthalimide ease of synthetic modification and fluorescence modulation by functionalization of the amine moiety, the molecular probes have some advantages with sensitivity, simple, easy to synthesis, characterization and testing. The molecular probes holds promise as a better tool for detecting H2S gas in oil and gas fields and solution with high sensibility.
1 Theory predictions
It has been proved that H2S can reduce RNO2 and RN3 electronic to become primary amine, which reappeared fluorescence of fluorescent group[16, 17]. Because the nitro group has a certain oxidizability, oxidation-reaction can be performed between 1, 8-naphthalimide derivatives(ND) with an nitro group and H2S with certain reducibility (figure 1). After reaction with H2S, — NO2 group becomes into — NH2, electronic absorption effect of group becomes into electronic-donating effect, and the fluorescence intensity is enhanced. By measuring the fluorescence intensity difference reacting with H2S, it detect the existence of H2S.
 | Fig.1 ND and detection principle |
Using ND to detect the concentration of H2S in atmosphere or water, the first step is passing through tested sample into ND solution, and then measuring fluorescence intensity of reaction products in the tested solution. Based on the fluorescence intensity, the concentration of H2S in the sample is calculated.
Hydrogen sulfide is a highly toxic gas. For experiment safety and operation convenience, sodium hydrosulfide (NaHS) solution is used to replace H2S in the experiment. The solution of NaHS hydrolysis equation
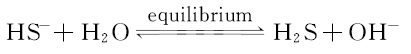
the hydrolysis of H2S exists in solution in the form of molecules. According to the primary and secondary ionization equilibrium constant of the H2S solution and 25 ℃ water ion product constant, NaHS hydrolysis equilibrium constant can be figured out to evaluate of the amount of H2S in the solution, and H2S gas solubility in water is much good. The required concentration of H2S is got by controlling the concentration of NaHS solution. Finally, establishing the relationship between the fluorescence intensity and concentration of H2S.
2 Experiment and result analysis
2.1 Derivatives preparation
The synthesis of derivatives is shown in figure 2. The synthesis of the nitro acenaphthene and 4-nitro-1, 8-naphthalic anhydride refered to literatures of Zhang Liang-wei[18] and XIA Sheng-qin[19], 1 mmol 4-nitro-1, 8-naphthalic anhydride and 1 mmol o-phenylendiamine was taken into ethylene glycol monomethyl ether to reflux for 12 h, followed by adding the product, dropwise, into 6% of HCl aqueous solution to get a crude product. 1, 8-Naphthalimide ramification is got by re-crystallizing the coarse product in ethyl acetate/CH2Cl2 solution.
All synthetic steps didn’ t require harsh conditions, and the raw materials were available.
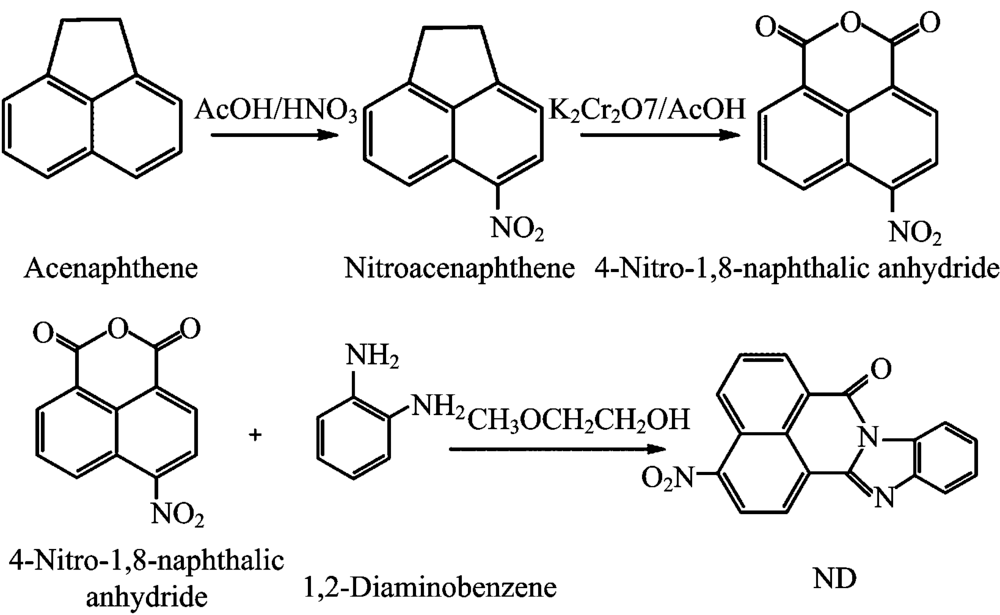 | Fig.2 Synthesis of ND |
2.2 Characterization of the material
The specimen is prepared by potassium bromide pellet and scanned by infrared spectrometer, the wavelength range is 4 000~400 cm-1. In figure 3(a), framework vibration and breathes vibration of benzene occur at 1 418 and 1 599 cm-1, at 785 cm-1 is out-plane flexural vibration of =C— H on the benzene ring. In figure 3(b), the absorption peaks at 1 508 and 1 324 cm-1 are stretching vibration of nitrogen-oxygen double bond of nitro compounds, which illustrate clearly that the nitro is successful received on the naphthalene. In figure 3(c), absorption peak appears at 1 703 cm-1, this is because the ketone-carbonyl group exists in naphthalimide derivatives, which proves that 1, 8-naphthalimide compounds was successfully synthesized.
2.3 NaHS solution fluorescence detection test
The concentration of 1.0× 10⁻³, 0.75× 10⁻³, 0.5× 10⁻³, 0.25× 10⁻³, 0.1× 10⁻³, 0.75× 10⁻⁴, 0.5× 10⁻⁴, 0.25× 10⁻⁴ and 0.1× 10⁻⁴ mol· L-1 NaHS solution were prepared. Fluorescent molecules were generated from the reaction of ND and NaHS solution, but Na+, HS- and ND were in the reaction mixture at the same time. To eliminate error caused by those substances during testing fluorescence intensity, it was necessary to test their fluorescence properties. The first step was to measure the fluorescence intensity of NaHS solution using spectrometer for model Fluoromax-4 (HORIBA Instruments Company). The fluorescence intensity on 8 mL a certain concentration of NaHS solution was measured. Wavelength scanning range of light source was set 420~700 nm, step size was 1 nm. Fluorescence spectrum was shown after scanning the sample (figure 4).
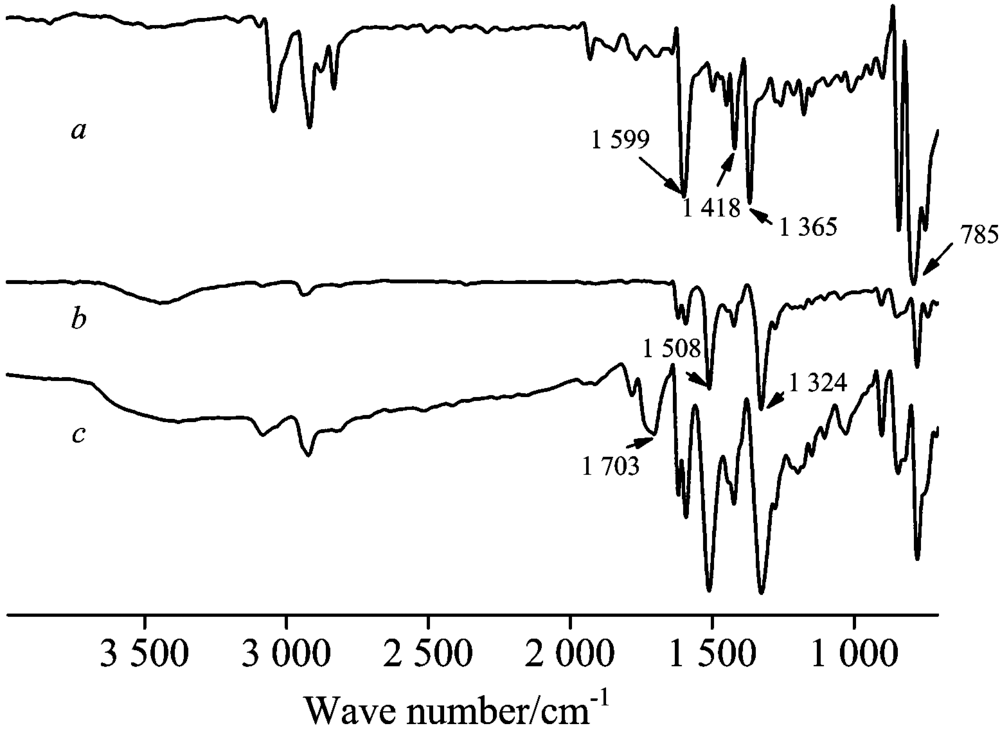 | Fig.3 (a) acenaphthylene, (b) 5-nitroacenaphthene, (c) ND infrared spectra |
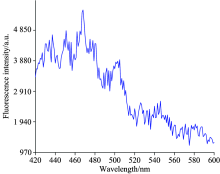
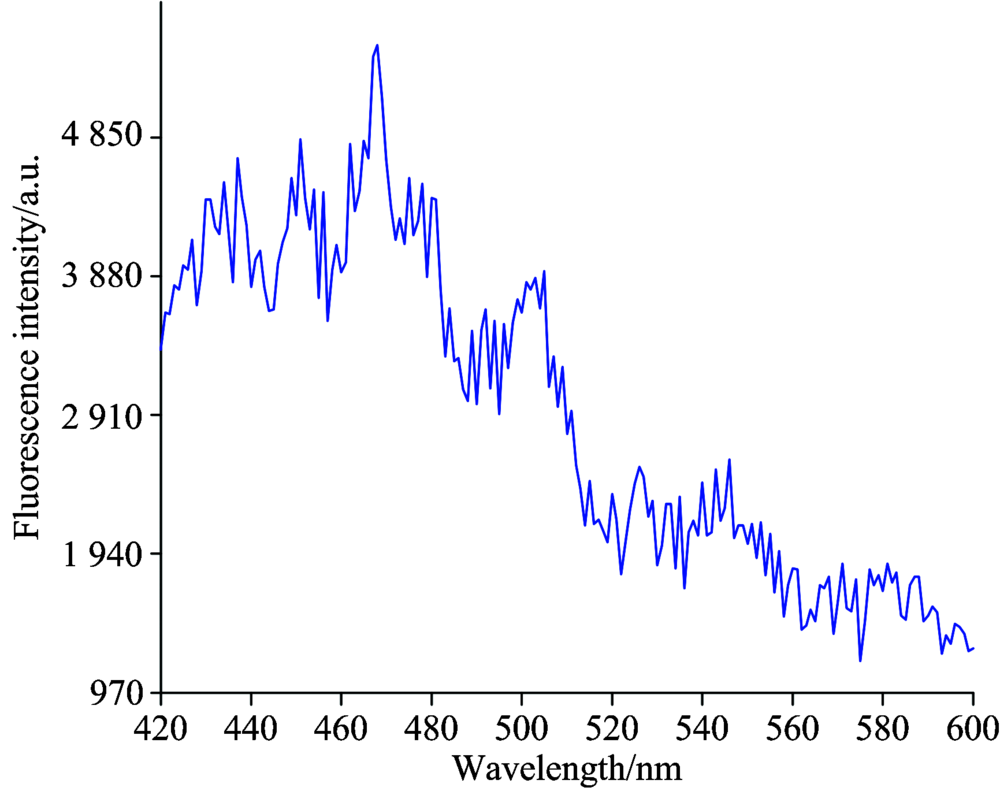 | Fig.4 Fluorescence spectrum of NaHS solution |
As seen in Fig.4, the fluorescence intensity of NaHS aqueous solution is generally very weak in 420~600 nm wavelengths, the maximum fluorescence intensity is 5 416(AU) at wavelength of λ =470 nm, but it’ s still so small. Fluorescence intensity is falling as the growth of wavelength since 470 nm, so, the Fluorescence effect of NaHS solution can be ignored.
For different concentrations of NaHS solution, the fluorescence spectra is measured. The fluorescence values at 470 nm are shown in figure 5.
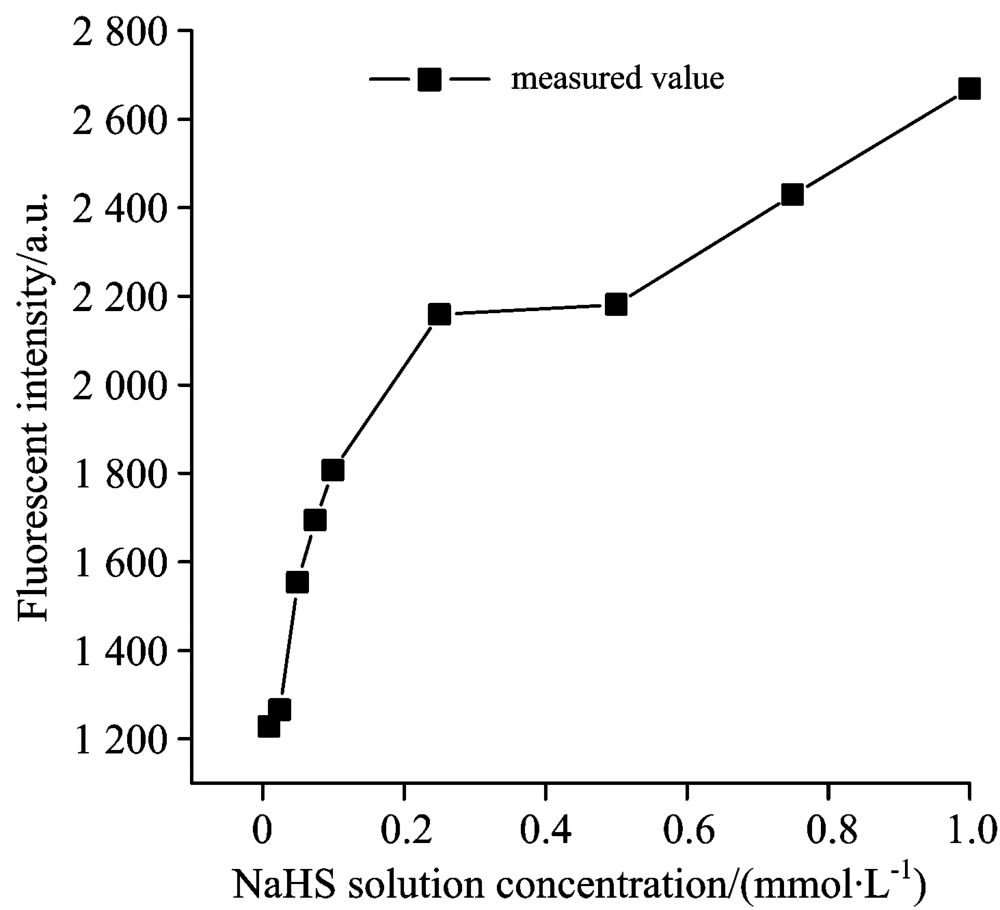 | Fig.5 Relationship between NaHS solution concentration and fluorescence intensity |
As shown in Fig.5, although fluorescence intensity increases with the concentration of NaHS solution, the fluorescence intensity of the maximum concentration solution is only 2 669(AU), NaHS solution fluorescence effect can be completely neglected, compared with the fluorescence intensity of ND (16 660 AU), at the same concentration of NaHS solution.
2.4 ND reaction with different concentrations of hydrogen sulfide
Took 3 mg ND to prepare 100 mL (DMSO∶ H2O=9∶ 1) standby solution, NaHS solution was taken 4 mL as 1.0× 10⁻³, 0.75× 10⁻³, 0.5× 10⁻³, 0.25× 10⁻³, 0.1× 10⁻³, 0.75× 10⁻⁴, 0.5× 10⁻⁴, 0.25× 10⁻⁴, 0.1× 10⁻⁴ and 0 mol· L-1 to react with 4 mL ND solution, respectively.
The relationship between fluorescence intensity and H2S gas could be obtained by analyzing the fmuorescence of the reaction mixture. The wavelength scanning range of fluorescence spectrometer was set 420~700 nm, step size was 1 nm, and the scanning fluorescence spectrum is shown as figure 6.
 | Fig.6 Fluorescence spectrum of ND solution was introduced into different concentration H2S |
As shown in Fig.6, when the NaHS solution concentration is 0 mol· L-1, that is pure ND solution, there is a maximum fluorescence peak at λ =467 nm, the fluorescence intensity is about 10 586(AU) . The second fluorescence peak stays at λ =522 nm, fluorescence intensity is 9 461(AU). After ND solution mixed with NaHS solution, the second fluorescence peak disappears while the first fluorescence peak is strengthened (at λ =467 nm). Although concentrateions of NaHS solution added are different, locations of the fluorescence peak strengthened are all at λ =467 nm, which indicate that a new fluorescence substance is generated by redox reaction between H2S and nitro after the two solution mixed, and the excitation wavelength of new fluorescent material is not exactly the same as ND excitation wavelength. As can also be seen from the Fig.6, NaHS concentration has a great influence on the fluorescence intensity of solution, and shows positive correlations with each other, this shows that the substance of ND has a high sensitivity to hydrogen sulfide.
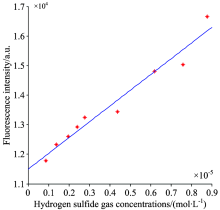
According to the dissociation equilibrium constant of H2S solution[20], hydrolysis equilibrium constant Kh(NaHS) of NaHS solution could be worked out, thereby the H2S concentration in different levels NaHS solution can be calculated. After ND solution reacting with different levels NaHS solution, Average values of fluorescence intensity were extracted by scanning band of 462~472 nm. Based on the average values and corresponding H2S concentration, a line was obtained via method of the least squares (Figure 7).
 | Fig.7 Fluorescence intensity vs. H2S gas concentrations |
As shown in Fig.7, the minimum detectable H2S gas concentration is 0.88× 10⁻⁶ mol· L-1 by using ND. Fig.7 also shows that fluorescence intensity of reaction products has a good linear relationship with H2S gas concentration. Fitting equation of fluorescence intensity vs. gas concentration is:
A=0.053 3× 10⁴c+11 494, linear relevancy r2=0.979 3, where A is the fluorescence intensity of fluorescent substances around λ =467 nm, c is concentration of target gas H2S. Thus, depending on measuring the change of fluorescence spectra after H2S gas admitted to ND solution, concentration information of H2S gas can be obtained.
3 Conclusions
In summary, we synthesized a new type of small-molecule fluorescent probe for H2S detection. The probe has a simple structure. Using ND solution as the test medium, we tested and analyzed the fluorescence spectra, and developed a mathematical model between the gas concentration and the fluorescence intensity. The detection limit reached 0.88× 10⁻⁶ mol· L-1. Experimental results show that this method is highly precise with low cost, and a wide application in detecting concentration of H2S gas in oil fields.
The authors have declared that no competing interests exist.
参考文献
| [1] |
|
| [2] |
|
| [3] |
|
| [4] |
|
| [5] |
|
| [6] |
|
| [7] |
|
| [8] |
|
| [9] |
|
| [10] |
|
| [11] |
|
| [12] |
|
| [13] |
|
| [14] |
|
| [15] |
|
| [16] |
|
| [17] |
|
| [18] |
|
| [19] |
|
| [20] |
|