


基于荧光光谱法与深度信念网络的稻种发芽率检测方法研究
引用本文
卢伟, 郭阳鸣, 代德建, 张澄宇, 王新宇. 基于荧光光谱法与深度信念网络的稻种发芽率检测方法研究[J]. 光谱学与光谱分析, 2018,38(4): 1303-1312.
LU Wei, GUO Yang-ming, DAI De-jian, ZHANG Cheng-yu, WANG Xin-yu. Rice Germination Rate Detection Based on Fluorescent Spectrometry and Deep Belief Network[J]. Spectroscopy and Spectral Analysis, 2018,38(4): 1303-1312.
Doi:10.3964/j.issn.1000-0593(2018)04-1303-10
Permissions
LU Wei, GUO Yang-ming, DAI De-jian, ZHANG Cheng-yu, WANG Xin-yu. Rice Germination Rate Detection Based on Fluorescent Spectrometry and Deep Belief Network[J]. Spectroscopy and Spectral Analysis, 2018,38(4): 1303-1312.
Doi:10.3964/j.issn.1000-0593(2018)04-1303-10
Copyright©2018, 《光谱学与光谱分析》期刊社
《光谱学与光谱分析》期刊社 所有
基于荧光光谱法与深度信念网络的稻种发芽率检测方法研究
摘要
针对传统稻种发芽率检测效率低、 精度差、 专业化要求高等问题, 通过荧光光谱法结合深度信念网络(DBN)建立稻种发芽率预测模型。 首先, 将连粳7号和武运粳均分别老化0~7 d后, 以5 min为间隔在纯净水中分别浸泡5~30 min。 然后用荧光光谱仪检测浸泡液的荧光光谱, 光谱数据经中心化后用集合经验模态分解(EEMD)去噪, 并通过主成分分析法提取441.5 nm的特征荧光波长。 最后, 利用偏最小二乘回归(PLSR), 反向传播神经网络(BPNN), 径向基函数神经网络(RBFNN)和深度信念网络(DBN)建立水稻种子发芽预测模型。 比较后得出, DBN模型在少数据、 弱信号情况下的预测精度最高, 预测集相关系数Rp和均方根误差RMSEP最大可达0.979 2和0.101。 同时, 通过分析混合稻种荧光数据 Rp的变化趋势, 得到最佳浸泡时间为22.1 min, 实际上, 精确度超过0.95( Rp)需要5 min左右。 研究结果表明, 结合荧光光谱法和EEMD-DBN模型, 非破坏性地预测水稻种子发芽率具有可行性和高准确性, 并且适用于不同颜色和污染水平的水稻种子的检测。
关键词:
荧光; 稻种; 发芽率; EEMD; DBN
中图分类号:O657.3
文献标志码:A
Rice Germination Rate Detection Based on Fluorescent Spectrometry and Deep Belief Network
Abstract
Traditional rice seed germination rate detection methods have low efficiency, poor accuracy and high specialization. The paper proposed a novel method by using fluorescent spectrometry combined with Deep Belief Network (DBN) to establish forecasting model for rice seed germination rate. Firstly, two varieties of seeds, Lianjing 7 and Wuyunjing, with 0~7 artificial aged days separately were soaked into purified water for 5~30 minutes with every 5 minutes’ interval. Then the fluorescence spectrums of the soak solutions were detected using fluorescence spectrometer. In addition, the spectrum data were centralized and then denoised with Ensemble Empirical Mode Decomposition (EEMD). The characteristic fluorescence wavelength of 441.5nm was extracted using Principal Component Anamysis (PCA). Finally, the rice seed germination predicting models were establishee with Partial Least Squares Regression (PLSR), Back Propagation Neural Network (BPNN), Radial Basis Function Neural Network (RBFNN) and Deep Belief Network (DBN), respectively. The results showed that the accuracy of DBN model was the highest in the case of less data and weak signal, and Rp=0.979 2, RMSEP=0.101. At the same time,we got the best soaking time is 22.1 min by analyzing the changing trend of mixed rice seed fluorescent data Rp, actually, it took about 5 min to get the accuracy more than 0.95 ( Rp). The research results demonstrated the feasibility and high accuracy for predicting rice seed germination rate non-invasively by combining the fluorescent spectrometry and EEMD-DBN model, moreover, it adapts to the detection of rice seeds with different colors and contaminated levels.
Keyword:
Fluorescence; Rice seed; Germination; EEMD; DBN
Introduction
Rice is one of the most important staple foods for a large population in the world, and the world’ s second-largest cereal crop, which provides more than one-fifth of the calories consumed worldwide by the human[1]. Seed quality has a profound impact on crop development and yield, and good seed qualitycan significantly increase crop yields. However, due to the threats in the process of seed storage such as oxidation, mildew, disease, moth-eaten and corruption, the biological tissue and chemical composition changes will result in deterioration of seed quality and germination[2]. Therefore, rapid seed quality testing methods are important for agriculture and seed production.
The traditional rice germination rate determination methods such as tetrazolium (2, 3, 5-Triphenyl tetrazolium chloride, TTC) staining method (triphenyl tetrazolium chloride staining method) can identify a seed is either alive or dead without the affection of seed dormancy. But it is easy to be influenced by temperature, light intensity and other environmental factors. What’ s more, it needs long soaking time (up to several hours) and professional skills[3]. According to TTC method’ s shortcomings such as low efficiency, poor precision and destructive detection, a number of nondestructive detection methods have been explored to detect rice germination rate, viability and activity. For instance, near infrared spectroscopy (NIRS)[4, 5], hyperspectral imaging (HSI)[6], infrared imagery (IRI)[7] and photoacoustic spectroscopy (PAS) methods[8] have been applied in rice seed germination detection. They are nondestructive but seriously disturbed not only by rice color but also the contaminant and rice mildew. Thermal infrared (TIR) and X-ray methods have the advantage of extensive suitability for the rice with different color and contaminant but it is not accurate[9, 10]. Hence efforts have been made to develop rapid, accurate, inexpensive and general applicability techniques to detect rice seed activity and germination[11].
Fluorescence spectroscopy (FS) is a quantitative approach to measure the substances of a sample by using a specific wavelength light to excite the sample and detecting the emit light which intensity is proportional to the specific components[12]. It has been widely used in nondestructive measurement domains because of its fast scanning speed and high precision[13]. The laser-induced fluorescence technology has been employed to monitor the alterations of leaf nitrogen content, the main fluorescence peaks and fluorescence ratio were extracted to accurately inverse the leaf nitrogen content of paddy rice[14]. To rapidly and efficiently detect the presence of adulterants in honey, three-dimensional fluorescence spectroscopy technique was employed with the help of multivariate calibration[15]. Determination of Tinopal CBS-X in rice papers and rice noodles using HPLC with fluorescence detection and LC-MS/MS, the limits of quantification for rice papers and rice noodles were 1.58 and 1.51 μ g· kg-1, respectively, and their correlation curves showed good linearity with r2≥ 0.999 7 and ≥ 0.999 8, respectively[16]. However, little research has been done on the rice germination detectionby fluorescence spectroscopy.
In this study, the fluoresceoce spectroscopy technology was applied to determinate rice germination by detecting the fluorescence intensity of rice seed soaking solution with different ageing timeand different soaking time. Then, several prediction models were built based on the fluorescence intensity which demonstrate that the model using Deep Belief Network (DBN)[17], compared to other models, achieves better accuracy. The novel rice germination detection method based on fluorescence spectroscopy is also suitable for the contaminated and dirty rice seed and hashigh precision and efficiency.
1 Materials and methods
1.1 Materials
The materials used for experiment are two varieties (Lianjing 7 and Wuyunjing) rice seeds which were harvested in 2016 by Lianyungang Academy of Agricultural Sciences. The two varieties of seeds used for experiments have difference colors and contaminations. Researchers got 10 kg of rice seeds of each variety after artificial selection which were full particles, at the same size and shape.
1.2 Seeds ageing treatment
Because seed ageing is mainly influenced by two environmental factors, RH and temperature[18]. So, artificial ageing method with high temperature and high humidity was applied in rice seed ageingtreatment. Firstly, we divided each variety of treated rice seeds into 8 groups equally. Each sample was placed in a glass tray which was put in a multi-programming intelligent artificial climate chamber (TXZ type, Ningbo Jiangnan Instrument Co.). Then researchers aged the seeds for 0 day, 1 day, 2 days, …, 7 days orderly by setting the climate chamber at the temperature of 45 ℃ and humidity of 90%[19, 20]. Next, seeds were taken out of the climate chamber according to different ageing days. Finally, the seeds were dried in sunshine (about 11% moisture) and placed in airtight bags. According to different ageing days, seeds were classified and numbered. Each variety seed of every ageing day were 5 parts and every part included 15 grains for fluorescent testing. So, there were altogether 1 200 grains for fluorescent testing of the two rice seedvarieties.
1.3 Germination test
In order to obtain the germination rates of rice seeds with different ageing days of each variety, the germination test was conducted according to the GB/T 3543.4— 1995 (following the standard provided by ISTA-1993). The remaining 16 groups rice seed (2 varieties, 8 different ageing days, 50 grains every group, 800 grains of rice seeds totally) were soaked in water for 72 hours. Then they were removed to petri dishes in the climate chamber and cultivated on wet filter paper in a constant temperature of (25± 1) ℃ and until they were germinated. Germination data were recorded and calculated after 14 d of seed.
1.4 Experimental materials and equipment
Fluorescence intensity detection was performed by using LS-55 fluorescence spectrophotometer(Excitation light 200~800 nm, emitting light 200~650 nm) provided by PE Company, in which the light source is pulsed xenon lamp (Frequency 50 Hz, power consumption 8.3 W). In order to reduce the stray light of the excitation light and emitting light, two variable slits filters (the wavelength ranges from 2.5 to 15 nm) were used. The sample cellhas low fluorescence with material of quartz cuvette (Q type, operating wavelength 350~2 000 nm, square cross section with 12.5 mm side and 3.5 mL of volume). The photomultiplier is a detector that converts the fluorescence optical signal to electric signal and amplifies the voltage to the magnitude of volt[21].
The ultraviolet light and blue violet light from the xenon lamp went through the filter and then excited the fluorescent substance molecules of the rice seed soaking solution to jump from the ground state to upper state. Due to the instability of the molecules in the excited state, a portion of the energy was emitted in the form of light during their return to the ground state which resulted in fluorescence. Because of different molecular structures of different substances, the excited level distributions vary differently which characterize as different wavelengths of exciting light and fluorescent light.
1.5 Spectral data collection
75 grains of rice seeds ofeach aged day were picked out and then divided into 5 groups which were soaked in pure water for 5, 10, 15, 20 and 30 min respectively. The amount of pure water used for soaking following the rule of 1 grain 1 milliliter. Moreover, the quartz cell with pure water was scanned by the fluorescence spectrophotometer as the background fluorescence to be subtracted in the following experiments for minimizing the error of the experiments. Besides that, 0 d aged rice seeds and 7 d aged rice seeds were selected to be soaked in 3 mL pure water for 30 min and then the soak solutions were scanned by fluorescence spectrophotometer for optimizing the excitation wavelength. The comparison results showed that the optimal excitation wavelength is 340 nm. In the follow-up study, all the soak solutions of rice seeds with different aged days were made by 3 grains and 3 mL pure water in cuvette and the fluorescence were detected under theexcitation wavelength of 340 nm.
1.6 Spectral pretreatment and data analysis
Considering the noises such as system noise, background light, scattering light and other factors during measuring process, the pretreatment methods such as mean-centering, denoising and smoothing methods were employed conjunctively and the signal processing effects were compared.
In the first stage, the signal was centralized according to formula (1).
Where y is the data processed by raw fluorescent data x,
Then, Wavelet Packets Transformation (WPT) and Ensemble Empirical Mode Decomposition (EEMD) methods were adopted to compare the denoising effects of the non-stationary fluorescent signals.Wavelets correspond to particular types of functions, whose location and localization characteristics in the time/frequency plane are ruled by two parameters, scale parameter s and time translation parameter b.
The continuous wavelet transformation of a fluorescent spectrometry signal can be defined as,
According to discrete real valued function, the formula above can also be expressed as,
Where Δ x is sample interval, n is sample size, i is the order of a sample and i=1, 2, 3, ….
‘ sym8’ wavelet packet with fixed threshold parameter at fifth layer was selected after comparing db2— db10, sym2— sym8 wavelet packets and soft threshold, heuristic threshold[22].
EEMD is a noise-assisted signal analysis algorithm based on EMD which was first introduced by Huang et al. (1998)[23]. By using the evenly distributed character of the white Gaussian noise in frequency domain, a signal will have continuity in various scales with the added white Gaussian noise to solve the mode mixing of EMD effectively. The calculation steps of EEMD are as below.
(1) Make a new signalby adding a randomly generated white noise un(t) to a given fluorescent spectrometry signal xn(t).
(2) Decompose yn(t) into several IMF signal components. Ci, m(i=1, 2, …) is the ith IMF component.
(3) Calculate M times based on the above two steps then get the average value of IMFs.
(4) Output the results of new fluorescent spectrometry signal x(t).
After being decomposed in to 9 order IMFs, the 4-9 order IMF components were used to rebuilt fluorescent spectrometry signal.
The comparative effectiveness results of different pretreatment methods are shown in Table 1. Among them, two sets of new data were obtained by using the two combinations of pretreatment methods. RNS is the ratio between the variance and the mean of each group data after normalization. The less value of RNS is the better consistency of the data.Pretreatment results indicated that EEMD combined with centralization method achieved better denoising effect.
| Table 1 Comparison of Spectral pretreatment |
2 Results and discussion
2.1 Germination rate of Lianjing 7 and Wuyunjing
The germination rates of rice seeds aged from 0 to 7 days measured by germination test are shown in Table 2.
| Table 2 Germination rates of Lianjing 7 and Wuyunjing with different ageing time |
2.2 Denoising effect
Take the solution of 0 ageing day rice seed with 5 min soak time for instance, the comparison of denoising effects, as shown in Figure 1, demonstrated that the combination denoising method of centralization and EEMD can remove the random noise of fluorescence effectively.
 | Fig.1 Comparison of the denoising effects of the fluorescence signals (a): Lianjing 7; (b): Wuyunjing |
2.3 The relationship between rice germination rate and fluorescenceof rice seed solution
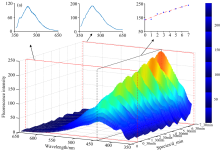
The continuous fluorescence spectra of the solution ofvarious ageing timerice seedswith different soaking time are shown in Figure 2, which illustrated that the fluorescence spectra distributions of rice seed soaking solutions hadperfect similarities. Moreover, the fluorescence intensity increased with the ageing time of rice seeds. Meanwhile, for rice seed with certain ageing time, the stronger fluorescence intensity with the longer seed soaking time. So, the intensities of the fluorescence spectra were positively correlated with the soaking time and seed ageing time as well. Besides that, the fluorescence energies were relatively centralized on the spectral band.
 | Fig.2 Fluorescence spectra of Lianjing 7 and Wuyunjing with different ageing time and different soaking time (a): Liangjing No.7; (b): Wuyunjing |
The fluorescence spectrum provided the spectrum dimensional information in the whole band. Because large datasets can not only increase model complexity but also lead to overfitting[24]. So, the principal component analysis (PCA) method was applied to reduce the dimensionality of the high dimensional fluorescence spectrum considering that PCA is an effective technique for reducing the dimensionality of datasets, increasing interpretability but at the same time minimizing information loss.
Firstly, the original spectrum data of matrix A with 581× 40-dimensional data, whose wavelength range is 360~650 nm and the step is 0.5 nm, was centralized after being denoised to obtain the matrix B. Then the covariance matrix C, the eigenvectors and feature vectors of the matrix C were computed. Finally, a new data set was obtained by selecting the eigenvectors corresponding to the big eigenvalues. The first few principal components were extracted according to the goal of 99% contribution rate. Results showed that the sum of the contribution of the former two wavelengths (λ 1=383.5 nm, λ 2=441.5 nm) was 99.5%, among which λ 1 and λ 2 were the characteristic spectrums of water and the fluorescence of rice seed spillage in soaking solution.
In order to eliminate the influence of ambient light and decrease the impact of man-made error, the comparative fluorescence, as shown in formula (5), was used as the data for modeling.
Where, I is the comparative fluorescence intensity, I
2.4 Model establishment and analysis
Partial Least Squares Regression (PLSR) is a most common and more efficient modeling approach which focuses on the regression modeling of multi-dependent variables for multi-independent variables, particularly when the variables are highly linear correlative[25]. So, it is suitable for modeling and analyzing the fluorescence of rice seed. Back-Propagation Neural Network (BPNN) is one of the most widely used neural network for modeling and most of neural networks use BP neural network or its variations[26]. Radical Basis Function Neural Network (RBFNN) has a simple structure and a fast training speed which also be widely used in the field of pattern recognition, nonlinear function approximation[27]. In the precondition of sufficient training data, the above three kinds of modeling methods have good results. But deep learning methods such as Deep Belief Network (DBN) has good performance on a broad range of classification problems including small sample model building, which is constructed as hierarchies of recurrently connected simpler probabilistic graphical models, named as Restricted Boltzmann machine (RBM). Each RBM consists of two layers of neurons, a visible layer and a hidden layer, which are fully and symmetrically connected between layers, but not connected within layers[28]. Each RBM is trained to encode in its weight matrix a probability distribution that predicts the activity of the visible layer form the activity of the hidden layer without supervised learning. Higher RBM layer can learn increasingly abstract representations of inputs, which matches well with representations learned by higher brain region neurons through stacking the models and letting each layer predict the activity of the layer below. So, DBN avoids typical problems of overfitting and premature convergence pose problems because of its unsupervised layer-by-layer pre-training with the contrastive divergence algorithm.
The structure of the deep belief net (DBN) that used for rice germination prediction as shown in Fig.3, which include two RBMs and one BP net. Where I is the input fluorescence intensity, g is the germination prediction. The model training process is as follows[29].
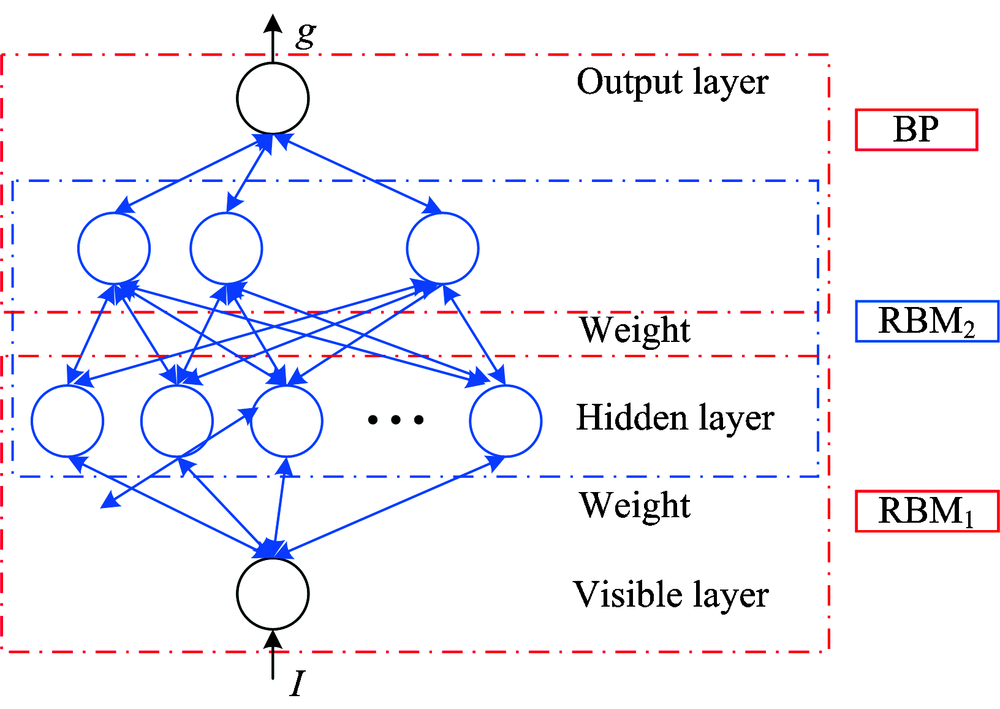 | Fig.3 DBN model with two hidden layers for rice germination prediction |
(1) Initializing all the binary units on each layer of RBMs to 0 or 1 randomly, and setting symmetrical connection weights between units of different layers wij with random value in (0, 1).
(2) Repeat training until energy function E(v, h) decrease to be a convergent state. Here, we use a threshold α concerning with the change of E(v, h) to judge the convergence.
Where v and hi are the binary states of input I and feature i, b' and bi are their biases.
Convergence condition can be given as:
Where α is a positive parameter and small enough, k is the iteration times and K is a constant indicates the length of evaluation period.
20 kinds of prediction models for different soaking timerice seed were established by using PLSR, BPNN, RBFNN and DBN. The dataset was composed of 100 samples and randomly divided into a training set (60) and a testing set (40). The calibration set correlation coefficient (Rc), standard deviation (SEC), the prediction set correlation coefficient (Rp) and the standard deviation (SEP) were calculated respectively (Shown in Table 3, Table 4 and Table 5).
| Table 3 Modelling results of Lianjing 7 rice seed |
| Table 4 Modelling results of Wuyunjing rice seed |
| Table 5 Modelling results of the two mixed varieties of rice seeds |
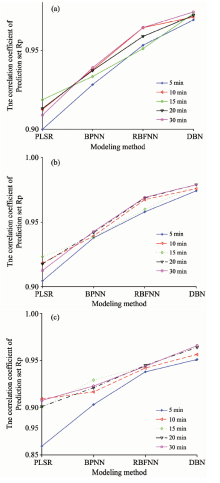
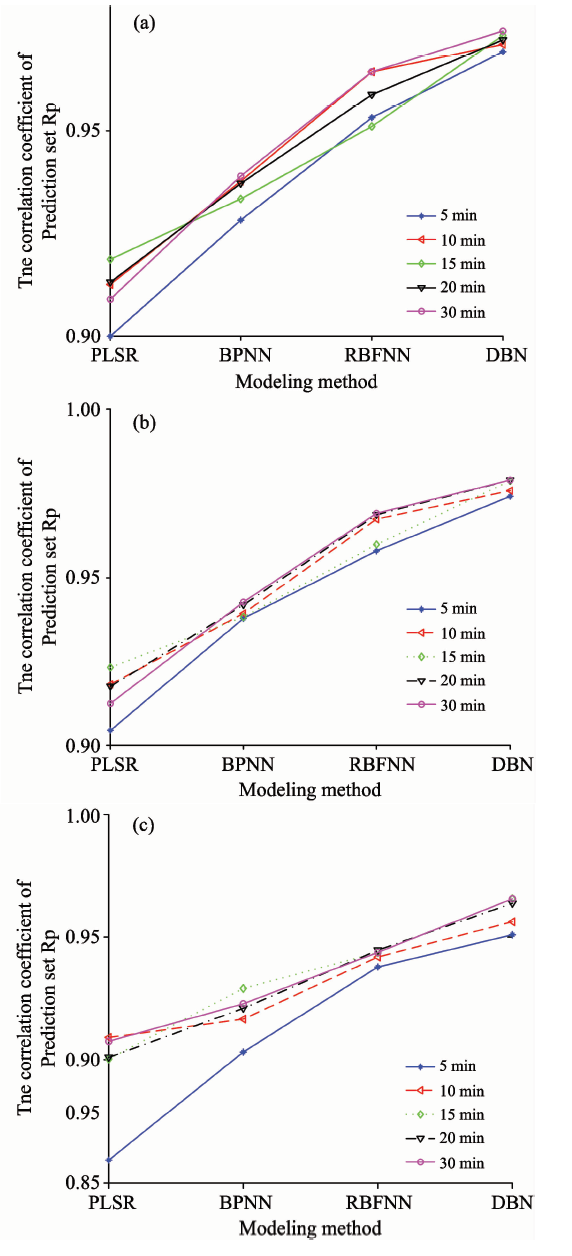 | Fig.4 Comparison of the prediction results of different models with 5~30 min soaking time (a): Germination prediction result of Lianjing 7 rice seed; (b): Germination prediction result of Wuyunjing rice seed; (c): Germination prediction result of two rice seed varieties |
Figure 4 shows that the prediction accuracy of different prediction models under the same soaking time is quite different. The maximum prediction accuracy of PLSR is only 0.923 4, however, the maximum prediction accuracy of DBN is up to 0.979 1, and the root mean square error of prediction set is less than 0.101. DBN also can obtain good germination rate prediction results, Rc up to 0.965 5 and RMSEC less than 0.123 8, for the mixed samples of two varieties of seeds which demonstrate perfect good fault tolerance of DBN at small sample. So, the model based on DBN is the best one with high accuracy and good fault tolerance. Moreover, it took about 5 min to obtain the germination prediction accuracy more than 0.95.
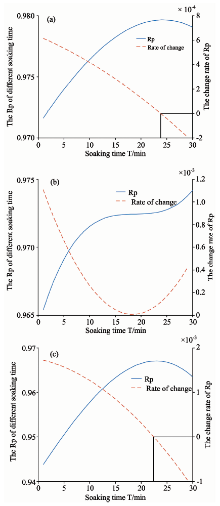
In order to obtain the best soaking time in the germination rate prediction model of DBN, the fitted curves between the prediction set correlation coefficient (Rp) and soaking time with the least square method were given as shown below (Fig.5).
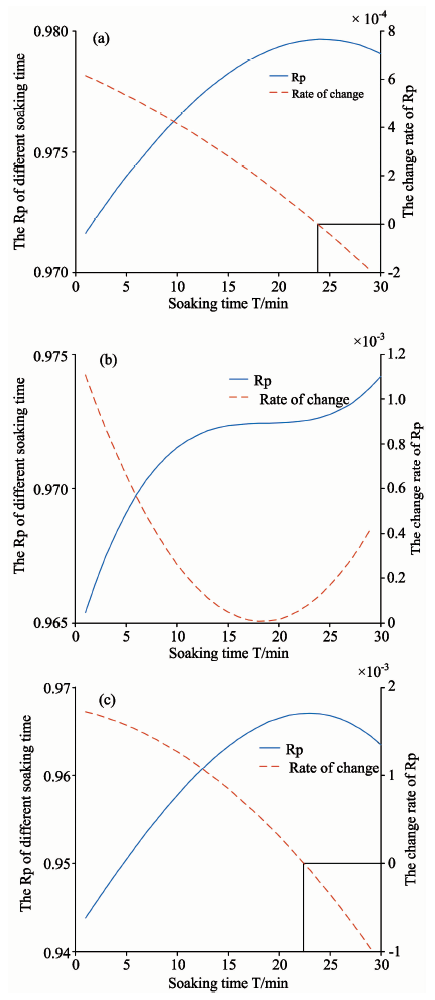 | Fig.5 The prediction variation of DBN models for different soaking time (a): Lianjing 7 rice seed; (b): Wuyunjing rice seed; (c) Two varieties of rice seeds |
In summary, DBN model is the best prediction model in the case of less sample data and weak signals, and the best soaking time of Lianjing 7, Wuyunjing and mixed rice seeds were about 23.8, 18.3 and 22.1 min respectively. The relationships between the actual values and the predicted values using DBN model are shown in Figure 6.
 | Fig.6 The relationships between the actual values and the predicted values using DBN models (a): Lianjing 7 rice seed; (b): Wuyunjing rice seed; (c): Two varieties of rice seeds |
3 Conclusions
Previous researches have noted that seed viability loss is often attributed to the loss of plasmalemma integrity and membrane-permeability, besides of physiological and biochemical changes such as enzyme activity, SOD, POD, CAT, MDA, SSD, et al.[30, 31]. Effective scarification was confirmed by inspection revealing the physical deterioration[32]. So, the measured conductivity of the soaking solution during imbibition is often used in evaluating seed quality, (International Seed Testing Association [ISTA], 1985), though it has low speed acquisition and detection precision.The seed membrane system will be rebuilt and recovered when a seed was soaked into the water. The biochemistry substances leached into the water increase with time because the repairing time of seed membrane delays with the deterioration level. Moreover, the leakage materials such as nucleotides can produce fluorescence light with radiations[33]. Therefore, there is a negative relationship between rice seed germination and the fluorescence intensity, i.e., it’ s feasible to evaluate the rice germination by measuring the fluorescence light.
The main conclusions in the paper are as follows: Firstly, a method for detection of rice seed germination based on fluorescence spectroscopy combined with EEMD-DBN was presented. After the spectral pretreatment of centralization and EEMD filtering, the characteristic wavelength, 441.5 nm, was extracted by PCA method. In addition, by comparing the results of different models established by PLSR, BPNN, RBFNN and DBN, the prediction accuracy of DBN model was the best one in the case of few data and weak signals which had the highest correlation coefficient Rc (0.979 2) and Rp (0.979 1). And the optimum soaking time were about 23.8 min (Lianjing 7), 18.3 min (Wuyunjing) and 22.1 min (mixed rice seeds) respectively, actually, it took about 5 min to obtain the precision more than 0.95. Compared with near-infrared technology, hyperspectral method and photoacoustic technology, the results showed that the fluorescence spectral method has perfect good precision in rice germination detection which proved the feasibility of measuring rice germination by using fluorescence spectroscopy combined with EEMD-DBN to realize non-invasion, rapid and high precision without the influence of rice seed color and contamination.
The authors have declared that no competing interests exist.
参考文献
| [1] |
|
| [2] |
|
| [3] |
|
| [4] |
|
| [5] |
|
| [6] |
|
| [7] |
|
| [8] |
|
| [9] |
|
| [10] |
|
| [11] |
|
| [12] |
|
| [13] |
|
| [14] |
|
| [15] |
|
| [16] |
|
| [17] |
|
| [18] |
|
| [19] |
|
| [20] |
|
| [21] |
|
| [22] |
|
| [23] |
|
| [24] |
|
| [25] |
|
| [26] |
|
| [27] |
|
| [28] |
|
| [29] |
|
| [30] |
|
| [31] |
|
| [32] |
|
| [33] |
|