棕壤与褐土刺槐林下土壤腐殖质组分的傅里叶变换红外光谱分析
[张广娜1 , 林祥杰2 , 李蕴梅3 , 徐树建1 , 张玉兰4, *  ]
]
]
|
|


森林土壤富含不同组分和功能的有机碳。 该研究以棕壤和褐土45年林龄的刺槐林下表层及底层土壤为对象, 研究其林下土壤腐殖酸组分在不同土壤类型和不同土层间的差异和变换。 褐土和棕壤表层及底层土壤分别定义为CO和CA, BO和BA。 应用傅里叶变换红外光谱对土壤腐殖质组分的富里酸(FA)、 胡敏酸(HA)和胡敏素(HM)进行了分析。 结果表明富里酸主要吸收峰为3 400 cm-1处的碳水化合物中—OH形成的氢键伸缩振动, 1 655 cm-1处的芳香环C=C伸缩振动, 1 110 cm-1处的脂族C—OH伸缩振动。 与富里酸相比, 胡敏酸所含官能团与其相似, 差异在于其吸收峰强度较弱。 胡敏素在1 110 cm-1处的脂族C—OH伸缩振动和1 030 cm-1处多糖或类多糖物质的C—O伸缩振动较胡敏酸此处的峰吸收强度强。 根据分析, 表层土壤腐殖质官能团结构较底层土壤多且吸收强度强。 另外, 富里酸不同物质官能团数量及强度受土壤类型和土壤深度的影响较胡敏酸和胡敏素小。 根据不同吸收峰对比分析发现, 富里酸组分的芳化程度较强, 而胡敏酸和胡敏素的芳化作用仅表层土壤程度较强。 不同土壤类型胡敏酸组分分析表明, 棕壤表层土壤芳族和脂肪族物质吸收强度明显高于褐土。 综上, 土壤类型和土层显著影响45年林龄的刺槐林下土壤腐殖质组分, 尤其是胡敏酸和胡敏素组分。
Forest soil contains lots of carbon, which presented in different fractions with various functions. This study collected surface and subsurface soil samples from brown soil and cinnamon soil under 45 years old Robinia pseudoacacia forest. Difference within soil humic substances under long-term forest, the influence from soil type and depth were studied in this paper. Surface and subsurface soil samples collected from cinnamon and brown soil were defined as CO and CA, BO and BA, respectively. Humic substances were separated as fulvic acid (FA), humic acid (HA) and humin (HM) and analyzed by Fourier transform infrared spectroscopy (FT-IR). Results showed that FA contained mainly stretching vibration of carbohydrate H-bonded OH at 3 400 cm-1, aromatic C=C at 1 655 cm-1 and C—OH stretching of aliphatic at 1 110 cm-1. Compared with FA, HA has weaker peaks at similar wave numbers than those in FA. HM fraction has stronger peaks at 1 110 and 1 030 cm-1 than HA, which assigned as C—OH stretching of aliphatic OH and C—O stretching of polysaccharide or polysaccharide-like compounds. Results also showed that more peaks were collected in surface soils and the absorption intensity are also stronger than those in subsurface soils. In addition, absorption bands richness and intensity of FA fraction suffered less influence from soil type and depth than those in HA and HM fractions. Through analysis of absorption bands, FA fractions had strong aromatization, while aromatization of HA and HM were only stronger under surface soil. The aromatic and aliphatic structures in HA fractions under BO soil were much stronger than those in cinnamon soil. Thus, we conclude that humic substances in 45 years old Robinia pseudoacacia forest soils is influenced by soil depth and soil type, especially in HA and HM fractions.
Introduction
Humic substances (HS) are essential components of soil organic matter formed by biogeochemical degradation of plant debris and animal residue, as well as condensation of the degraded products[1], which are also essential for the stability and ecosystem services of soils. For example, soil HS plays important roles in reductive and oxidative reactions, sorption, porosity, cation and anion exchange capacity, transporting nutrients, sustaining plant growth, forming basic soil structure[2, 3]. The soil HS are often obtained by the classical isolation method as fulvic acid (FA), humic acid (HA) and humin (HM), which are different in functions and could be analyzed by Fourier transform infrared (FT-IR) spectroscopy. Soil HS are originated from plant, animal, microbial materials[3, 4], of which the structure differed with soil properties[5]. The structures of HS are also different among humic fractions, and could be influenced by soil depth and aboveground vegetation[6, 7, 8].
Yimeng mountainous area is typical rocky mountain area of northern China. Robinia pseudoacacia L., Pinus thunbergii Parl. and Platycladus orientalis (L.) Franco were planted during artificial afforestation about 45 years ago to improve the eco-environment. Robinia pseudoacacia were planted both on brown soil (acidic soil developed on granite) and cinnamon soil (calcareous soil developed on limestone). Therefore, the objective of this study was to determine and analyze the structures of FA, HA and HM influenced by soil depth and soil type under 45 years old Robinia pseudoacacia forest.
The studied site, located at Tianbaoshan national forest farm, Pingyi County, Linyi, China (35° 18'N, 117° 44'E). The mean annual precipitation of the study area is 800 mm and the annual mean temperature is 13.7 ℃. Robinia pseudoacacia forest has been planted on northern slope both of brown soil and cinnamon soil for more than 45 years by now.
The surface and subsurface soils were sampled by genetic horizon in October 2015. Three replicates samples were taken at each soil type. Choose three sites under two soil types at mesoslope with 25° of slope. Using spade to make four soil profile each site, and collect surface (O horizon) and subsurface soils (A horizon). Then composite four soil samples to one sample. The fresh samples were sieved (< 2 mm) and stored at 4 ℃. Subsamples were air dried at ambient temperature (22 ℃) for at least one week and stored prior to chemical analysis.
Soil pH was measured in ultra pure water (soil∶ water ratio, 1∶ 2.5) with a glass electrode. Total C (TC) and total N (TN) were determined with an automatic elemental analyzer (Vario Macro Cube, Elementar, Germany). Soil N
Humic substances were extracted followed classic method described as follows. Shaking 5.0 g air-dried soil (< 100 mesh) with 100 mL 0.1 mol· L-1 Na4P2O7— NaOH in conical flask for 1h on boiling water bath. Centrifuge the solution at 10 000 r· min-1 to separate the supernatant, which contains humic acid and fulvic acid. The supernatant was acidified to pH of 2.0~3.0 with drops of 0.5 mol· L-1 H2SO4 and kept at 80 ℃ water bath for 30 min and then stayed overnight. The mixture was filtrated to separate FA from HA precipitate. Dissolve the precipitate with 0.05 mol· L-1 hot NaOH solution to obtain HA. The soil residues after the Na4P2O7— NaOH extraction was treated with 0.5 mol· L-1 H2SO4 to remove Fe, Al oxides and 1 mol· L-1 HF— HCl solution to destroy the connections between clay and humic substances. Then the soil residue was washed by ultra pure water and extracted with 1 mol· L-1 NaOH to obtain HM solution. Take equally FA, HA and HM extracts from three replicates to make a composite solution. Neutralize those solutions to pH 7.0 and then freeze dry FA, HA and HM samples.
Freeze dried FA, HA and HM samples were ground to < 2 μ m and mixed with KBr at 1∶ 100 ratio before grinding and finally to make a slide. All infrared spectra were measured from 4 000 to 400 cm-1 at 4 cm-1 resolution.
The differences between soil horizons were analyzed with a t-test using SPSS 16.0 for Windows. Each set of variables was log transformed when failed normality tests. Nonparametric-test were used when none transformation could pass normality tests. The FT-IR spectra were analyzed by MainFTOS software, to show the differences between spectrum, followed spectra were presented after vertical move.
Basic soil properties were shown in table 1, soil pH of cinnamon soil is significantly higher than that of brown soil but no difference was found between soil depths; Compared with brown soil, cinnamon soil contains more soil TC, TN, N
| Table 1 Surface and subsurface soil properties of brown and cinnamon Robinia pseudoacacia forests |
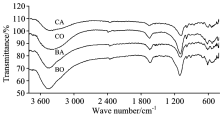
The FT-IR spectra of FA, HA and HM are displayed in Fig.1, 2 and 3, respectively. Fig.1 showed that FA in CO, CA, BO and BA has similar absorption bands only differed in the intensity. A broad band around 3 400 cm-1 can be assigned to stretching vibration of carbohydrate H-bonded OH[9]. Peaks at 1 655 cm-1 were due to aromatic C=C stretching[10]. The sharp and strong peaks centered at 1 110 cm-1 was caused by C— OH stretching of aliphatic OH. Weak bands around 1 030 cm-1 in several spectra were attributed to C— O stretching of polysaccharide or polysaccharide-like compounds[11]. Peaks are also be found around 620 and 532 cm-1 as organic halide C— Br stretching and vibration of soil minerals[10]. The intensities of FA peaks were highest in soil O horizon than those in A horizon and dominated in carbohydrate and aliphatic compounds. Compared between soil types, peaks of cinnamon soil are more board, which indicated more complicated structures than those under brown soil. The results also showed that FA aromatization in CA was weaker than CO, BA and BO soils.
 | Fig.1 FT-IR spectra of soim fulvic acid under brown and cinnamon Robinia pseudoacacia forest CA, subsurface cinnamon soil; CO, surface cinnamon soil; BA, subsurface brown soil; BO, surface brown soil |
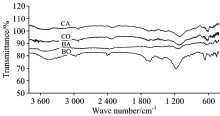
HA from two soils are illustrated in Fig.2. The spectra of HA showed similar peaks but the intensity was weaker than that of FA like peaks at 3 400, 1 655 and 1 110 cm-1. Except for BA, other treatments all have weak peaks at 2 923 cm-1 as aliphatic C— H stretching[12]. BO soil has one more peak at 1 380 cm-1 as CH3 symmetric stretching[13]. All treatments have bands at 1 110 cm-1 as C— OH stretching of aliphatic OH, which has strong intensity under BO soil. Similar bands around 620 and 532 cm-1 like FA were also found in HA. The intensity of the bands of HA was weaker than those of FA and only BO soil had surong peaks. In conclusion, the soil HA under Robinia pseudoacacia forest contained less proportion of carbohydrate and the relative degree of aromatization was weaker in CO, CA and BA soils. Surface soil under brown soil has more carbohydrate and aliphatic compounds than other treatments.
 | Fig.2 FT-IR spectra of soil humic acid under brown and cinnamon Robinia pseudoacacia forest CA, subsurface cinnamon soil; CO, surface cinnamon soil; BA, subsurface brown soil; BO, surface brown soil |
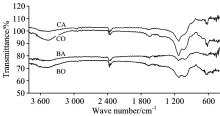
As shown in Fig.3 the stretching vibration of carbohydrate H-bonded OH at 3 400 cm-1 were typically strong in CO and BO than those in subsurface soil. Similar like HA spectra, weak peaks of aliphatic C— H stretching at 2 923 cm-1 were found except for BA soil. The peaks of aromatic C=C stretching at 1 655 cm-1 were also weaker compared with FA. Strong bands at 1 110 and 1 030 cm-1 were found and the intensity were sequenced as CO> CA> BO> BA. Thus, cinnamon soil contained more aliphatic and carbohydrate groups than brown soil. Weak peaks of organic halide C— Br stretching were found around 620 cm-1 under CO, CA and BO soils. Spectra of HM showed that HM contained more carbohydrate and aliphatic compounds than HA but less than FA. The relative degree of aromatization was weaker in HM than that in FA and HA.
 | Fig.3 FT-IR spectra of soil humin under brown and cinnamon Robinia pseudoacacia forest CA, subsurface cinnamon soil; CO, surface cinnamon soil; BA, subsurface brown soil; BO, surface brown soil |
A classical extraction of soil fulvic acid, humic acid and humin from brown and cinnamon soils under Robinia pseudoacacia forest was studied with FT-IR analysis. The results showed FA has more carbohydrate, aromatic and aliphatic structures. Surface soil like CO and BO soil has more carbohydrate, aliphatic and polysaccharide compounds in FA, HA and HM fractions. The relative degree of aromatization was weaker in HM than that in FA and HA. In addition, aliphatic groups were strong in FA and HM compared with HA.
The authors have declared that no competing interests exist.
| [1] |
|
| [2] |
|
| [3] |
|
| [4] |
|
| [5] |
|
| [6] |
|
| [7] |
|
| [8] |
|
| [9] |
|
| [10] |
|
| [11] |
|
| [12] |
|
| [13] |
|