红外光谱结合化学计量学快速鉴别云南重楼不同炮制品
[吴喆1, 2, 3 , 张霁1, 2 , 左智天1, 2 , 徐福荣3 , 王元忠1, 2, *  , 张金渝
, 张金渝1, 2, * ]
, 张金渝]
|
|


作者简介: 吴 喆, 1993年生, 云南中医学院中药学院硕士研究生 e-mail: 15887843024@163.com
中药炮制是根据中医学理论, 改变中药的性味和功效, 以达到缓和药性、 减毒增效等作用。 炮制对中药的活性成分、 药效、 毒副作用影响甚大, 建立一个系统鉴别和评价中药不同炮制品的方法, 可为中药质量和临床用药安全提供重要支撑。 采用红外光谱法对9种云南重楼不同炮制品进行对比分析, 结合化学计量学建立主成分-马氏距离(PCA-MD)判别模型进行鉴别分析。 云南重楼不同炮制品的红外光谱经自动基线校正和纵坐标归一化预处理后, 取其平均光谱图。 九种重楼不同炮制品的平均红外光谱和二阶导数光谱显示: (1)其主要特征吸收峰为3 387, 2 923, 1 745, 1 463, 1 338, 1 240, 1 207, 1 158, 1 180, 1 080, 1 048, 1 020, 988, 921, 895, 859, 833, 765, 708, 572和529 cm-1; (2)重楼不同炮制品红外图谱的峰形基本相似, 可显示出重楼所特有的红外光谱特征; (3)重楼不同炮制品红外图谱中少数特征吸收峰数目、 位置和吸收强度存在差异, 表明重楼经不同炮制后化学成分和含量发生了改变。 红外光谱经多元散射校正(MSC), 标准正态变量(SNV), 一阶求导(1st Der), 二阶求导(2nd Der)和平滑(SG)优化处理后, 采用Kennard-Stone算法筛选训练集和预测集(3∶1), 建立PCA-MD判别分析模型。 结果显示, 重楼不同炮制品的最佳预处理方法为1st Der+SG(11∶3)。 提取前5个主成分, 变量特征的解释能力为88.2%, 以PC1, PC2和PC3为坐标轴建立PCA-MD三维得分图可知, 九种炮制品可完全区分; 其中重楼I, H, G和F的聚类效果最好, 且前三种炮制品距离较近, 表明晒干和烘干处理重楼与传统炮制重楼所含化学成分相似; 重楼D和E空间距离较近, 推测其经过微波和蒸汽高温处理后化学成分变化相似。 预测集样本可准确的归属于训练集, PCA-MD判别模型的准确率为100%。 红外光谱结合PCA-MD判别分析可准确区分云南重楼的不同炮制品, 为云南重楼炮制品的临床应用提供参考, 同时为中药炮制品的鉴别提供了借鉴。
Based on the theory of Chinese medicine, the processing which improves efficacy, property and flavor of traditional Chinese medicine (TCM) is an effective way to moderate property, enhance therapeutic effect or reduce toxicity of TCM. The processing has significant influence on the chemical components, efficacy and toxicity of TCM. Therefore, it is vital to establish a system method to discriminate and evaluate different processed products of TCM, which can provide an important support for the quality and clinical medication security of TCM. In this paper, Paris polyphylla var. yunnanensis which were processed with nine different methods were conducted comparative analysis by infrared spectroscopy combined with chemometrics, and the principal component analysis-Mahalanobis distance (PCA-MD) discriminant model was established to differentiate them. The original infrared spectra data was preprocessed by automatic baseline correction and ordinate normalization, and the averaged spectra were obtained. The averaged and second derivative spectra showed that: (1) The main characteristic absorption peaks were 3 387, 2 923, 1 745, 1 463, 1 338, 1 240, 1 207, 1 158, 1 180, 1 080, 1 048, 1 020, 988, 921, 895, 859, 833, 765, 708, 572 and 529 cm-1. (2) The peak shape of samples was almost alike, which could exhibit the infrared spectral features of processed P. yunnanensis. (3) Some differences of a few characteristic absorption peaks existed in number, position and absorption intensity, which indicated that the chemical components and content were changed after different processing. The infrared spectra data was pretreated by multiplicative scatter correction (MSC), standard normal variate (SNV), first derivative (1st Der), second derivative (2nd Der) and Savitzky-Golay (SG) smoothing. Samples were divided into calibration set and prediction set at the ratio of 3∶1 by Kennard-Stone algorithm. Then, the optimized spectra data were used to establish the discrimination model based on PCA-MD. The results showed that the best spectral pretreatment of PCA-MD model was 1st Der+SG (11∶3). The cumulative accounting was 88.2%, when extracted the first five principal components. The first three principal components were selected for establishing the 3D scattered plot of PCA-DA model. It is obvious that samples with different processed methods could be grouped completely. The clustering result of P. yunnanensis I, H, G and F were better than others, and the first three (I, H and G) were nearer. It indicated that the chemical composition of processing by sun-drying and oven drying were similar to traditional processing method. Additionally, P. yunnanensis D was close to P. yunnanensis E, it conjectured that chemical compositions of processing by microwave drying and steam treatment were similar. The prediction set could accurately conform to the calibration set, and the accuracy of PCA-MD model was 100%. Infrared spectroscopy combined with PCA-MD could distinguish different processed P. yunnanensis accurately. Furthermore, it could provide references for clinical application, discriminating of processed P. yunnanensis as well as other processed TCM.
引 言
中药炮制是根据中医学理论, 对中药原料药进行净制、 软化、 切制、 炮制等加工处理以满足临床用药需求的制药工艺[1]。 炮制是中国上千年文化遗产中的一部分, 主要通过改变中药的性味和功能, 达到缓和药性、 减毒增效等作用, 在疾病的预防和保证临床疗效、 安全方面扮演重要角色。 例如“ 生消熟补” 的典型中药— — 三七, 生三七具止血散瘀之功, 熟三七则以补血滋补力胜[2], 与传统中医理论“ 生熟异效, 各有其功” 相符。 研究发现甘遂经醋炮制后化学成分有明显变化, 毒性皂苷含量下降6.66%~95.25%, 有效降低了甘遂的毒性作用[3]。 蒸制天麻中活性成分天麻素含量高于生品, 可提高中药天麻的临床疗效[4]。 生柴胡经醋炮制后, 其化学成分和药理作用均发生了改变, 且不同种类的醋所炮制的柴胡其化学成分也不尽相同[5]。 炮制对中药活性成分、 药效、 毒副作用等有重要的作用, 建立一个系统鉴别和评价中药不同炮制品的方法, 可为中药的合理使用和临床效应提供保障。
红外光谱属于分子振动光谱, 主要反映分子中官能团的结构特征, 其特有的宏观指纹特性与中药理论的整体、 动态观念相结合, 可体现中药的整体信息, 符合中药评价的系统理论[6]。 红外光谱凭借其快速、 无损、 高效等优势被广泛应用于中药的真伪鉴别[7]、 产地鉴别[8]和采收期鉴别[9]。 本工作采用红外光谱结合多元统计分析对不同产地、 不同品种的野生重楼进行判别分析, 结果表明该法可准确区分不同产地和品种的野生重楼[10]。
云南重楼(Paris polyphylla var. yunnanensis)为百合科重楼属植物[11], 是中国名贵的中药材, 也是云南省重要的特色药用植物资源。 云南重楼的干燥根茎具有抗菌、 抗癌、 免疫调节等药理活性, 是云南白药、 宫血宁胶囊、 楼莲胶囊、 季德胜蛇药片等中成药的主要成分之一[12]。 目前, 对重楼不同炮制品的研究尚未见详细报道。 本工作采用红外光谱法对九种重楼不同炮制品的整体化学成分变化进行对比研究, 结合化学计量学方法建立重楼不同炮制品的主成分-马氏距离(principal component analysis-Mahalanobis distance, PCA-MD)判别分析模型, 以期为云南重楼炮制品合理的临床应用提供参考。
样品经作者核实为百合科植物云南重楼的干燥根茎。 重楼样品制备方法见表1, 样品的炮制方法参照《中国药典》附录Ⅱ D炮制通则。
| 表1 重楼不同炮制品信息 Table 1 Variety names and corresponding numbers of the Paris samples |
仪器: Frontier型傅里叶变换红外光谱仪(美国Perkin Elmer公司), 带有氘化三甘氨酸硫酸酯(DTGS)检测器, 扫描范围4 000~400 cm-1, 扫描信号累加16次, 分辨率为4 cm-1, 扫描时扣除CO2和H2O背景。 XS125A型电子分析天平(瑞士Precisa公司); YP-2型压片机(上海山岳科学仪器有限公司)。
试剂: 溴化钾(KBr)为分析纯(天津市风船化学试剂科技有限公司)。
方法: 取样品重楼粉末1 mg与50 mg KBr充分混合研磨后, 压成均匀透明薄片。 每个样品平行扫描2次, 取平均光谱。
OMNIC 8.0软件对原始光谱进行自动基线校正和纵坐标归一化处理。 TQ Analyst 8.6软件对谱图进行优化处理后建立PCA-MD判别分析模型。 Matlab 2014软件对训练集和预测集样品进行筛选。
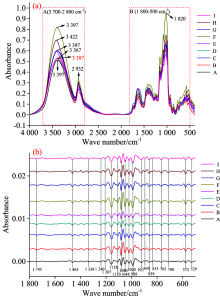
图1(a)为9种不同炮制品的平均红外光谱图。 由图可知, (1)九种重楼不同炮制品的平均红外光谱图的峰形基本相似; (2)不同炮制品的平均光谱峰强度在A区域(3 700~2 800 cm-1)和B区域(1 800~500 cm-1)存在明显差异, 重楼F峰强度明显高于其它炮制品, 重楼H次之; (3)在B区域(即指纹区), 少数吸收峰在位置和强度上有差异。
 | 图1 重楼不同炮制品的红外平均图谱(a)和二阶导数图谱(b)Fig.1 Average spectra (a) and second derivative (b) IR spectra of different processed samples |
为了更直观地比较重楼不同炮制品红外图谱的差异, 对指纹区进行了二阶求导处理[图1(b)]。 二阶导数预处理通过放大细微的差异, 将原始光谱图中重叠的谱带分解成各个子谱带, 增强图谱特征[13]。 如图1(b)和表2所示, 重楼不同炮制品在3 387, 2 923, 1 745, 1 463, 1 338, 1 240, 1 207, 1 158, 1 180, 1 080, 1 048, 1 020, 988, 921, 895, 859, 833, 765, 708, 572和529 cm-1处均有明显的吸收峰。 3 387 cm-1为羟基(O— H)的伸缩振动峰, 2 932 cm-1为亚甲基(C— H)的反对称伸缩振动峰, 1 745 cm-1为酯类羰基(C=O)的伸缩振动吸收峰, 1 200~900 cm-1区域为多糖类特征吸收区, 900~700 cm-1为糖类异构体特征吸收区。 综上所述, 九种重楼不同炮制品绝大部分特征吸收峰一一对应, 但部分特征吸收峰仍存在数目、 位置和吸收强度的差异。
| 表2 重楼不同炮制品的红外谱图峰归属 Table 2 Assignments of the main peaks in the IR spectra of different processed samples |
以传统炮制的样品重楼I为参考, 对比分析九种重楼的不同炮制品, 具体如表3所示: (1)重楼I, B和G在1 658 cm-1附近存在强吸收峰, 其余炮制品在该处无吸收; 除重楼I和A外, 样品在1 620 cm-1处均有吸收; 重楼A, D和G在1 580 cm-1处无吸收, 其余炮制品在此处均有吸收; 在1 367 cm-1(甲基对称弯曲振动)附近, 仅重楼F和H有吸收。 (2)重楼I, A, D, E, F和H在1 650 cm-1附近存在吸收峰, 重楼B、 C和G在此处无吸收; 重楼D与重楼E此峰红移, 在1 634 cm-1附近有吸收峰。 (3)重楼H(3 422 cm-1)与重楼B(3 367cm-1)的吸收峰峰位相差55 cm-1, 与重楼I(3 378 cm-1)相差44 cm-1, 与重楼D(3 487 cm-1)相差35 cm-1, 相差较大。 (4)重楼I和G在810和805 cm-1处为双峰吸收, 其余炮制品中则表现为单峰吸收。
| 表3 重楼不同炮制品的红外图谱峰位置 Table 3 The peak-position of IR spectra of different processed samples |
对重楼不同炮制品的红外光谱进行整体宏观分析可知, 不同炮制品红外谱图的总体轮廓相似(峰形变化极为相似), 且共有峰较多, 可显示出重楼所特有的红外光谱特征。 然而, 部分特征吸收峰仍存在数目、 位置和吸收强度的差异, 表明重楼经不同炮制后化学成分和含量发生了改变。
PCA是通过提取主成分数降低原始数据的维度, 在最大限度减少信息丢失的前提下, 将原来众多具有一定相关性的变量换成较少的新变量[5]。 新变量可最大程度解释原始变量特征[20]。 MD是通过协方差计算光谱间的距离, 并根据其距离对未知样品进行判别分析[21]。 MD由于不受变量间的相关性干扰和纲量的影响, 被广泛应用于化学计量学分析中[22]。 PCA结合MD是计算降维后新变量的MD, 根据度量值对样品进行分类。 PCA-MD综合了PCA和MD的优点, 既保证光谱的完整性, 又不受变量间相关性和单位的影响, 可使PCA-MD判别模型取得更佳的结果。
2.2.1 谱图优化处理
实验利用TQ Analyst 8.6软件对红外谱图进行多元散射校正(multiplicative scatter correction, MSC), 标准正态变量(standard normal variate, SNV), 一阶求导(first derivative, 1st Der), 二阶求导(second derivative, 2nd Der)和平滑(Savitzky-Golay, SG)优化处理。 由表4可知, 最佳预处理方法为1st Der+SG(11∶ 3), 提取前5个主成分时变量特征的解释能力达到了88.2%, 且判别正确率为100%, 故选择此方法建立PCA-MD判别模型。
| 表4 光谱预处理对PCA-MD判别模型的影响 Table 4 Influence of different spectra preprocessing method on PCA-MD discrimination model |
2.2.2 建立判别模型
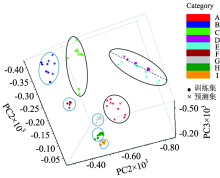
重楼不同炮制品的红外图谱经最佳优化处理后, 提取前五个主成分进行PCA-MD判别分析。 以PC1, PC2和PC3为坐标轴建立三维得分图(见图2), 九种不同炮制品可完全分开。 重楼I, H, G和F的聚类效果好, 且前三种炮制品的距离近, 表明晒干和烘干处理的重楼与传统炮制的重楼所含化学成分相似。 重楼D和E距离较近, 推测其经过微波和蒸汽高温处理后其化学成分变化相似。 重楼经不同炮制后化学成分发生不同程度的改变, 根据其差异可将重楼的不同炮制品完全区分, 且炮制品间差异越大, 其空间距离越大。
 | 图2 PCA-MD三维得分图Fig.2 3D plot of PCA-MD |
2.2.3 判别模型的验证
为消除人为的主观因素和保证判别模型的稳定性, 采用Kennard-Stone算法(K-S算法)[23]对预测集进行选取。 K-S算法是基于欧氏距离, 从总样品中选出具有代表性的子集[24]。 该计算法则是逐步计算的过程, 先计算两两样本间的欧式距离, 选取距离最大的样本, 再计算剩余样本与已选样本间的欧氏距离, 选取与已选样本距离最大的样本, 重复此步骤至所需样本数[25, 26]。 90个样品以3∶ 1的比例通过K-S算法进行筛选, 其中60个样品作为训练集建立判别模型, 30个样品作为预测集对判别结果进行验证。 结果如图2和表5所示, 预测集样本可准确的归属于训练集, 预测集样品与归属类别的马氏距离均较小, 且PCA-MD判别模型的误判数为0。
| 表5 PCA-MD判别分析模型预测结果 Table 5 The results of PCA-MD discrimination model of prediction set |
重楼不同炮制品的原始图谱峰形变化极为相似, 且共有峰较多, 可显示出重楼特有的光谱特征。 经二阶求导放大图谱差异后, 部分特征吸收峰表现出数目、 位置和吸收强度的差异, 表明重楼经不同炮制后化学成分和含量发生了改变。 红外图谱经最佳优化处理后, 利用主成分分析结合马氏距离建立重楼不同炮制品的判别分析模型, 结果表明预测集样本可准确的归属于训练集, 且PCA-MD判别模型的正确率达100%。 基于重楼不同炮制品内在品质的差异, 红外光谱结合化学计量学可准确将其区分, 为重楼在临床中的合理应用提供参考。
The authors have declared that no competing interests exist.
| [1] |
|
| [2] |
|
| [3] |
|
| [4] |
|
| [5] |
|
| [6] |
|
| [7] |
|
| [8] |
|
| [9] |
|
| [10] |
|
| [11] |
|
| [12] |
|
| [13] |
|
| [14] |
|
| [15] |
|
| [16] |
|
| [17] |
|
| [18] |
|
| [19] |
|
| [20] |
|
| [21] |
|
| [22] |
|
| [23] |
|
| [24] |
|
| [25] |
|
| [26] |
|