

光谱法和分子对接方法研究罗利环素与人血清白蛋白的相互作用
[方庆1  , 董澄宇
, 董澄宇1 , 王宇1 , 刘颖1, 2, * ]
, 董澄宇]
|
|


在模拟人体生理条件下, 应用多光谱法和分子对接技术对罗利环素(RTC)与人血清白蛋白(HSA)的相互作用进行了研究。 实验通过消除内滤光来提高荧光数据的准确性。 此外, 荧光光谱和紫外光谱的结果表明RTC与HSA的猝灭方式是静态猝灭, 且在298和310 K温度下的结合位点数分别为1.09和0.95。 在两个不同温度下的结合常数分别为 K298 K=3.13×10⁵ L·mol-1和 K310 K=0.70×10⁵ L·mol-1。 根据热力学参数的计算结果可知, RTC与HSA的结合作用力主要是氢键和范德华力。 取代实验表明, RTC在HSA的Site Ⅰ, ⅡA子域上有一个结合位点。 根据非辐射能量转移理论得到的RTC和HSA氨基酸残基间的结合距离为2.59 nm。 三维荧光光谱表明RTC和HSA的相互作用改变了蛋白质的构象。 此外, 采用傅里叶变换红外光谱法对RTC与HSA作用前后HSA二级结构的变化进行了定量分析, 结果表明, α-螺旋结构含量降低了8.4%, β-折叠含量从30.3%增加到31.4%, β-转角也从15.6%增加到了16.1%。 分子对接进一步显示RTC通过氢键、 疏水作用力、 极性键等多种作用力与HSA的ⅡA子域上氨基酸残基相互作用。 实验结果有助于从分子水平研究RTC和HSA的相互作用。
Biography: FANG Qing, (1992), Master of College of Life and Environmental Sciences, Minzu University of China e-mail: fq19920119@126.com
The interaction between rolitetracycline (RTC) and human serum albumin (HSA) has been investigated by using multi-spectral methods and molecular modeling under physiological conditions. Fluorescence spectra results revealed the presence of static quenching mechanism in the binding of RTC to HSA. The binding constants were of K298 K=3.13×10⁵ L·mol-1 and K310 K=0.70×10⁵ L·mol-1, respectively. The numbers of binding site were 1.09 and 0.95 at two different temperatures. The thermodynamic parameters indicated that hydrogen bond and van der Waals force were the major driving forces for interaction between RTC and HSA. The binding distance of RTC to HSA was calculated to 2.59 nm based on fluorescence resonance energy transfer. UV-Vis absorption spectra and 3-D fluorescence demonstrated that the conformation and micro-environment of HSA were changed with the addition of RTC. FT-IR spectra was used to quantitatively calculate the alternations of secondary structure of HSA with the α-helices content reduction from 51.5% to 43.1%, increasing the content of β-sheet (30.3%~31.4%) and β-turn (15.6%~16.1%). According to molecular modeling studies and site marker competitive experiments, it indicated that RTC bound in the Sudlow’s drug binding site Ⅰ of HSA and the subdomain ⅡA where Lys195, Arg218 and Arg222 residues were located. The work is helpful to understand the interaction mechanism between RTC and HSA at molecular level.
Rolitetracycline (RTC, structure with atom numbers was embedded in Fig.2) is one of the semi-synthetic tetracyclines, which is exceedingly used in human medicine and animal husbandry because of its antibiotic activity against infections caused by both gram-positive and gram-negative organisms[1]. However, tetracyclines can cause adverse effects on the gastrointestinal tract, skin, and central nervous system, being detected in foods, terrestrial and aquatic environment due to their extensive usage and higher adsorption capability[2, 3]. The long-term and the low-dosed exposures of tetracycline residues in the environment will lead to potentially risk to both ecological safety and human health.
Human serum albumin (HSA) is the most abundant protein in the circulatory system, which constitutes up to 60% of the total protein content and provides about 80% of the osmotic pressure of blood[4]. HSA is a globular protein containing three homologous helical domains (Ⅰ — Ⅲ ), each divided into two subdomains (A and B) and composed of 585 amino acid residues. Besides, two major ligand binding sites were found, one located in subdomain Ⅱ A and one in Ⅲ A, which are known as Sudlow Ⅰ and Sudlow Ⅱ sites, respectively[5]. In human body, HSA has many functions such as serving as a transport vehicle, taking part in the distribution and the metabolism of various exogenous, maintaining osmolarity in plasma and intestinal fluids and so on.
Drug-protein interaction is a crucial pharmacological phenomenon that affects structure, physiological action of carrier protein, distribution and elimination of drugs[6]. As an exogenous contaminant, the knowledge of the binding between RTC and HSA is important to understand the possible dangers of RTC to the human body. Previously, the binding of tetracycline antibiotics to HSA has been examined, and the interaction between RTC and BSA also has been reported[7]. However, whether and how RTC affect the conformation and function of HSA still remains unclear. With above background, it is important to investigate the binding mechanism between RTC and HSA.
In the study, it aimed to study the binding mechanism of RTC with HSA through molecular modeling and multi-spectral techniques under simulative physiological conditions. Various analytical techniques (FTIR spectra, UV-Vis spectroscopy, three-dimensional fluorescence spectra and fluorescence spectroscopy) applied to investigate the protein-ligand interaction. The study can provide the basic data for understanding the interaction mechanism of RTC to HSA in vitro.
RTC (Fluka, Germany) was dissolved and diluted to 1.0× 10⁻³ mol· L-1 with ultrapure water. 1.0× 10⁻⁴ mol· L-1 HSA (Sigma, USA) work solutions were prepared. 1.0× 10⁻³ mol· L-1 phenylbutazone and ibuprofen, Tris-HCl buffer solution (pH 7.40) and 0.1 mol· L-1 NaCl were prepared, respectively. All the above solutions were kept in the dark at 0~4 ℃.
Fluorescence spectra, FT-IR spectra, three-dimensional fluorescence spectra UV-Vis absorption spectra and molecular modeling were measured according to Ref.[8].
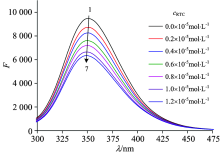
The effect of RTC on HSA fluorescence spectroscopy is shown in Fig.1. Upon excitation at 280 nm, the fluorescence intensity of HSA at about 350 nm decreased gradually with the addition of RTC when the concentration of HSA was fixed. These observations may be referred to a strong binding of RTC to HSA. Besides, it implies that the interaction between RTC and HSA has changed the structure of HSA and the microenvironment around the fluorophore.
 | Fig.1 Effect of RTC on the fluorescence spectrum of HSA (T=298 K) cHSA=4.0× 10⁻⁶ mol· L-1; cRTC(1→ 7): 0, 0.2, 0.4, 0.6, 0.8, 1.0, 1.2 (× 10-5 mol· L-1) |
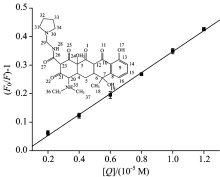
In order to speculate the fluorescence quenching mechanism, the fluorescence quenching data were firstly analyzed by using the classical Stern-Volmer equation according to Ref.[8]. Fig.2 shows the Stern-Volmer plots for the HSA fluorescence quenching by the RTC at 298 K and the calculated Ksv and kq values are 3.68× 10⁴ L· mol-1 and 3.68× 10¹² L· mol-1· s-1. The results displayed that the kq values were much greater than 2.0× 10¹⁰ L· mol-1·
 | Fig.2 Stern-Volmer plots for the quenching of HSA by RTC at 298 K cHSA=4.0× 10⁻⁶ mol· L-1 |
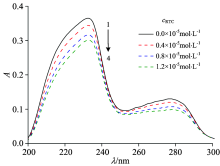
UV-Vis spectroscopy is a useful and valuable tool to study conformational changes of proteins after binding to ligands. As shown in Fig.3, there are two obviously absorption peaks, one strong absorption peak at about 233 nm reflects the framework conformation of the protein, and another weak absorption peak at about 278 nm appears to be due to the aromatic amino acids (Trp, Tyr and Phe)[8]. With addition of RTC to HSA solution, the intensity of the peak at 233 nm and 278 nm gradually decreased, indicating that the interaction mechanism between HSA and RTC was a static quenching process which was consistent with fluorescence quenching results.
 | Fig.3 UV-Vis spectra of HSA in presence of different concentrations of RTC cHSA=1.0× 10⁻⁵ mol· L-1; cRTC(1→ 4): 0, 0.4, 0.8, 1.2 (× 10-5 mol· L-1) |
In protein-ligand association, several equations have been employed for binding constant calculation. For static quenching, the binding constant (K) and the number of binding sites (n) were described and given by the equation according to Ref.[8]. Values of K and n are given in Table 1, respectively. The value of K obtained is of the order of 105, revealing there is a strong binding of RTC to HSA. And the value of n is close to 1, which means that one molecule of RTC combines with one molecule of HSA.
| Table 1 Binding constants and thermodynamic parameters of the RTC-HSA system |
Several forces such as hydrogen bonds, van der Waals, electrostatic and hydrophobic forces were responsible for the interaction between the ligand and protein[9]. The thermodynamic parameters, enthalpy change (Δ H), entropy change (Δ S) and free energy change (Δ G) of reaction were the main evidence for confirming the binding mode. The thermodynamic parameters were obtained by utilizing Van’ t Hoff equation according to Ref.[8].
The values of Δ G, Δ H and Δ S are listed in Table 1. The negative Δ G values indicated that RTC binding to HSA was a spontaneous inter-molecular reaction. Additionally, negative Δ H and negative Δ S values indicated that hydrogen bond and van der Waals force were the major driving forces in the interaction of RTC to HSA.
The efficiency of energy transfer can be used to evaluate the distance between the ligand and fluorophore in the protein[6]. The distance (r) between donor (Trp214 of HSA) and acceptor (RTC), the efficiency of energy transfer (E) and the critical energy transfer distance (R0) can be calculated by Fö ster’ s non-radiative energy transfer theory according to Ref.[8].
J can be evaluated by integrating the spectra in Fig.4. For HSA, K2=2/3, N=1.36 and Φ =0.15[8], according to Ref.[8], it can be calculated that J=1.45× 10⁻¹⁵ cm3· L· mol-1, E=0.11, R0=1.83 nm and r=2.59 nm. The donor to acceptor distance r is less than 7 nm and 0.5R0< r< 1.5R0, implying the existence of static quenching because of complex formation between HSA and RTC[6].
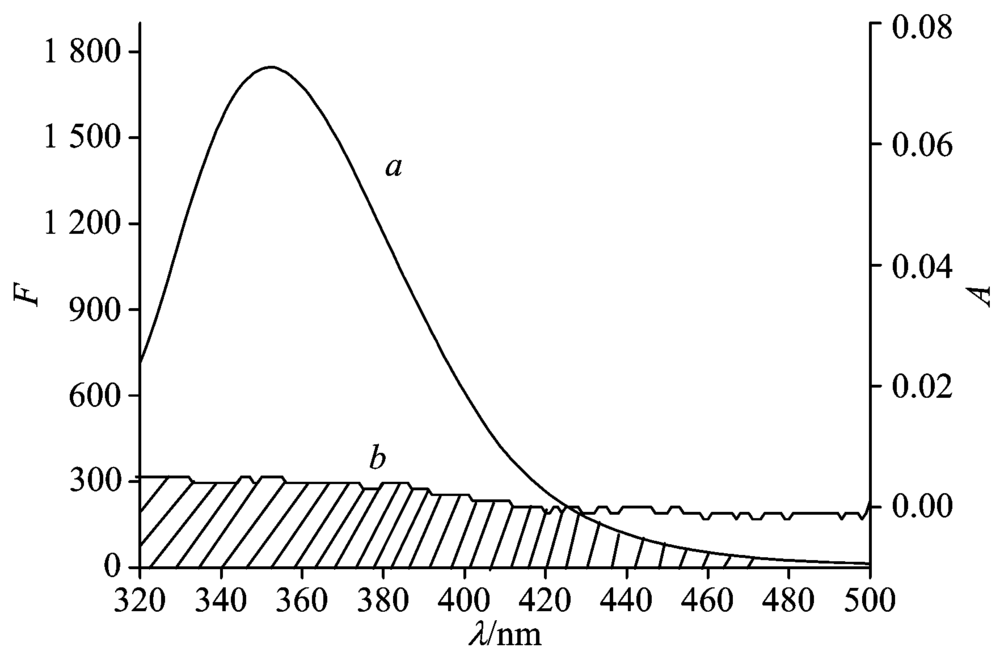 | Fig.4 Overlapping between the fluorescence emission spectrum of HSA (a) and UV-Vis absorption spectrum of RTC (b) cHSA=cRTC=2.0× 10⁻⁶ mol· L-1 |
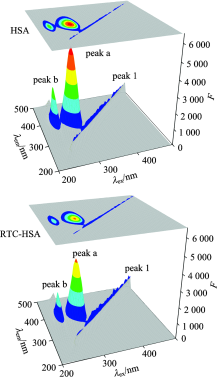
Fig.5 shows 3-D fluorescence spectra and corresponding contour maps of HSA and RTC-HSA system, respectively. It can be seen in Fig.5 that HSA has two mainly peaks, in which the strong peak a reflects fluorescence spectral behavior of lone tryptophan residue, and the weak peak b represents the spectral behavior of the polypeptide backbone structures of HSA[10]. When RTC was added into HSA solution, the fluorescence intensity of peak a decreased obviously from 5 287 to 4 239, indicating that the alterations of microenvironment of tryptophan residues, and the fluorescence intensity of peak b reduced from 3 040 to 2 367 which revealed that the polar environment of the polypeptide backbone structure of HSA has been changed. In conclusion, it can confirm that the interaction of RTC to HSA can induce some changes of polarity and micro-environment of protein.
 | Fig.5 Three-dimensional fluorescence spectra of HSA and the HSA-RTC system cHSA=cRTC=2.0× 10⁻⁶ mol· L-1 |
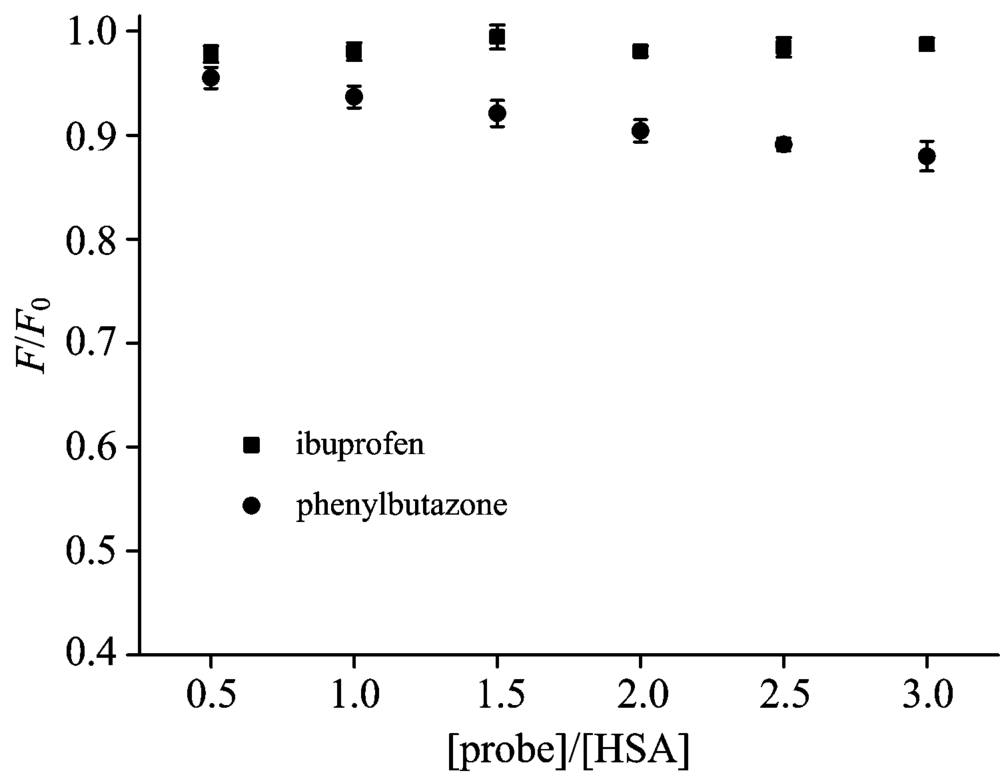 | Fig.6 Effects of site marker probes on the fluorescence of RTC-HSA cHSA=2× 10⁻⁶ mol· L-1, cRTC=1× 10⁻⁵ mol· L-1 |
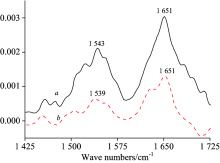
FT-IR spectroscopy is a reliable and effective method to identify the changes of structure of proteins. There are two major IR bands of HSA molecule, in which Amide Ⅰ appears 1 700~1 600 cm-1 region due to the C=O stretching vibration and gives some information about secondary structure of HSA, and Amide Ⅱ arises in the 1 500~1 600 cm-1 region because of coupling of C— N stretch and N— H bending mode[11]. In general, Amide Ⅰ is more sensitive to secondary structure changes than Amide Ⅱ . Hence its analysis is more useful for the study of structural changes induced by diverse factors[12]. The FTIR spectra of HSA in the absence and presence of RTC is shown in Fig.7. After the addition of RTC, the peak position of Amide Ⅱ band slightly shifted from 1 543 to 1 539 cm-1 and Amide Ⅰ band did not shifted, the peak shape of both IR bands also changed, implying the structure and conformation of HSA has been changed due to the binding of RTC to HSA.
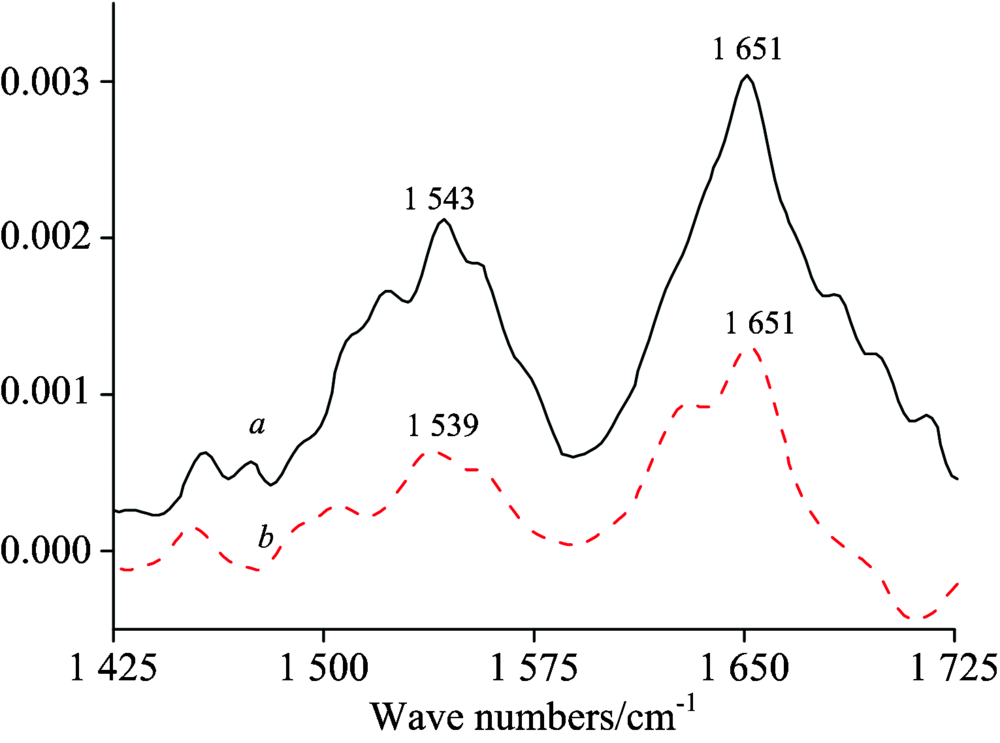 | Fig.7 FT-IR spectra and difference spectra of free HAS a: The FT-IR spectra of free HSA; b: The FT-IR difference spectra of HAS cHSA=cRTC=1.0× 10⁻⁵ mol· L-1 |
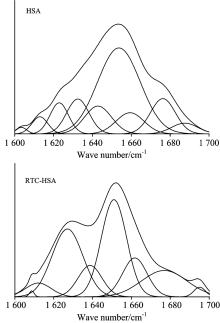
According to the literature[8], the spectral ranges 1 660~1 700, 1 650~1 658, 1 640~1 650 and 1 610~1 640 cm-1 are assigned to β -turn structure, α -helix, random coil and β -sheet, respectively. The curve-fitted FTIR spectra of HSA Amide Ⅰ band before and after adding RTC are illustrated in Fig.8. To compare more meaningfully the percentage of secondary structure of HSA in the absence and presence of RTC, the each secondary structure (α -helix, β -turn, β -sheet and random coil) content of HSA was calculated using the method according to Ref.[8]. It can be obtained that the free HSA contained α -helix (51.5%), β -sheet (30.3%), β -turn structures (15.6%), and (2.6%) random coil. Upon interaction with RTC, the contents of secondary structural compositions of the protein were changed to be 43.1% α -helical, 31.4% β -sheet, 16.1% β -turn structures, and 9.4% random coil. These results suggested that the interaction of RTC and HSA caused the structural variation of protein which was consistent with the results of 3-D fluorescence spectrometry experiment.
 | Fig.8 Curve-fitted infrared spectra of HSA amide Ⅰ band before and after adding RTC cHSA=1.0× 10⁻⁵ mol· L-1; cRTC=1.0× 10⁻⁵ mol· L-1 |
To confirm the specificity of RTC binding site on HSA, the site marker competitive experiments was carried out by
using site markers ibuprofen and phenylbutazone at room temperature[11]. Each tested compound binds to HSA with high affinity, occupying the following binding sites: phenylbutazone (Sudlow’ s Site Ⅰ , subdomain Ⅱ A), ibuprofen (Sudlow’ s Site Ⅱ , subdomain Ⅲ A)[13]. As shown in Fig.6, the site marker (phenylbutazone) has a significant effect on the interaction RTC-HSA system while the ibuprofen has no effect. It was concluded from the site marker competitive experiments that RTC can bind to Sudlow’ s site Ⅰ in the subdomain Ⅱ A of HSA where was located consistent with phenylbutazone.
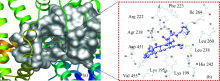
To obtain more detail information about the RTC-HSA system binding sites, molecular modeling has been used to simulate the interaction between RTC and HSA. The optimum binding mode and binding site are given in Fig.9. The amino acid residues lining this binding site are composed of Lys195, Lys199, Arg218, Arg222, Phe223, His242, Leu260, Ile246, Asp451, Val455, ect. Hydrogen bonds exist between the RTC and HSA: O11 in the RTC with Arg218 and Arg222 residues, O17 and O25 in the RTC with Lys195 residue, respectively. The N30 and O19 of RTC bound to Arg222 residues by polar force and the hydrophobic interactions (RTC with Leu219, Phe223, Leu238, Leu260, ect.) are also present. It was reported that the entrance of the pocket of subdomain IIA is surrounded by positively charged amino acid residues such as Lys195, Lys199, Arg218, Arg222 and His242[8]. The docking results showed that RTC bound to the site Ⅰ (subdomain Ⅱ A) which was consistent with the results from the site marker competitive experiments.
 | Fig.9 (a) RTC in the binding pocket of HSA, HSA is shown in cartoon, the interacting side chains of HSA are displayed in surface mode and RTC is represented using balls and sticks; (b) Molecular modeling of the interaction between RTC and HSA, The atoms of RTC are blue |
The distances and driving forces between the protons of RTC and adjacent residues are shown in Table 2. It can be seen that the bond length of all the active site residues and RTC is less than 5 Å , including the amino acid residues Lys195, Lys199, Trp214, Arg218, Arg222, Phe223, Leu238, His242, Leu260, Asp451, ect. Furthermore, the bond length of Trp214 and RTC is less than 7 nm, corresponding to the analysis of Energy transfer between RTC and HSA. The estimated binding energy (Δ G) is a negative value, indicating that interaction of RTC and HSA was spontaneous procedure.
| Table 2 Atoms involved in hydrogen bond, hydrophobic and polar forces of RTC with HSA and the distance between them, analyzed from the molecular docking results |
In this paper, the binding of RTC to HSA was characterized by multi-spectroscopy and molecular docking approaches. The results indicated that the fluorescence intensity of HSA was quenched by a static quenching mechanism. UV-Vis spectroscopy and 3-D fluorescence spectra revealed the conformational and micro-environmental alteration of HSA after the addition of RTC. FT-IR spectra indicated that the significant decreased in α -helix conformation and the increase in β -sheet conformation was induced by the binding between RTC and HSA. The thermodynamic parameters suggested that hydrogen bond and van der Waals force were the major driving forces for interaction of RTC to HSA. The binding distance of RTC to HSA (2.59 nm) was less than 7 nm which indicated energy transfer occurred between RTC and HSA. The site marker competitive experiments and molecular modeling which concluded that RTC bound to the site Ⅰ of HSA and the subdomain Ⅱ A where Lys195, Arg218 and Arg222 residues were located. Thus, these results will offer more detailed information about the interaction mechanism between RTC and HSA to understand the effect on the absorption, distribution, metabolism and toxicity of RTC and alter the functions and structure of HSA in vitro.
The authors have declared that no competing interests exist.
| [1] |
|
| [2] |
|
| [3] |
|
| [4] |
|
| [5] |
|
| [6] |
|
| [7] |
|
| [8] |
|
| [9] |
|
| [10] |
|
| [11] |
|
| [12] |
|
| [13] |
|