

一种新的多元校正模型分子光谱传递方法
[曹玉婷1 , 袁洪福2, *  , 赵众
, 赵众1 ]
, 赵众|
|


无论是近红外还是红外光谱, 多元校正模型的传递问题都尚未解决。 为了实现模型和光谱的传递, 提出了一种改进的PDS算法——SA-PDS算法, 论方法通过PDS算法进行模型传递, 使用光谱间的夹角大小作为判定准则来选择传递参数, 使得模型传递过程不受到样品性质参考值的影响, 也不再依赖于模型, 并且可以双向传递。 该方法分别通过在近红外数据和中红外数据中应用来证明模型传递的可行性, 实验收集烟叶样本测得其近红外光谱, 沥青样本测得其中红外光谱, 将烟叶总糖会计师和沥青蜡含量作为模型预测对象。 使用光谱夹角作为PDS参数选择标准与使用预测标准偏差作为判定准则相比, 实验表明: 对于近红外光谱的从机向主机的传递, 其验证集预测精密度RMSEP从5.257 4降低至1.337 1, 优于RMSEP(1.350 3)方法, 预测偏差也同样被改善。 对于中红外光谱从机向主机的传递, 新方法验证集预测精密度RMSEP从0.525 1降低至0.186 9, 优于RMSEP(0.219)方法。 主机向从机的传递也取得了满意的传递结果。
Biography: CAO Yu-ting, (1993—), graduate of Beijing University of Chemical Technology
Whether it is for near-infrared (NIR) spectra or mid-infrared (MIR) spectra, the issue of multivariate calibration model transfer between spectrometers has not been satisfactorily solved yet. To realize the sharing of model or spectra between the spectrometers, an improvedpiecewise direct standardization (PDS) method, Spectra-Angle-PDS (SA-PDS), is proposed in this work. Spectral angle (SA) measurement which can evaluate the similarity between spectra or the difference between the spectral vector and the shape of the spectral curve is used as a criterion for optimization of parameters of PDS. The model transfer no longer needs reference data so that the model transfer is not affected by the error of properties of validation samples and the model. The model transfer from master spectrometer to slave one or opposite on the contrary can be more easily realized with SA-PDS. The proposed spectra transfer method (SA-PDS) has been applied to predict the content of glycosides in tobacco and thecontent of wax in asphalt using NIR and MIR spectra respectively. The PDS method using RMSEP to select parameters has also been performed for comparative study of the proposed model transfer technique. For the spectra transfer from salve to master spectrometers of NIR, comparative experiment results have shown thatthe root-mean-square error of prediction (RMSEP)with the proposed SA-PDS method is reduced from 5.257 4 (before transfer) to 1.337 1 (after transfer), and much smaller than that with PDS method (1.350 3). For the spectra transfer from salve to master spectrometers of MIR, the precision of model transfer also improved significantly, accompanied by the reduction in RMSEP from 0.525 1 to 0.186 9, is proven to be better than that with PDS method (0.219 4). The satisfactory spectra transfer results with the proposed SA-PDS method from the master spectrometer to the slave spectrometer has also been verified.
Near-infrared (NIR) spectroscopy and middle infrared spectroscopy (MIR) belong to molecular spectroscopy which can elucidate the sample information of both composition and properties at molecular level. Being of fast, non-destructive, determining multi-properties simultaneously, NIR has been proven to be an effective method in many areas including petrochemical[1], agriculture[2], pharmaceutical[3], food[4], quality monitoring[5] et al. For example, China imports about 70 million tons of soybeans per year and much of them is used for feeds. NIR methods have been widely used to test the composition of the feeds in production in China. More than 1000 NIR spectrometers have been applied to the quality control in feed industry[6]. On the other hand, more and more portable FTIR spectrometers combined with multivariate methods have been applied to quality control in many areas such as coating industry and used lubricant oils[7]. As the new generation of industry called as German industry 4.0 or China manufacture 2025 is coming quietly, the fast analytical techniques based on molecular spectroscopy combined with multivariate methods have been attracted more and more attention.
The fast molecular spectral analysis technique operates all based on multivariate calibration model. However, whether it is for NIR or for MIR, the issue of multivariate model transfer between spectrometers has not been satisfactorily solved yet. Typically, the spectra measured on two different spectrometers for the same sample usually are different, although the spectrometers are required to be made as much as the same, the spectral difference between them is still there. This causes that performance of the multivariate calibration model established on a spectrometer, called as master spectrometer, decreases when used on other spectrometers, called as slave spectrometers. In worse cases, the model can't work on slave spectrometers at all[8]. The most direct way to solve this problem is to rebuild the model on the new spectrometers, but developing a multivariate model on each spectrometer respectively is difficult because of the high cost and resource constraints. Therefore, the important technique needed to be broken through is realizing the spectra transfer[9, 10] between the spectrometers successfully, which is the technical bottleneck for the large scale application of spectroscopy analysis.
A few calibration updates and standardization methods for spectra transfer have been reported[11]. For example, slope/bias (S/B)[12] is proposed to correct the predicted values for spectra measured on the slave spectrometer. The other methods, such as direct standardization (DS)[13] and piecewise direct standardization (PDS)[14] are proposed to correct the spectra measured on slave spectrometer. PDS is probably the most widely used method among the existing ones because it can get more accuracy results in complex conditions[15]. The idea of PDS is to find a transfer matrix, which transforms the spectra of samples measured on slave spectrometer into the spectra as if they were measured on master spectrometer. The transfer matrix can be calculated using the spectra of transfer samples measured on both master and slave spectrometers, respectively. Three key parameters of the matrix are the number of transfer factors (Nlv), the number of transfer samples (Ns), and the half-width of the window (k). The quality of them is crucial for the model transfer. They are optimized according to the root-mean-square error of prediction (RMSEP) obtained using the corrected spectra of slave spectrometer by the calibration model of master spectrometer. The representativeness of the transfer samples is very important for the optimization of the key parameters. Yuan et al[16] proposed theRank-kennard Stone(Rank-KS) method in which the selection of the samples is based on the distribution of spectral space and property space simultaneously, thus, the transfer samples selected has great representativeness and wide coverage.In order to compare easily below, the PDS methods of parameter optimization based on the comparison of RMSEP are called as RMSEP-PDS. To get the value of RMSEP, the validation samples need to have property values (reference values), however, not only the validation samples will be expensive for determination of reference data and difficult available sometimes, but also the error in reference data will affect the optimization of parameters of PDS. So far, few methods of model transfer have been reported to achieve complete spectral correction without requiring reference data of the validation sample. In this work, a new spectra transfer method is proposed, which uses the spectral angle (SA) between spectra as the criterion to optimize the parameters of PDS instead of RMSEP. The proposed spectra transfer method (SA-PDS) has been applied to predict the content of glycosides in tobacco and the content of wax in asphalt using NIR and MIR spectra respectively. The comparative experiment results have verified the feasibility and effectiveness of the proposed method.
The PDS method was developed and described in detail in the papers by Kowalski et al[17], In PDS, the relationship between the spectra measured by two different spectrometers can be established. The spectra measured on one spectrometer Zm can be transferred to match the spectra of another spectrometer Zs, by a transformation matrix F, to construct the transformation matrix, each data length of the target spectrum Zm, n is regressed on the corresponding spectral window of the transfer spectrum Zs, n=[Zs, n-k, Zs, n-k+1, …, Zs, n+k-1, Zs, n+k] according to the PLS regression model: Zm, n=Zs, nbn, the regression vectors bn (n=1, …, q) are obtained, then set bnas the diagonal element of the transformation matrix, and the other elements are 0, the diagonal matrix F=diag (
According the principle of PDS, three key parameters of PDS method including the number of transfer factor (Nlv), the number of transfer samples (Ns), and the half-width of the window (k) will seriously affect the performance of matrix F, therefore, in the process of model transfer, to obtain optimal F, three parameters need to be selected according to certain rules.
In this paper, SA which can evaluate the similarity between spectra or the difference between the spectral vector and the shape of the spectral curve is used as a criterion for optimization of parameters of PDS.
In SA method, the representativeness of the transfer and validation samples is also very important to optimization, thus, Rank-KS method is used to select validation set and transfer set of having great representativeness and wide coverage.The spectra were pre-treated with multivariate scatter corrected (MSC)[18] to remove noise, baseline drift and wavelength drift.
The specific steps to determine the optimum Nlv, Ns and k according the criterion are as follows:
(1) Determine the optimum Nlv
Step 1: Set the k value of the default value of 7, Ns value is the number of transfer samples originally collected, change the Nlv in the range of 1~X (X less than 15), a series of transformation matrix {Fp1, Fp2, …, FpX} can be obtained by PDS method;
Step 2: Correct the spectra of m validation samples Ztest by {Fp1, Fp2, …, FpX} according to formula (4), {Zp1, Zp2, …, ZpX} can be obtained.
Step 3: Calculate the angle between target spectrum Zm and the transferred spectrum Zt for each validation sample according to formula (5). A series of spectra angles {θ p1, θ p2, …, θ pm} can be acquired. And the average value of angles {
Where < , > presents the inner product of two vectors, arc presentsthe inverse trigonometric function.
Step4:Select the smallest
(2) Determine the optimum Ns
Set the k value of the default value of 7, Nlv is the optimum Nlv value determined, !change the number of transfer samples in the range of 2~S (S is the number of transfer samples original collected), a series of transformation matrix {Fs2, Fs3, …, Fss} can be obtained by PDS method, the spectra angle between target spectra and the transferred spectra {
(3) Determine the optimum k
Set Nlv and Ns are the optimum value determined respectively, change the k in the range of 1~Y (Y is less than 20), a series of transformation matrix {Fk1, Fk2, …, FkY} can be obtained by PDS method, the same as the process of determining the optimum Nlv and Ns, the spectra angle {
2.1.1 Materials and Instruments
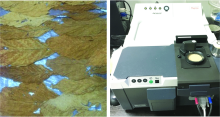
208 tobacco samples from the Yunnan province were provided by the China Tobacco Yunnan industrial Co. Ltd, as shown in Fig.1(a). They include different varieties and grades of tobacco. The glycosides content which is one of properties tested routinely was utilized for building multivariate model and determined according to “ Tobacco and tobacco products-water soluble sugars-Continuous flow method” (YC/T 159-2002). The glycosides contentof the samples ranges from 7.1% to 41.6%. The first and second generation of NICOLET ANTARIS FT-NIR spectrometers were used to collect the NIR spectra of the tobacco samples as shown in Fig.1(b).
 | Fig.1 Samples and spectrometer (NIR) (a): Tobacco samples; (b): NICOLET ANTARIS FT-NIR |
2.1.2 Spectra measurement
In experiments, the tobacco leaves were ground to 40 meshes, then about 6 g powders of the samples were taken and put into the rotating quartz cup accessory. The diffused reflectance spectra were collected at room temperature (22~25 ℃) from 4 000 to 10 000 cm-1 with a resolution 8 cm-1 and with 72 scans, further, each sample was measured at least 3 times and their average was used as the spectrum of the sample.
2.1.3 Calibration model development
50 samples were selected as the validation set, remaining 158 samples served as a calibration set. The spectra of calibration samples measured on master spectrometer are used to develop PLS calibration model. In PLS, the number of latent variables (LV) was chosen according to the curve of prediction residual error sum of squares (PRESS). For the NIR of tobacco, the entire wavelength range of the spectra was pre-processed to the first derivative using the Savitzky-Golay(S-G) method with a 25-point window and a second-order polynomial, and theglycosides content model were built.
2.2.1 Materials and Spectrometers
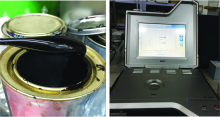
162 substrate asphalt samples were collected from Jiangsu province, Urumqi city, Liaohe, Qinhuang Island and Karamay, China as shown in Fig.2(a). The samples of substrate asphalt are dark and solid at room temperature. The wax content of asphalt samples were determined by “ Test method for wax content of asphalts” (SH/T 0425-2003), and they were distributed from 1.50% to 2.64%. Their mid-infrared spectra were obtained with two Agilent 5500 FTIR spectrometers equipped with ATR accessory as shown in Fig.2(b).
 | Fig.2 Samples and spectrometer (MIR) (a): Asphalt samples; (b): Agilent 5500 FTIR |
2.2.2 Spectra measurement
In this study, about 0.5 g of asphalt was taken and put on the crystal surface of ATR accessory, the sample was heated using a homemade heater at 70 ℃ to melt and spread over all the surface. The spectra were acquired from 650 to 4 000 cm-1 with a resolution 4 cm-1 and with 32 scans. Each sample was measured at least 3 replicates of spectrum and their average was used as the spectrum of sample.
2.2.3 Calibration model development
134 samples were selected as the calibration set and 28 samples served as a validationset. The spectra of calibration samples measured on master spectrometer are used to develop PLS calibration model.For MIR data of asphalt, the spectra pre-treated with SG method (1st derivative, the order of the polynomial was 2, and window width was 35) was used to develop the wax content PLS model.
The transfer direction depends on need of the specific application. Usually, there are two directions, that’ s slave spectrometer to master one, or in the reverse direction. In most cases, the original model built on master spectrometer is shared by slave ones, the spectra of slave spectrometers are modified to match the spectra of the master spectrometer. Sometimes, in the beginning the new spectrometer needs an initial model which is transferred from master spectrometer, then the model is updated by supplementing new calibration sample on slave spectrometer continually in application.The evaluation of model transfer usually was based on comparison of the prediction results of the corrected spectra by original model with their reference data. However, not only it will be expensive to determine the reference data anddifficult to collect the validation samples sometimes, but also the error in reference data will affect the optimization of parameters of PDS. In this study, SA was proposed as the criterion to optimize the parameters of PDS without using reference data so that the limitations would obviously be reduced for the model transfer. The new model transfer method also easily allows both transfer directions between master spectrometer and slave ones because of no need of reference data.
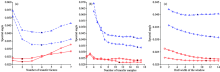
In PDS, three parameters including Nlv, Ns and k need be determined to obtain the transfer matrix F. The F was used to establish the mathematical relationship between the spectra measured on master and slave spectrometers, therefore, the optimization of transfer parametersis crucial for any direction of model transfer. In SA-PDS method, the selection of parameters was based on the spectral angles between thetarget spectra and corrected spectra. The smaller the angle, the higher the similarity of spectra. For two transfer directions of MIR and NIR spectra, the spectral angles of different Nlv, Ns and k were calculated respectively, the evolution of the spectralangles with the three parameters of PDS, shown in Fig.3, indicates the direct effect of Nlv, Ns and k on the results of spectra transfer. Specific analysis is discussed as follows:
(1) Number of transfer factors. It was shown in Fig.3 that the angle varies significantly with the change of Nlv. A too small Nlv may cause the process to become under fitting, and a too large Nlv will lead to the process over fitting. According to the criterion for optimization of parameters, the optimal Nlv locates at the lowest point of the curve. For two transfer directions of NIR, the optimal Nlv is 4, for MIR, the optimal Nlvis 2. It is also found that the change range in angle for NIR is larger than for MIR.
(2) Number of transfer samples. The Ns is a crucial transfer parameter. In general, the larger the Ns the higher the probability that nice results will be achieved. However, more samples mean higher costs and added work. Therefore, in practice, using fewer transfer samples to achieve satisfactory results is preferred. In order to select transfer sample set which has representative in spectral space spanned by all the samples, the transfer samples were chosen by Rank-Kennard-Stone (Rank-KS) algorithm. As shown in Fig.3(b), only few transfer samples are needed to reach quite low angle value.
(3) Half-width of the window. From Fig.3(c), it is seen that the angle decreases with the increase of k, however, at a certain value of k, the angle value cannot reduce significantly.
 | Fig.3 Spectral angle versus number of transfer factors (a), number of transfer samples (b) and half-width of the window (c) circle: transfer from slave to master of MIR, triangle: slave to master of NIR, square: transfer from master to slave of MIR, diamond: master to slave of NIR; Red color: MIR data, blue color: NIR data |
According to the criterion of the minimum spectra angle, the optimum values of Nlv, Ns and k were chosen, identified and shown in Table 1.
| Table 1 The determination of parameters in SA-PDS standardization |
The effect of the new method will be shown by the similarity between the spectra of master spectrometer and the spectra of slave spectrometer after being transferred, and comparison of the prediction results of master spectra, slave spectra and transferred spectra by original model. The similarity is represented by SA between the spectra, the smaller the angle, and the higher similarity.
3.3.1 Spectra transfer results of NIR
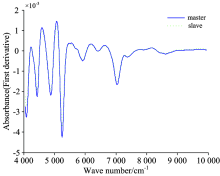
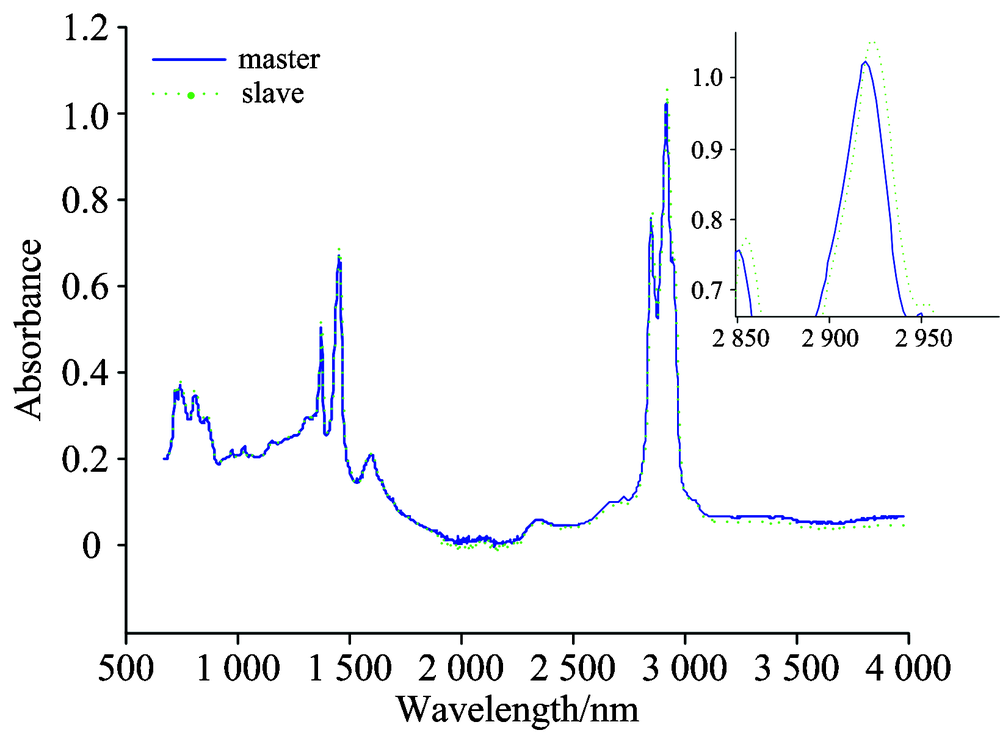
A tobacco sample is random chosen for comparing the similarity of spectra before and after spectral transfer. The values of Nlv, Ns and k as shown in table 1 are used. Fig.4 and Fig.5 depictthe changes of first derivative NIR spectra of this sample measured on the master and slave spectrometers before and after corrected. It is clear that the dramatic spectral differences between two spectrometers were greatly reduced after the spectral correction. The SA reduced from 0.082 8 to 0.032 9, showing the considerable effects of SA-PDS method. Further, the validation samples were used to test the performance of the transfer method, the calibration model built by master spectrometer were employed to predict the content of glycosides in tobacco, for comparison, the prediction results of master spectra, slave spectra and transferred spectra were all calculated, RMSEP and bias as the criteria of precision and accuracy of the prediction results.
 | Fig.4 The first derivative NIR spectra of a sample measured on the master and slave spectrometer |
 | Fig.5 The first derivative NIR spectra of a sample measured on the master and slave spectrometer after corrected |
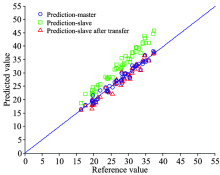
The plot of reference versus predicted values for different spectra is shown in Fig.6. In the figure, the points on the straight line signify that the predicted values are equal to the reference ones. From the figure, the blue points are evenly distributed on both sides of the straight line. The distribution of these points shows that the original model can predict the spectra measured on master spectrometer with high accuracy. However, the green points are deviated from the straight line seriously and distributed above the line, it indicates that the original calibration model cannot be applied to the slave spectrometer directly, the differences of spectrometers caused significantdeviations in the prediction of slave spectra. The red points in the figure represent the predicted results of the spectra transferred by SA-PDS method, they are symmetrically distributed of the straight line and close to the blue points. The variation in the distribution indicates that the differences of spectrometers were significantly reduced, and the calibration model can successful applied to the spectra after transferred by SA-PDS method.
 | Fig.6 The predicted results of the spectra measured on master spectrometer and slave spectrometer before and after transfer (NIR) |
3.3.2 Spectra transfer results of MIR
MIR and NIR belong to molecular spectroscopy which can describe the sample information in both composition and properties at molecular level. MIR (4 000 to 400 cm-1) assigned to the fundamental vibrations differs obviously from NIR (700~2 500 nm) assigned to the vibrations of the overtone or combination in the contour of their peaks. The MIR peaks usually are relatively sharp and the NIR ones vice versa. The clear difference in their peak contour will challenge applicability of model transfer method built based on one kind of spectra. Hence, the transfer method adapting both MIR and NIR spectra simultaneously is needed to develop.
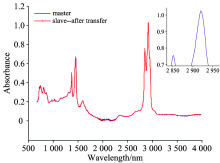
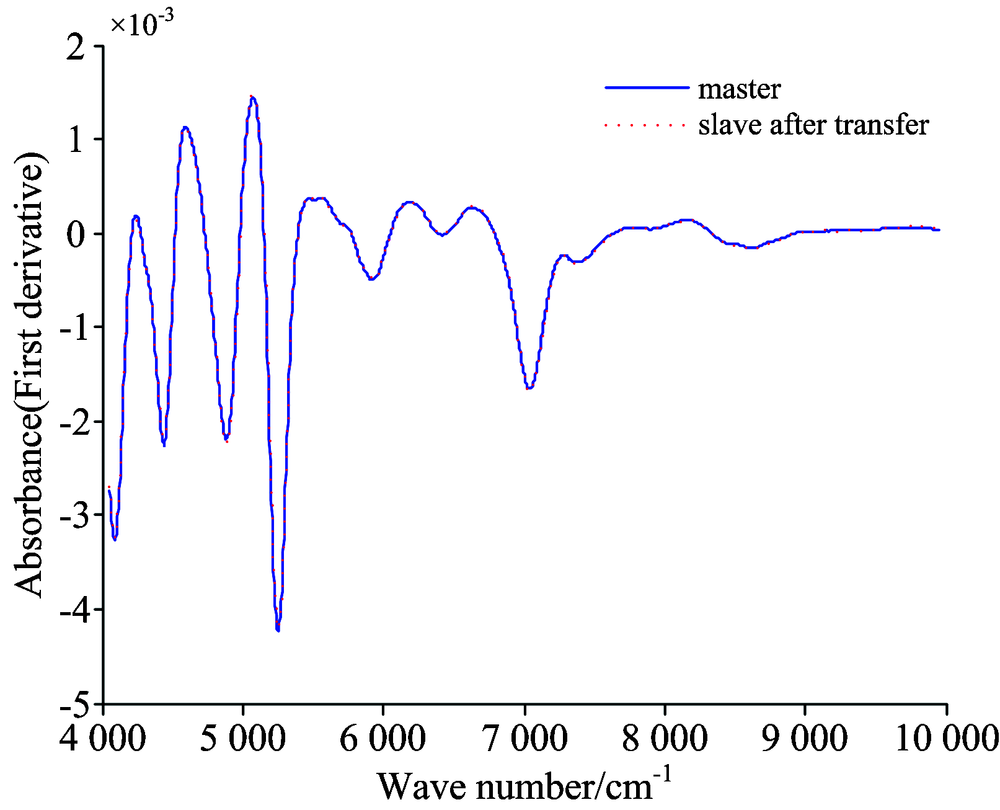
The process of model transfer in MIR is akin to transferring in NIR, anasphalt sample is random chosen for comparing the spectral similarity, the MIR spectra collected respectively from the master and slave spectrometer before and after corrected are shown in Fig.7 and Fig.8. It can be seen that the spectrumof slave spectrometer is corrected to match that of master spectrometer well, and the SA decreases from 0.121 7 to 0.028 9.
 | Fig.7 The MIR spectra of a sample measured on the master and slave spectrometer |
 | Fig.8 The MIR spectra of a sample measured on the master and slave spectrometer after corrected |
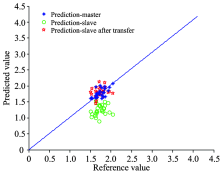
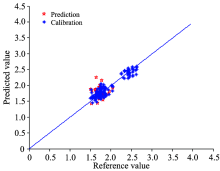
The calibration model built by master spectrometer was used to predict the content of wax in asphalt, as such, for comparison, the prediction results of the spectra of samples in validation set measured on master, slave spectrometer and transferred were all calculated. The reference versus predicted values for three kinds of spectra are shown in Fig.9, it can be seen that the green points above the straight line, showing the predicted concentration for the spectra of slave spectrometer most lower than reference value, the model is invalid for the salve spectrometer. However, the red points are tightly distributed on the both side of line and close to blue points. Itindicates that the predicted values of the transferred spectra are very close to the values of the original spectra, the calibration model is valid to the spectra after transferred by the SA-PDS method.
 | Fig.9 The predicted results of the spectra measured on master spectrometer and slave spectrometer before and after transfer (MIR) |
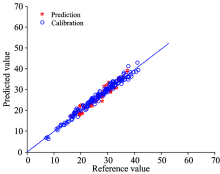
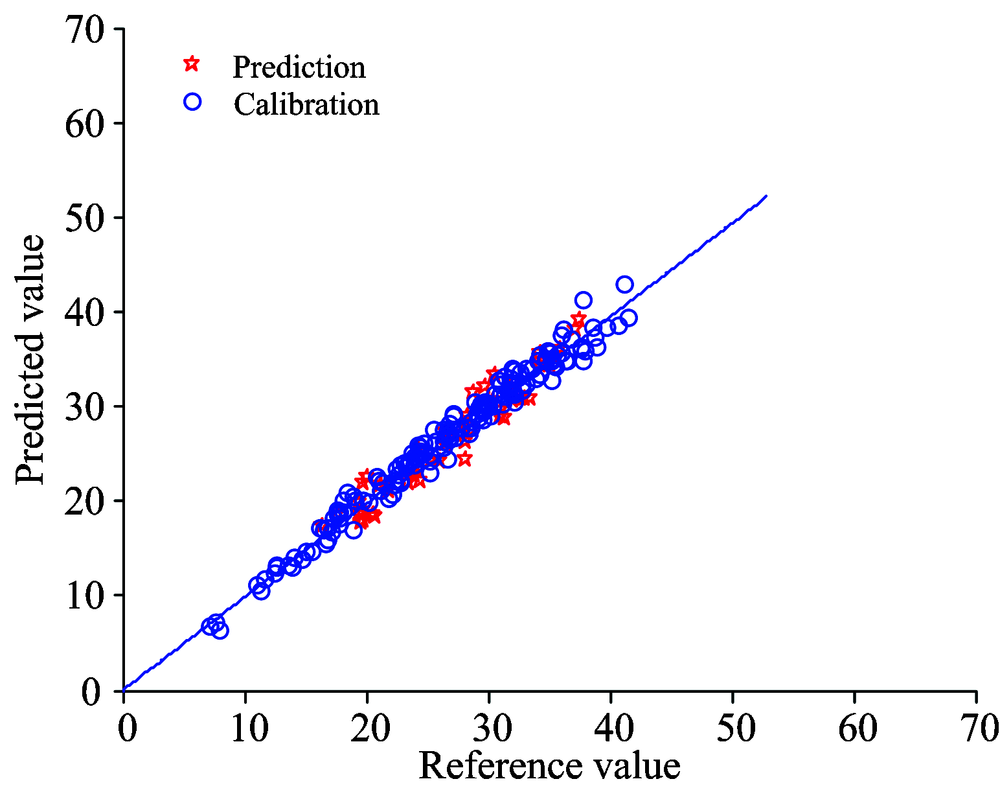
The new transfer method allows the spectra collected by themaster spectrometer transferred to the spectra as if they were measured on slave spectrometer. A new model applicable to the slave spectrometer can be established by the transferred spectra. Thus, the effect of the transfer method is demonstrated via the performance of the new model. In this work, the spectra of calibration samples measured on master spectrometer were all transferred by SA-PDS method, the process of transfer from master to slave spectrometer is similar to that from slave to master spectrometer, and the parameters of PDS are also shown in Table 1. The spectra of validation samples measured by slave spectrometer were used to test the performance of the model. For NIR spectra of tobacco, the new calibration model is built to predict the glycosides content in tobacco. The plot of reference versus predicted values of the calibration and prediction spectra isshown in Fig.10, the points also closely distributed on both sides of the line, indicating that the calibration model is valid and performance well. For MIR spectra of asphalt, the new calibration model of wax content is established by transferred spectra, the prediction results for calibration and validation spectra via this new model are presented in Fig.11.The distribution of the points indicates there are no significant differences between the reference and the prediction values. Thus, the calibration model developed by the transferred spectra can be successfully applied to the slave spectrometer. Therefore, the SA-PDS method led to successful model transfer from master to slave spectrometer.
 | Fig.10 Results of the model built by transferred spectra for calibration and prediction (NIR) |
 | Fig.11 Results of the model built by transferred spectra for calibration and prediction (MIR) |
In the absence of sufficient spectra of salve spectrometer to develop a model, the traditional PDS method cannot correct the spectra of master spectrometer to match the spectra of slave spectrometer accurately. In the proposed SA-PDS method, the angle between spectra was proposed as the criterion to optimize the parameters of PDS, no need of reference data and model. Thus, for comparison, the transfer results from slave to master spectrometer of PDS method that using RMSEP as the criterion to choose parameters in the process of model transfer are also calculated. The prediction accuracy (RMSEP, Bias) of RMSEP-PDS method and SA-PDS method using NIR andMIR data are calculated and presented in Table 2 and Table 3, respectively, they indicate that the SA-PDS method achieve the better results whether for the transfer of near infrared or infrared.
| Table 2 Results of different model transfer methods (NIR) |
| Table 3 Results of different model transfer methods (MIR) |
In this work, an improved modeltransfer method (SA-PDS) was developed for molecular spectral multivariate analysis, in which the angles between spectra were used as the criterion to choose optimal parameters of PDS. Because of without using reference data during the process of model transfer, SA-PDSnot only reduces the cost of model transfer obviously, but also can avoid adverse effect from errors in reference data. Whether for mid-infrared spectroscopy or near infrared spectroscopy, even though a few of the samples are used during the transfer process, the performance of SA-PDS method all behaved superior to that of traditional PDS.
SA-PDS also could make model transfer easily for both directions. One is to correct the spectra measured by slave spectrometer and keep original model of master unchanged, the results of this paper show that the calibration model can be effective in the spectra corrected by the new method. The other way is to transfer the spectra of the master spectrometer to match the spectra as if they were measured on slave spectrometer, and a new model could be developed by the transferred spectra.
In addition, this work has supported the maintenance and reconstruction of models successfully in practice.
The authors would like to thank associate professor. Song Chunfeng for assistance with the experiments and Mr. Wang Jiajun for assistance with sample collection.
The authors have declared that no competing interests exist.
| [1] |
|
| [2] |
|
| [3] |
|
| [4] |
|
| [5] |
|
| [6] |
|
| [7] |
|
| [8] |
|
| [9] |
|
| [10] |
|
| [11] |
|
| [12] |
|
| [13] |
|
| [14] |
|
| [15] |
|
| [16] |
|
| [17] |
|
| [18] |
|