


基于太赫兹光谱-统计分析的大气PM2.5监测研究
[姜晨1 , 詹洪磊1, *  , 李倩
, 李倩1 , 赵昆1, * , 张振伟2 , 张存林2 ]
, 李倩, 张振伟|
|


应用太赫兹技术对大气中动力学直径小于2.5 μm(PM2.5)的细颗粒物进行了定量研究。 PM2.5质量和太赫兹吸光度之间存在线性关系, 相关系数为0.86。 应用主成分分析的方法, 可证明随着PM2.5质量的增加, 与吸收系数存在相似的趋势。 为了提高预测精度, 采用偏最小二乘, 支持向量机和反向传播人工神经网络对PM2.5进行定量研究。 与单一的线性模型相比, 统计模型具有较大的预测相关性和较小的误差。 对于神经网络模型, 训练集与预测集的相关系数和均方根误差分别达到0.999和0.016 mg, 0.912和0.207 mg。 因此, THz技术和统计学方法的结合可提供较高精度的预测, 作为一种监测PM2.5的有效手段。
The study presented a quantitative investigation in monitoring the fine particulate matter with the aerodynamic diameters less than 2.5 μm (PM2.5) in air with terahertz (THz) technique. Absorption bands were observed and linear relations were obtained between PM2.5 mass and absorbance at selected frequencies with correlation coefficients R of ~0.86. The utilization of principal component analysis (PCA) proved the similar absorption trend in the entire range with increasing PM2.5 mass. In order to improve the prediction precision, we employed other three statistical methods including partial least square (PLS), support vector machine (SVM) and back propagation artificial neural network (BPANN) for the quantification of PM2.5. Compared with single linear models, statistical models had larger prediction correlation and smaller errors. For BPANN model, R and root-mean square error (RMSE) achieved 0.999 as well as 0.016 mg in training and 0.912 as well as 0.207 mg. Therefore, the combination of THz technique and statistical methods represents high precision of prediction and really can act as an effective tool to monitor PM2.5 together with other normal approaches.
Introduction
Air pollution has gradually been a great trouble and widely-concerned topic for the public in China since 21th century due to the rapid economic development, industrial expansion and urbanization. Fine particulate matter with aerodynamic diameters less than 2.5 μ m (PM2.5), which is the primary form of air pollution, has been found to adversely impact human health, visibility and climate change. Air pollution is a blight on people’ s quality of life and a trouble that weighs on their hearts[1, 2, 3, 4, 5]. To address these impacts, pollution control and environmental protection are necessary. The Chinese State Council released the “ Atmospheric Pollution Prevention and Control Action Plan (APPCAP)” in September 2013. This project was employed to reduce PM2.5 emissions by up to 25% by 2017 relative to the 2012 levels and was backed by 1 750 billion RMB in investments from the central government[6, 7].
In order to achieving this ambitious goal, effective approaches for monitoring and abatement were required. In terms of PM2.5 monitoring, it is a significant reference for environmental departments and directly related to people’ s daily life in out-door activity. Generally, approaches which can be employed to monitor PM2.5 include weighing, tapered element oscillating microbalance (TEOM) and beta-attenuation approach[8]. They have special advantages, but are still not enough to satisfy PM5.2 detection due to the high complexity of air pollution. Optical methods like laser light scattering (LLS) were also used for PM2.5 monitoring due to the on-line characteristics. Terahertz (THz) spectroscopy technology has been attractive in biomedicine, materials, safety and petroleum with the characteristics of non-contact and rea-time detection[9, 10, 11, 12, 13]. In a previous report, we investigated the PM2.5 collected in a construction site by THz radiation. Absorption bands were found in THz range and the absorbance of features had a linear relation with PM2.5 mass[14].
Quantitative analysis with THz wave can be found in some studies, where linear fitting method was mostly used according to the Lambert-Beer’ s law based on one frequency or several selected frequencies. Statistical methods were developed for THz spectra treatment by using full-spectra analysis. The results of statistical analysis reflected the absorption effect over the entire range and the statistical quantification can often improve the prediction accuracy[15, 16, 17]. In this research, we initially measured the THz absorption spectra and built linear models of a series of PM2.5 in air. Statistical methods including partial least square (PLS), support vector machine (SVM) and back propagation artificial neural network (BPANN) were then employed for the quantification of PM2.5 mass. The prediction improvement of PM2.5 by statistical methods utilization indicated that the combination of THz technique and statistical methods was an effective tool to monitor PM2.5 in air.
In order to collect the actual PM samples for THz measurement in air, a standard air sampler (Minivol Tactical Air Sampler) was employed. In the process of PM collection, the air would pass through a 10-μ m cut-off and a 2.5-μ m cut-off successively, and then the PM2.5 were collected on a quartz filter membrane, which had a diameter of 47 mm). A total of 28 PM2.5 were collected in air. The collection of PM2.5 was finished in the campus of China University of Petroleum, Beijing, China, from March 25 to June 5, 2014. THz spectra of PM2.5 were obtained by using a Bruker Fourier-transform infrared (FTIR) spectrometer. Co-adding 64 scans at a resolution of 4 cm-1 with strong apodization were set in the measurement process. Silicon carbide was the optical source, emitting steady emissions with continuous wavelengths in THz range. A Michelson interferometer was used to obtain interference pulses, which would then focus on the sample location. Finally, the spectral data of PM2.5 would be collected by the detector and recorded in computer.
All the blank filters were weighed before collecting and the reweighed after PM2.5 were collected. The flow rate of air equaled 7 L· min-1. Thus, the PM2.5 concentration ρ was obtained by using the expression ρ =mN-1t-1, where m, N and t were the mass of PM2.5, flow rate and sampling time, respectively. In terms of THz spectra, the filters without and with PM2.5 were employed as reference and samples. The spectra were recorded as frequency-domain spectra (FDS) in computer. The frequency dependence of absorbance (A) spectra can be obtained by log(Eref./Esam.), where Eref. and Esam. were the amplitudes of the reference and sample in FDSs which were obtained directly in FTIR measurement, respectively[18].
The quantitative monitoring of PM2.5 concentration is a continuously wide-concerned topic to not only ordinary citizens, but also the environmental departments. Initially, we performed a basic characterization of the transmitted THz absorption parameters of a series of PM2.5 based on the FTIR measurement. An FTIR spectrometer had a higher signal-to-noise ratio (SNR) in high frequency range. Herein the SNRs were not rather high in the 1~3 THz range and 8~10 THz range. Thus the frequency between 3~8 THz was selected for the analysis in this research. The inset of Fig.1 shows the frequency dependent amplitude spectra of filter without (Ref.) and with (Sam.) PM2.5 in the frequency range from 3 to 8 THz. It is observed that the amplitude of sample is smaller than that of reference over the entire range, proving the absorption effect of PM2.5 to THz radiation. Thus, it can be concluded that molecular vibration modes of PM2.5 components have corresponding characteristics in THz range, which is the basis for THz wave to be employed to monitor PM2.5 in air.
 | Fig.1 Frequency dependent absorbance spectra of PM2.5 in the frequency range from 3 to 8 THz. PM2.5 mass vary from 0.50 to 2.50 mg. The absorbance spectra have an absorption band with a 6.6-THz central frequency. The inset represents the frequency-domain spectra (FDS) of reference (Ref.) and a PM2.5 (Sam.), which are used to obtain absorbance spectra |
According to the FDS, the frequency dependent absorbance spectra can be obtained by log(ERef./ESam.). Here, a Savitzky-Golay filter was used to pre-process the absorbance values. The filter would reduce the instrument noise and smooth curve, but not distort the spectral wave forms and absorption features. Fig.1 plots the smoothed frequency dependent values of absorbance of all the PM2.5 along it depth with the mass of 0.50~2.50 mg, from 3 to 8 THz. As a THz pulse propagates through an absorptive medium, such as PM2.5, the pulse width broadens due to the dispersion[19]. It is noted that there exists a broad absorption band whose central frequency is located at ~6.6 THz. In the range smaller and larger than 6.6 THz, the absorbance values gradually increase and decrease with increasing frequency for most PM2.5 collected in air, respectively. There are deviations among several PM2.5, whose absorbance increases in the whole range. This phenomenon may be caused by sudden change of pollution sources when the PM2.5 was collected. A strong absorption effect was observed, and the larger the PM2.5 mass was, the stronger the PM2.5 absorption showed.
For quantitatively monitoring PM2.5 in air with THz radiation, we extracted the absorbance values at several frequencies around 6.6 THz and related them to the respective mass, shown in Fig.2. The x- and y-axis represent PM2.5 mass and absorbance respectively. With the augment of mass absorbance basically increased at 6.0, 6.3, 6.6 and 7.0 THz. Based on the collected tendency, we fitted the linear models and calculated the correlation coefficient R between them. All the points were located at two sides of the fitted lines. In the four linear models at selected frequencies, Rs equaled 0.851, 0.858, 0.869 and 0.878. The results indicated that there existed quantitative relationship between THz absorbance and PM2.5 with high correlation.
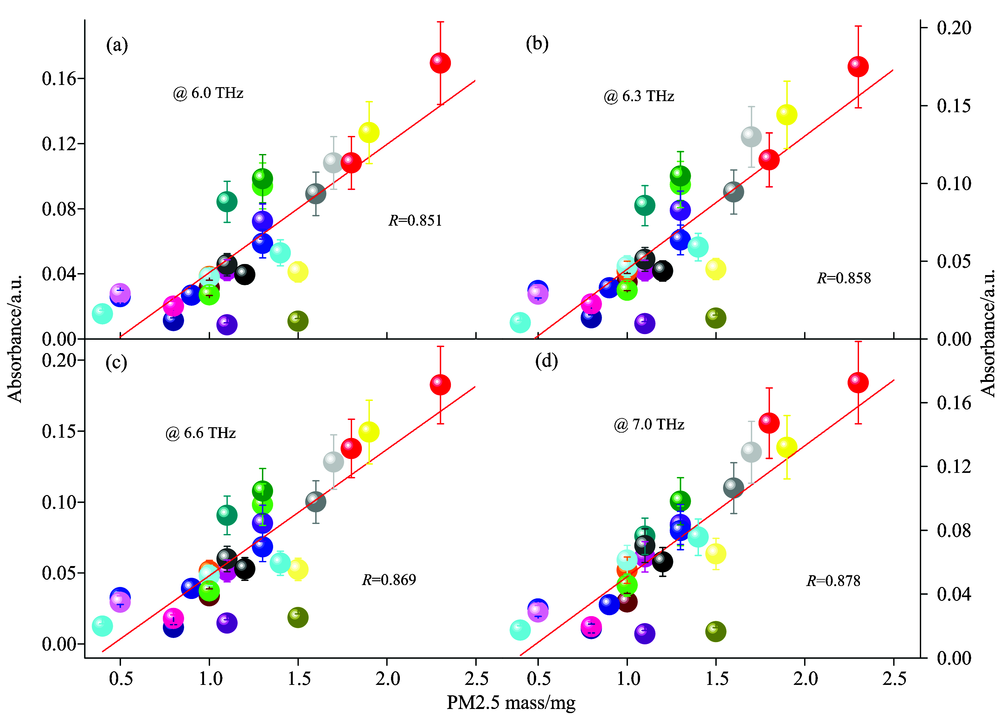 | Fig.2 Linear relations between PM2.5 mass and absorbance at four frequencies around the central frequency of 6.6 THz The selected frequencies were 6.0 (a), 6.3 (b), 6.6 (c) and 7.0 THz (d) |
For the extraction of full-spectrum information between PM2.5 concentration and THz absorption as no obvious and sharp absorption peaks are found in Fig.1, we employed PCA algorithm based absorbance spectra where the absorption effect of PM2.5 components over the whole frequency range were taken into account. PCA reduced the number of dimensions within the frequency-dependent data while retaining as much of the overall variations as possible based on uncorrelated projections. It can be used for both qualitative and quantitative analysis. The calculation of PCA results in several variables defined as principal components (PCs), which contained information of samples and spectral variables that were called as scores and loadings. The eigenvector corresponding to the maximum eigenvalue for PC 1 is the direction of the maximum variance distribution of absorbance spectra, so PC 1 has the highest contribution rate in all, followed by PC 2, PC 3 and so on[10].
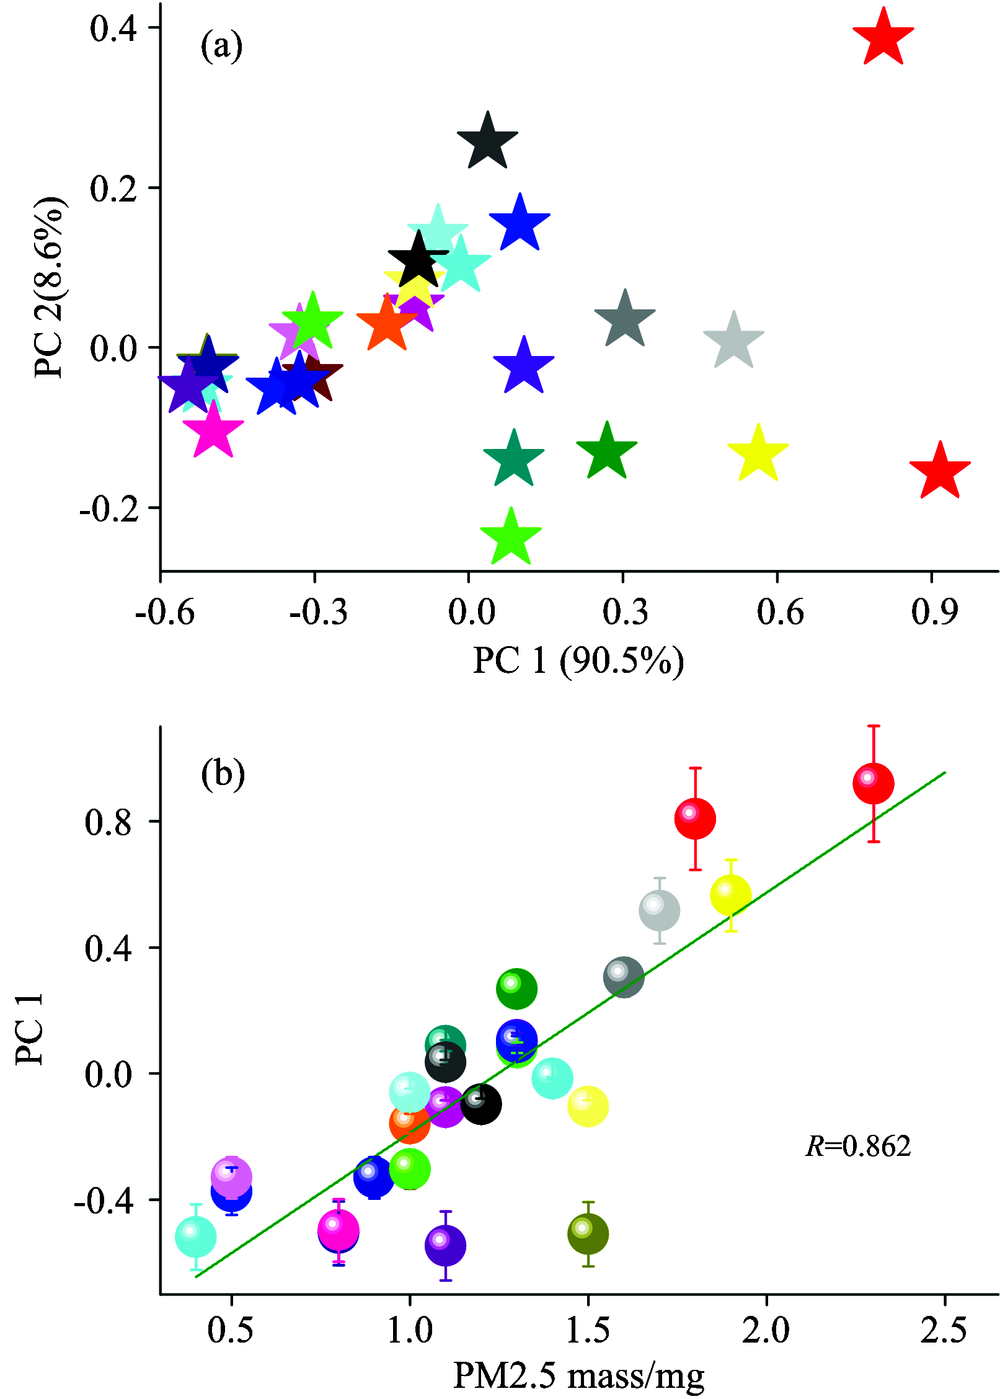 | Fig.3 Principal component analysis (PCA) model of PM2.5 based on the absorbance spectra over the entire frequency range (a): PC 1 versus PC 2 of all PM2.5 with the contribution rate of 90.5% and 8.6%, respectively; (b): PM2.5 mass dependent PC 1 score extracted from (a) and the linear model between mass and PC 1 |
According to the PCA calculation results, PC 1 and PC 2 are found to describe 90.5% and 8.6% of the variance within the absorbance data, with the total contribution rate of 99.1% in all deviations. Thus, a two-dimensional score system containing PC 1 as well as PC 2 were built and plotted in Fig.3(a). The points in the system represent PC 1 and PC 2 scores of respective PM2.5 based on absorbance over the entire range. In order to discuss the quantitative relationship of PCs and PM2.5, only PC1 was extracted and related to PM2.5 because of its largest contribution rate (90.5%). Fig.3(b) shows PM2.5 mass dependence of PC 1 score, which reflect the most information of absorption effect in the entire range. With the augment of PM2.5 mass, PC 1 scores increase basically, validating the absorption regulation of PM2.5 in Fig.1. Based on the collected trend, a linear model can be built between PC 1 and PM2.5 mass. R of the model is found as 0.862, which is close to Rs at selected frequencies in Fig.2. Due to the multiple linear regression algorithm in PCA calculation, the results represent similar absorption trend over the entire range from 3 to 8 THz.
In order to monitor PM2.5 concentration more precisely for the public, the THz absorbance spectra should be further treated to improve the correlation and minimize the error. Linear models in Figs.2 and 3 depend on the Beer’ s law, which is, however, based on one frequency or one PC and is therefore, more fragile to environmental and instrumental noises. To build more robust and precise multiple models, chemometrics methods, including PLS, SVM and BPANN were employed respectively. PLS was one of the most used ways for quantitative analysis, which related two data matrices by a linear multivariate model. PLS has the advantage of analyzing strongly collinear and noisy data. The extracted features can eliminate the uncorrelated information and noise which have great influence in single linear models in the absorbance spectra. The underlying model with PLS is described as X=TPT+E and y=Tq+f, where X and y are the input and output data, T is the matrix of the extracted features, P and q are the loading matrices, and E as well as f are the relative error terms[20, 21]. SVM is a computing learning algorithm and has been applied in regression analysis, classification, forecasting and pattern recognition. SVM depends on structural risk minimization and statistical machine learning process. The algorithm will generate as a sparse prediction function which needs a selected number of training points called support vectors. In the SVM calculation, the equations are based on the theory of Vanik. The SVM estimates the function as f(x)=ω ϕ (x)+b, where ϕ (x) is the high-dimensional space feature, and ω as well as b are a normal vector and the bias term[22, 23]. BPANN is a mathematical nonlinear dynamics system simulating structure and function of biological neural networks in the human brain. No priori model was required for ANN even when noise was present. Based on searching an error surface using gradient descent for point with minimum error, BP learning algorithm can store a lot of input-output mapping relationships without prior revealing the mathematical equation. Generally, BPANN includes input, hidden and output layers[24, 25].
All the samples were divided into two subsets: the calibration or training set and validation or prediction set. The calibration or training set was used for calculating an analytical model and the validation or prediction set for testing and verify the accuracy of the model. Here, in order to identify all the subsequently given spectra correctly in prediction set, the number of calibration or training set should exceed that of validation or prediction set in PLS, SVM and BPANN calculation. To evaluate the reliability and precision of the model, the correlation coefficient R and root-mean square error (RMSE) were calculated. R is related to the covariance cov(x, y) and variance matrix v(x) by R=cov(x, y)/(v(x)v(y))1/2, and RMSE can be calculated by
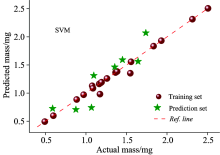
Figs. 4— 6 show the predicted PM2.5 mass versus actual PM2.5 mass in PLS, SVM and BPANN, respectively, with the absorbance spectra in Fig.1 over the entire range from 3 to 8 THz as the input. Eight groups of PM2.5 are randomly selected as the validation or prediction set and the left twenty PM2.5 as the calibration or training set. In the two-dimensional systems of PLS, SVM and BPANN, all the points are located near the reference (Ref.) lines, which represent zero residuals between the predicted and actual PM2.5 mass. Thus, the predicted values are close to the actual data in the quantitative models. In order to precisely evaluate the models, we calculated R and RMSE of calibration or training and validation or prediction set, which were listed in Table 1. According to the values in Table 1, we can find that Rs of calibration and prediction sets exceed 0.93 and 0.89, and RMSEs are less than 0.23 and 0.37, respectively. Further comparing the results of three methods, it can be concluded that BPANN method shows lowest prediction error of 0.207 mg and presents the highest correlation, indicating that it has the best antinoise ability among the three methods in this PM2.5 monitoring system. SVM also presents a high correlation and a low prediction error similar to BPANN. PLS showed a relatively lower precision compared with BPANN and SVM, but still had a high correlation and a low error. Therefore, the results in Figs.4— 6 and Table 1 proved that the combination of THz spectroscopy and statistical methods can really improve the precision and be used to monitor PM2.5 in air.
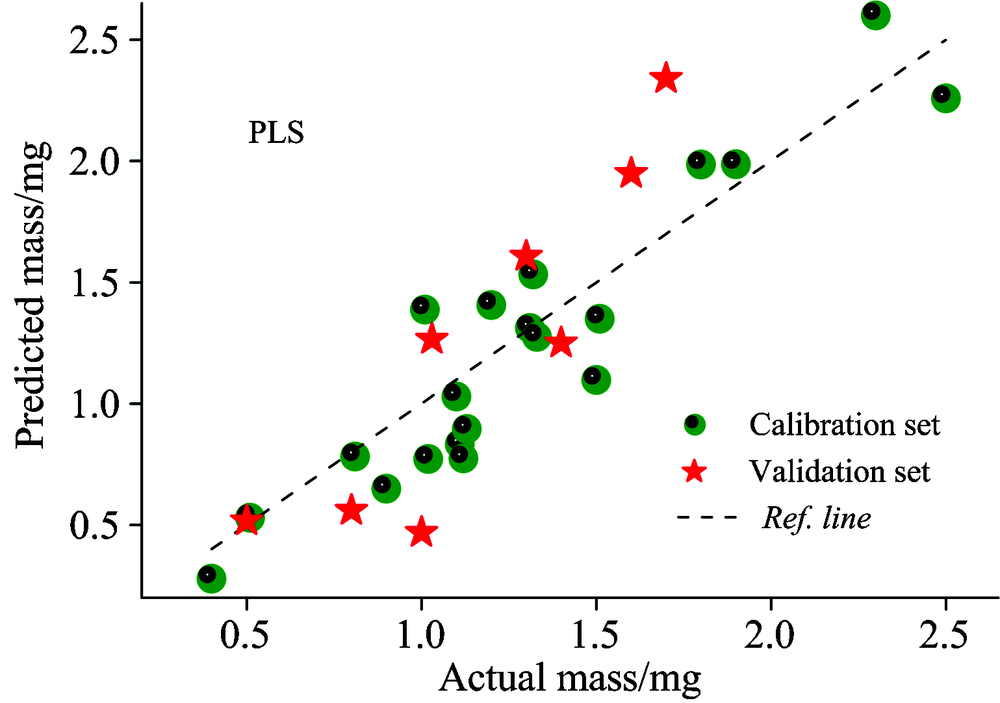 | Fig.4 Actual versus predicted mass of PM2.5 in PLS model with the absorbance spectra over the entire frequency range as the input |
 | Fig.5 Actual versus predicted mass of PM2.5 in SVM model |
 | Fig.6 Actual versus predicted mass of PM2.5 in BPANN model |
| Table 1 Relative errors R and RMSE of both calibration or training and validation or prediction set in PLS, SVM and BPANN models |
This research performed an investigation for THz spectroscopy to quantitatively monitor PM2.5 in air. To determine PM2.5 concentration or mass, a linear model was initially built between PM2.5 mass and absorbance values at selected frequencies. The measurement accuracy was closely related to the model performance. The uncertainties of PM2.5 prediction depended on instrumental and background noises, even the variation of the reference spectra due to changes in system performance to some extent. Such uncertainties or noises cannot be avoided actually in single linear models, which was the most used method in quantitative analysis. In terms of the sample whose absorption was much strong in THz range, single linear model can be a good selection for quantitative analysis because the sample spectrum was not sensitive to the instrumental noises. For most samples such as PM2.5, it was quite worth investigating more data analysis methods to realize more accurate PM2.5 monitoring. The statistical algorithm was an effective selection according to this research. Statistical analysis has been applied in other fields such as agriculture. Our results together relative researches about quantitative analysis indicated that the general noise effect in the spectral data can be reduced or eliminated in the statistical analysis based on full-range-spectra calculation[10, 14, 15, 26]. In terms of PM2.5, its monitoring has been attracted broad attention in many countries. Utilizing THz spectroscopy combined with chemometrics method is useful for environmental departments. In the further study, the selection of statistical methods and parameters in calculation should be considered by selecting a larger number of PM2.5 samples.
In conclusion, we have shown that THz radiation was capable of monitoring PM2.5 in air quantitatively. Linear models between absorbance and PM2.5 were initially discussed. PCA proved the similar augment tendency of absorbance with the increasing PM2.5 mass. In addition, we found that the use of statistical methods including PLS, SVM and BPANN can improve the prediction accuracy of PM2.5 based on the full-range-spectra analysis. Especially for BPANN and SVM, they had larger correlation and lower prediction error. Therefore, the research would be a further step for THz technique to become a valuable tool for the rapid and precise monitoring and gradually be as a normal way to monitor environmental pollution.
The authors have declared that no competing interests exist.
| [1] |
|
| [2] |
|
| [3] |
|
| [4] |
|
| [5] |
|
| [6] |
|
| [7] |
|
| [8] |
|
| [9] |
|
| [10] |
|
| [11] |
|
| [12] |
|
| [13] |
|
| [14] |
|
| [15] |
|
| [16] |
|
| [17] |
|
| [18] |
|
| [19] |
|
| [20] |
|
| [21] |
|
| [22] |
|
| [23] |
|
| [24] |
|
| [25] |
|
| [26] |
|