


马铃薯多品质参数可见/近红外光谱无损快速检测
[王凡1  , 李永玉
, 李永玉1, * , 彭彦昆1 , 杨炳南2 , 李龙1 , 刘亚超1 ]
, 李永玉, 彭彦昆|
|


作者简介: 王 凡, 1992年生, 中国农业大学工学院博士研究生 e-mail: wangfan0313@126.com
马铃薯是与小麦、 稻米、 玉米协调发展的第四大主粮作物, 现阶段我国正积极推进马铃薯主食开发, 但马铃薯品质的参差不齐严重制约了马铃薯产业主食化进程, 马铃薯品质快速无损检测对其加工产业化进程有着重要意义。 国内外学者基于可见/近红外光谱对马铃薯内部品质检测进行了不少相关研究, 但迄今为止大部分研究都基于可见/近红外漫反射原理, 马铃薯粗糙的表皮对样品漫反射光谱影响较大。 近红外透射光谱能较好的反映样品的品质信息, 但马铃薯样品全透射光谱因样品大小不同, 导致光谱受光程差异的影响较大。 考虑到马铃薯样品整体质地较为均匀, 根据马铃薯的形状特性搭建了马铃薯局部透射光谱采集系统, 局部透射检测方式既能避免马铃薯表皮的影响, 又能在保证光程统一的情况下获得样品内部的信息。 该光谱采集系统由光谱采集单元(光谱仪、 耦合透镜)与光源单元(卤素灯、 灯杯)构成。 进行光谱采集时, 将二者贴紧马铃薯表面以确保光谱采集单元不会接收到来自马铃薯表面的反射光。 用该系统采集了120个马铃薯650~1 100 nm范围的局部透射光谱, 分别进行去趋势(detrend)、 多元散射校正(muliplication scattering correction, MSC)、 标准正态变量变换(standard normal variable transformation, SNV)和一阶导数(first Derivative, FD)预处理, 并建立了马铃薯干物质、 淀粉、 还原糖含量的偏最小二乘预测模型(partial least squares regression, PLSR)。 结果显示, 采用多元散射校正预处理的干物质和淀粉含量预测模型效果较好, 其验证集决定系数分别为0.854 0和0.851 0, 验证集均方根误差分别为0.521 9%和0.484 8%; 采用一阶导数预处理的还原糖预测模型效果最好, 其验证集决定系数为0.768 6, 均方根误差为0.025 1%。 为进一步优化模型采用竞争性自适应重加权采样(competitive adaptive reweighted sampling, CARS)等三种方法进行特征波长的筛选, 并建立了偏最小二乘预测模型。 结果显示, 马铃薯各品质参数的预测效果均得到了较大提升, CARS筛选波长后的干物质、 淀粉、 还原糖预测模型的验证集决定系数分别为0.877 6, 0.865 3和0.887 7, 验证集均方根误差分别为0.449 2%, 0.930 2%和0.016 7%。 采用CARS特征波长提取能够简化模型, 去除无关变量和共线性变量, 从而提高模型的精度和稳定性, 尤其是对低含量组分还原糖的预测模型效果显著。 最后, 为验证马铃薯各品质参数预测模型的精度及稳定性, 选取30个不同批次马铃薯样品对所建预测模型进行了外部验证。 马铃薯干物质、 淀粉、 还原糖含量的模型预测值与标准理化值决定系数分别为0.849 9, 0.867 1, 0.877 6, 均方根误差分别为0.660 9, 0.480 9, 0.016 9, 平均相对误差分别为2.03%, 1.77%, 7.58%。 研究表明, 局部透射光谱携带了马铃薯的内部信息, 与干物质、 淀粉、 还原糖含量有显著相关性。 该可见/近红外局部透射检测系统可以实现马铃薯多品质参数的快速无损预测, 特别是干物质含量及淀粉含量的预测效果较好, 但是对个别还原糖含量非常低的样品出现预测相对误差较大现象, 下一步研究中需要进一步优化完善。
Potato is the fourth important grain crop coordinated with wheat, rice and corn. At present, China is actively promoting the development of potato staple foods, but the uneven quality of potatoes has seriously hampered the process of the main food industry of the potatoes. Therefore, rapid non-destructive testing of potato quality is of great significance to the industrialization of processing. Domestic and foreign scholars have conducted a number of related researches on the detection of potato internal quality based on the visible/near-infrared diffuse reflectance principle. This method is commonly used, but the rough skin of the potato has a great impact on the detection. Another detection method is the transmission spectrum. This method can better reflect the internal quality information of the sample. However, the total transmission spectrum of the potato varies with the size of the sample and results in a large change in spectral intensity. Considering the above two reasons and average quality of potato, this study uses partial transmission spectrum as the detection method. This method can not only avoid the influence of the potato epidermis, but also obtain the internal information of the sample while maintaining the same path length. The spectral acquisition system consists of spectral acquisition units (spectroscopes and coupling lenses) and light source units (halogen lamps and lamp cups) which are arranged side by side. During testing, the two parts are attached to the sample surface to ensure that the spectral acquisition unit does not receive reflected light from the potato surface. Based on this system, partial transmission spectra of 120 potatoes are collected ranging from 650 to 1 100 nm. The prediction model of dry matter, starch and reducing sugar content was established using partial least squares regression after pretreat by detrend, multivariate scattering correction (MSC), standard normal variable transformation (SNV) and first-order derivative (FD). The result shows that the prediction models of dry matter and starch content using multiple scatter correction pretreatment are effective. The determination coefficients of validation set are 0.854 0 and 0.851 0, respectively, and the root mean square errors are 0.521 9% and 0.484 8%, respectively. The reducing sugar prediction model using first-order derivative pretreatment has the best result. The determination coefficients of validation set is 0.768 6 and the root mean square error is 0.025 1%. In order to optimize the model, three methods such as competitive adaptive reweighted sampling (CARS) are used to filter the characteristic wavelengths, and an optimized partial least-square prediction model is established. The result shows that the prediction effect of potato quality parameters has been greatly improved. The determination coefficient of validation sets for dry matter, starch, and reducing sugar prediction models after CARS screening are 0.877 6, 0.865 3 and 0.887 7, respectively. And the root mean square errors of the validation set are 0.449 2%, 0.930 2% and 0.016 7%, respectively. The use of CARS feature wavelength extraction can simplify the model and remove irrelevant variables and collinearity variables. This will improve the accuracy and stability of the model, especially for low-component content parameters such as reducing sugars. Finally, in order to verify the robust of the potato quality parameters prediction model, 30 potato samples are selected for external validation of the prediction model. The determination coefficients between model predicted values and standard physicochemical values of potato dry matter, starch, and reducing sugar are 0.849 9, 0.867 1, and 0.877 6, respectively. The root mean square errors are 0.660 9, 0.480 9, and 0.016 9, respectively. The average relative errors are 2.03%, 1.77% and 7.58%, respectively. The present study shows that the partial transmission spectrum carries the internal information of the potato and it is significantly related to the contents of dry matter, starch, and reducing sugar. The visible/near-infrared partial transmission detection system can achieve rapid and non-destructive prediction of multi-parameters of potatoes, especially good prediction results of dry matter content and starch content, but there is a large relative error in the prediction of individual samples with very low levels of reducing sugars. The next step of the study needs further optimization and improvement.
马铃薯是一种营养丰富、 产量高、 适应性强的经济作物, 它的用途广泛, 产业链条长, 是农业生产中加工产品最丰富的原料作物。 同时, 马铃薯生长季节短, 效益高, 已成为我国种植业结构调整和农业增效、 农民增收的主要经济作物之一[1, 2]。 2015年7月李克强总理在国务院常务会议上提出“ 实施马铃薯等主食加工提升行动” , 积极推进马铃薯主食开发, 推动马铃薯成为与小麦、 稻米、 玉米协调发展的中国第四大主粮作物。 虽然近些年马铃薯种植面积和产量都有明显提高, 但马铃薯品质的参差不齐严重制约了马铃薯产业主食化进程[3, 4], 提高马铃薯质量检测对推进马铃薯产业发展有着重要意义。
可见/近红外技术是一种无损检测技术, 具有分析速度快、 无损伤、 费用低等优点。 近些年, 近红外光谱分析已经广泛应用于食品、 医药、 农业和工业检测等方面并取得了较大的进展, 成为果蔬品质快速无损检测的首选技术。 目前国内外学者基于可见/近红外光谱对马铃薯的干物质、 淀粉等含量进行了快速检测研究[5, 6, 7, 8, 9], 但迄今为止大部分研究都基于可见/近红外漫反射原理。 马铃薯粗糙的表皮对样品漫反射光谱影响较大[10], 为检测带来较大误差。 可见/近红外透射光谱能较好的反映样品的品质信息, 但马铃薯样品全透射光谱因样品大小不同受光程差异的影响较大[11, 12]。 考虑到马铃薯样品整体质地较为均匀, 本研究选择可见/近红外局部透射检测方式, 既能避免马铃薯表皮的影响, 又能在保证光程统一的情况下获得样品内部的信息。 虽然王加华等[13, 14, 15]使用类似方法对果蔬进行了无损检测研究, 但其检测系统要求被测物外形较为规则(如橙子等), 不适用于马铃薯。
本研究基于可见/近红外局部透射原理, 根据马铃薯的形状特性搭建了马铃薯局部透射光谱采集系统, 并针对大西洋品种马铃薯的干物质、 淀粉、 还原糖含量进行了快速、 无损检测研究, 为推进马铃薯产业发展提供技术支撑。
大西洋品种马铃薯样品由中国农业科学院花卉蔬菜研究所(北京)提供。 采摘后送往实验室储藏于4 ℃的冰箱中。 第一批马铃薯样品共120个, 以3∶ 1的比例分为校正集和验证集, 用于建立马铃薯干物质、 淀粉、 还原糖含量预测模型。 第二批马铃薯样品共30个, 用于马铃薯内部品质预测模型的外部验证。 采集光谱前将马铃薯块茎洗净并置于室温中贮藏一天(温度20 ℃、 湿度60%), 消除温度对实验的影响。
当近红外辐射照射到样品表面时, 一部分辐射发生反射, 一部分辐射透过样品从另一侧出射, 而另一部分辐射被样品散射并返回到表面。 本研究采用局部透射检测方式, 使光谱采集单元(光谱仪、 耦合透镜)与光源单元(卤素灯、 灯杯)并排设置, 卤素灯发出的辐射通过灯杯的反射、 汇聚进入马铃薯, 经过马铃薯内部的吸收散射后返回样品表面, 这些携带内部品质信息的光信号由耦合透镜收集并最终传输给光谱仪。 马铃薯局部透射近红外光谱检测系统示意图如图1所示, 由于探头与马铃薯表皮接触面积较小(1.1 cm× 2.0 cm), 而马铃薯虽然外型不规则, 但总体曲率较小, 因此该设计可以尽量避免由于马铃薯表皮曲率对检测带来的误差。
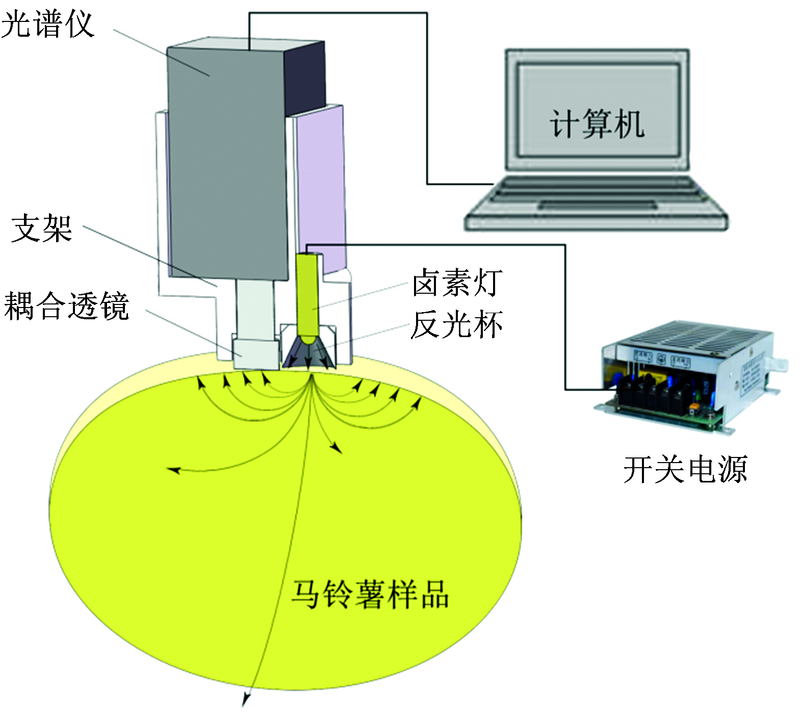 | 图1 马铃薯局部透射近红外光谱检测系统示意图采集光谱时, 将光谱仪与卤素灯预热20 min, 先对光谱仪进行黑白参考的校正, 设置积分时间为180 ms, 平均次数5次, 每个马铃薯样本采集四条透射光谱曲线(T%), 并对平均光谱进行吸光度变换。Fig.1 A schematic diagram of potato partial transmission near infrared spectroscopy detection system |
式中, A为马铃薯样品的吸光度, T为马铃薯样品的漫透过率(%), I为马铃薯样品的漫透过光谱强度(cd), D为暗光谱强度(cd), R为白参考光谱强度(cd)。
马铃薯样品光谱采集完成后, 立即将马铃薯去皮, 使用组织捣碎机对可食用部分进行粉碎, 然后分别使用GB 8858— 88(水分烘干法)、 碘还原法[16]、 NY/T 2742— 2015(3, 5-二硝基水杨酸比色法)测量马铃薯的干物质、 淀粉、 还原糖含量。 每个样品测量三组平行, 并以平均值作为近红外分析的标准理化值。
在建立模型过程中, 校正集和验证集的划分常用方法有随机法(random stone, RS), Kennard-Stone(KS)法[17]、 sample set partitioning based on joint x-y Distances(SPXY)法[18]等, 与前两者相比, SPXY算法综合考虑光谱值和化学值对数据进行划分, 因此该方法划分出的训练集更具有代表性, 泛化能力更强。 利用SPXY算法按照3∶ 1的比例将120个样品分为校正集和验证集, 各品质参数的标准理化值如表1所示。
| 表1 校正集和验证集中各品质参考值 Table 1 Reference measurements of quality attributes in calibration and verification sets |
采集的马铃薯局部透过率光谱曲线及吸光度光谱曲线如图2(a)和(b)所示。 马铃薯样品吸光度光谱曲线先用Savitzky-Golay滤波器(窗口大小: 5)进行平滑, 去除高频噪声。 因原始光谱曲线中包含样本信息和随机噪声、 背景噪声等干扰, 为提高光谱与待测组分的相关性, 分别使用去趋势、 标准正态变量变换、 多元散射校正、 一阶导数等方法对光谱进行预处理, 其中MSC预处理和一阶导数预处理后的光谱曲线如图2(c)和(d)所示。 预处理后的光谱曲线分别对马铃薯的干物质、 淀粉、 还原糖含量进行了偏最小二乘(partial least squares regression, PLSR)[19, 20, 21]建模分析, 结果如表2所示。
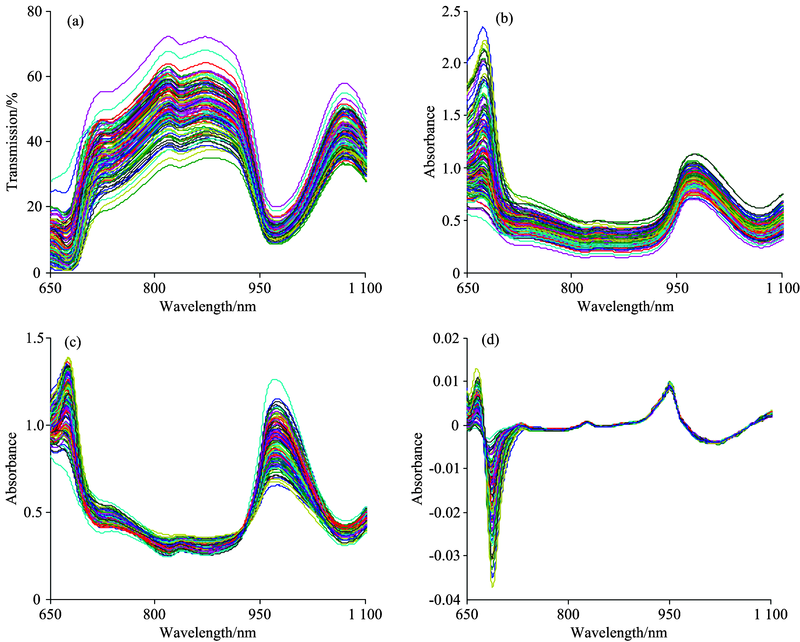 | 图2 马铃薯原始平均光谱曲线及预处理后的光谱曲线图 (a): 透过率光谱; (b): 吸光度光谱; (c): MSC预处理; (d): 一阶导数预处理Fig.2 The original average spectral curve of potato and the spectra after pretreatment (a): Transmittance; (b): Absorbance; (c): MSC pretreatment; (d): First derivative |
| 表2 马铃薯内部品质建模结果 Table 2 The modeling results of Potato internal quality |
结果显示, 使用不同的预处理后, PLS模型的精度和稳定性都有一定提升。 其中, 采用MSC预处理的干物质预测模型效果较好, 其校正集和验证集决定系数分别为0.859 9和0.854 0, 均方根误差分别为0.472 7%和0.521 9%。 同样, 采用MSC预处理的淀粉含量预测模型效果最好, 这可能是由于淀粉含量和干物质含量之间的高相关性所致, MSC处理后的校正集和验证集决定系数分别为0. 874 0和0.851 0, 校正集和验证集均方根误差分别为0.469 9%和0.484 8%。
虽然马铃薯的干物质和淀粉是重要的品质参数, 但还原糖往往更大程度地限制马铃薯的可加工性[22, 23]。 由于马铃薯中还原糖含量较少, 因此相比干物质和淀粉预测模型, 还原糖含量预测模型的精度较低, 一阶导数预处理后的还原糖预测模型校正集和验证集决定系数分别为0.806 0和0.768 6, 校正集和验证集均方根误差分别为0.024 4%和0.025 1%
可见/近红外光谱主要是由有机分子中的含氢官能团的倍频和合频吸收峰组成, 这些吸收峰强度较低、 灵敏性较弱、 吸收带较宽、 重叠严重, 因此使用全波段建模时, 会引入大量无关变量和共线性变量[24, 25, 26]。 为了简化模型, 提高模型的精度, 在预处理的基础上, 选择采用竞争性自适应重加权(competitive adaptive reweighted sampling, CARS)[27]、 连续投影算法(successive projections algorithm, SPA)[28]、 无信息变量消除法(uninformative variable elimination, UVE)[29]三种方法进行特征波长的筛选。 为了避免模型的过拟合, 波长筛选后建模的性能及因子数的选择由验证集均方根误差评定。 随着主因子数的增加, 验证集均方根误差呈现先下降后上升的趋势, 一般认为该转折点为最优主因子数, 大于该点的主因子数有过拟合的可能。
在不同主因子数下的三种波长筛选方法均方根误差如图3所示。 在马铃薯干物质、 淀粉、 还原糖的模型优化中, CARS筛选波长后建立的模型比其他两种方法有更好的预测精度。 这可能是由于此算法引入指数衰减函数来控制变量保留率, 并从去除权重低点和保留最小误差点两方面进行波长选择[30], 因此较适合近红外光谱的变量优选。 CARS筛选波长后的马铃薯各品质参数预测模型结果如表3所示。 结果显示, 马铃薯各品质参数的预测效果均得到了较大提升, 尤其是马铃薯还原糖含量预测效果有显著提升, 其校正集和验证集决定系数分别为0.894 2和0.887 7, 均方根误差分别为0.016 5%和0.016 7%, 这说明特征波长的筛选能有效的去除无关变量和共线性变量, 提高光谱与待测组分间的相关性。
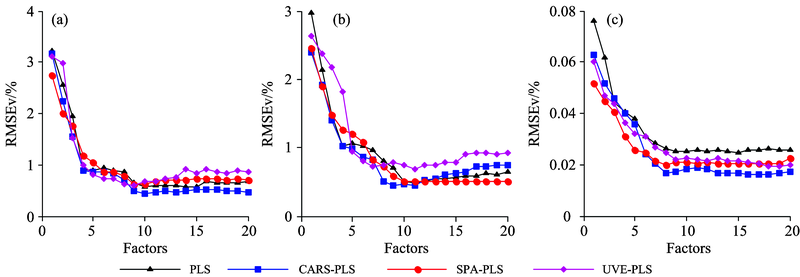 | 图3 还原糖含量预测模型的不同变量选择方法RMSECV变化 (a): 干物质; (b): 淀粉; (c): 还原糖Fig.3 Variation of RMSECV with different components by different variable selection methods (a): Dry matter; (b): Starch; (c): Reducing sugar |
| 表3 CARS特征波长建模结果 Table 3 CARS characteristic wavelength modeling results |
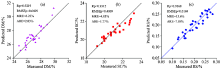
为验证马铃薯多品质参数预测模型的精度及稳定性, 利用所建立的模型预测了与建模样品无关的30个马铃薯样品的干物质、 淀粉、 还原糖含量。 同时利用标准方法测定了马铃薯样品的干物质、 淀粉、 还原糖标准理化值, 并与模型预测值进行了比较分析。
如图4所示, 马铃薯样品干物质、 淀粉、 还原糖含量的模型预测值与标准理化值决定系数分别为0.849 9, 0.867 1和0.877 6, 均方根误差分别为0.660 9, 0.480 9和0.016 9, 最大相对误差(maximum relative error, MRA)分别为6.22%, 4.83%和13.6%, 平均相对误差(average relative error, ARE)分别为2.03%, 1.77%和7.58%。 基于马铃薯局部透射光谱可以实现马铃薯多品质参数的快速无损预测, 特别是干物质含量及淀粉含量的预测效果较好, 但是个别还原糖含量较低的样品出现预测相对误差较大现象(达到13.6%), 下一步研究中需要进一步优化完善。
 | 图4 马铃薯外部验证模型效果 (a): 干物质; (b): 淀粉; (c): 还原糖Fig.4 The result of potato external prediction model (a): Dry matter; (b): Starch; (c): Reducing sugar |
基于可见/近红外局部透射原理, 根据马铃薯的形状特性搭建了马铃薯局部透射光谱采集系统, 并对马铃薯干物质、 淀粉、 还原糖含量进行了快速检测。 结果表明, 马铃薯局部透射光谱携带了马铃薯的内部信息, 与干物质、 淀粉、 还原糖有显著相关性, 其验证集决定系数分别为0.854 0, 0.867 1和0.768 6, 验证集均方根误差分别为0.521 9%, 0.484 8%和0.025 1%。 为了进一步提高模型的精度和稳定性, 采用三种方法对光谱进行特征波长的筛选。 其中, 经过CARS特征波长筛选后建立的模型较全波段建模结果有很大提升, 尤其是对低含量组分还原糖效果显著。 干物质、 淀粉、 还原糖预测模型的验证集决定系数分别为0.877 6, 0.865 3和0.887 7, 验证集均方根误差分别为0.449 2%, 0.930 2%和0.016 7%。 进一步特征波长提取能够简化模型, 去除无关变量和共线性变量, 从而提高模型的精度和稳定性。 最后, 使用30个样本对所建立模型进行了独立检验, 干物质、 淀粉、 还原糖含量的模型预测值与标准理化值决定系数分别为0.849 9, 0.867 1和0.877 6, 均方根误差分别为0.660 9%, 0.480 9%和0.016 9%, 平均相对误差分别为2.03%, 1.77%和7.58%。 研究表明, 局部透射光谱包含马铃薯的内部信息, 与干物质、 淀粉、 还原糖有显著相关性。 该可见/近红外局部透射光谱检测系统可以实现马铃薯多品质参数的快速无损预测, 特别是干物质含量及淀粉含量的预测效果较好, 但是对个别还原糖含量较低的样品出现预测相对误差较大现象, 下一步研究中需要进一步优化完善。
The authors have declared that no competing interests exist.
| [1] |
|
| [2] |
|
| [3] |
|
| [4] |
|
| [5] |
|
| [6] |
|
| [7] |
|
| [8] |
|
| [9] |
|
| [10] |
|
| [11] |
|
| [12] |
|
| [13] |
|
| [14] |
|
| [15] |
|
| [16] |
|
| [17] |
|
| [18] |
|
| [19] |
|
| [20] |
|
| [21] |
|
| [22] |
|
| [23] |
|
| [24] |
|
| [25] |
|
| [26] |
|
| [27] |
|
| [28] |
|
| [29] |
|
| [30] |
|