


利用太赫兹时域光谱定性鉴别不同品种的苜蓿的研究
[王芳1, 2  , 郭帅
, 郭帅1, 2 , 赵景峰3 , 夏红岩3 , 宝日玛1, 2 , 詹洪磊1, 2 , 王嘉妮1, 2 ]
, 郭帅|
|


这项研究是利用太赫兹时域光谱(THz-TDS)技术结合多元统计方法, 对14种外表看起来极其类似的不同苜蓿牧草品种进行鉴定识别的可行性研究。 通过实验测试获得苜蓿牧草品种在0.1~1.5 THz有效波段的吸收系数和折射率等光谱参数, 并且测试光谱揭示不同种类的苜蓿牧草在时间延迟、 吸收强度和折射率等物理参量的平均值上都有所不同。 尽管以上提到的这些太赫兹特征差异意味着太赫兹时域光谱(THz-TDS)鉴定识别牧草品种是可行的, 但是, 由于没有特征吸收峰作为指纹谱识别依据, 因此, 本文利用多元统计方法聚类分析(CA)和主成分分析(PCA)在光谱参数和不同品种的苜蓿草种之间建立模型用以进行辅助验证, 通过CA方法计算得到牧草间的欧氏距离以及通过PCA方法获得牧草的任何两个样本的PC1分值显示CA和PCA之间存在着很好的一致性, 说明CA和PCA两种多样统计方法均能反映牧草间的差异。 因此, 太赫兹时域光谱技术结合多元统计方法能够成为一种有效的快速检测识别不同苜蓿牧草品种的方法, 进而为将来建立牧草品种太赫兹光谱数据库奠定基础。
, GUO ShuaiIn this study, terahertz time-domain spectroscopy (THz-TDS) and multivariate statistical methods were used to demonstrate the feasibility of identifying fourteen alfalfa forage varieties that look extremely similar. THz spectra parameters, such as refractive index and absorption coefficient, were calculated from 0.1 to -1.5 THz, and the test spectrum revealed that different kinds of alfalfa grass seeds are different in time delay, absorption intensity and average refractive index. Although these characteristics differences mentioned above mean that the THz-TDS are feasible to identify alfalfa forage varieties, the statistical methods, including cluster analysis (CA) and principal component analysis (PCA), were used to build models between THz parameters and different alfalfa forage varieties because there was no characteristics absorption peak as fingerprint identification basis. The Euclidean distances of CA between forage grasses, and the scores of the first principal component (PC1) in PCA method reflect the forage-dependent differences, indicating the consistency between CA and PCA. Consequently, the combination of THz technology and statistical methods can be an effective method for the rapid identification of alfalfa forage with different properties. Furthermore, this combination method also provides a favorable basis for establishing the THz spectrum database of forage species in the future.
The alfalfa forage is one of the most important animal husbandry products in the world. The varieties of alfalfa forage are enormous, and the shapes of different alfalfa seeds are similar to the result that some false and low-grade alfalfa seeds are used to disturb market and cause losses to the herdsmen. Thus, it is urgent to obtain an analytical method to distinguish the properties of alfalfa immediately. Traditional methods such as field planting methods, physical-chemical methods and DNA molecular marker analysis can distinguish alfalfa forage varieties[1]. Spectroscopic analysis technique, however, is an effective and rapid non-destructive method in the field of material classification[2, 3, 4].
Terahertz time-domain spectroscopy (THz-TDS) bridges the gap between microwave and infrared spectroscopy in the electromagnetic spectrum. The spectral information of the THz-TDS can be generated and obtained by a femtosecond laser pulse and Fast Fourier Transform (FFT) respectively. Spectral features are often employed qualitatively to analyze the material structures and physical properties of tested samples. THz technique is considered for alfalfa forage characterization because of more advantages of THz spectroscopy, which is highly sensitive in both time and frequency domains and often acts as a nondestructively on-line method due to its low photon energy. In addition, THz-TDS can provide sufficient information of intermolecular and low-frequency intramolecular modes of chemicals and give the amplitude and phase information of sample simultaneously[5, 6].
The aim of the present research is to investigate the potential of THz spectroscopy as a non-destructive method to distinguish alfalfa forage varieties. Refractive index and absorption coefficient spectra of fourteen alfalfa forage varieties are measured and calculated in 0.1~1.5 THz spectra frequency and the differences of the forage-dependent properties are analyzed qualitatively. Moreover, multivariate statistical methods, including cluster analysis (CA) and principal component analysis (PCA), are then adopted to obtain better results for identifying forage varieties based on THz spectra in this study.
The experimental setup used in this research is comprised of a transmission THz-TDS system and a mode-locked femtosecond Ti-sapphire laser. As shown in Fig.1[7, 8], the system is based on mode-locked Ti: sapphire laser, which provides a pulse width of 100 fs with a repetition rate of 82 MHz and a center wavelength of 800 nm. The femtosecond laser output is split by a cube beam splitter into pump and probe beams. The pump beam is used to generate the THz field and the generation of the THz field occurs by focusing pump beam onto a ZnTe photoconductive antenna. Then this THz field propagates through the sample and is eventually detected by the other ZnTe photoconductive antenna. During the measurements, data are collected as THz time-domain spectra by passing the incident terahertz radiation through the center of the pellets. In this work, dry nitrogen (air) is chosen as the reference and the THz time-domain spectrum is recorded when the THz pulse passes through the sample cell without any pellets in the aperture. In order to avoid the interference of water vapor in the ambient air, the apparatus is placed in a closed box, and dry air is injected until the indoor relative humidity (RH) is less than 2%.The signal-to-noise ratio equals ~1 500 during the measurement[9, 10].
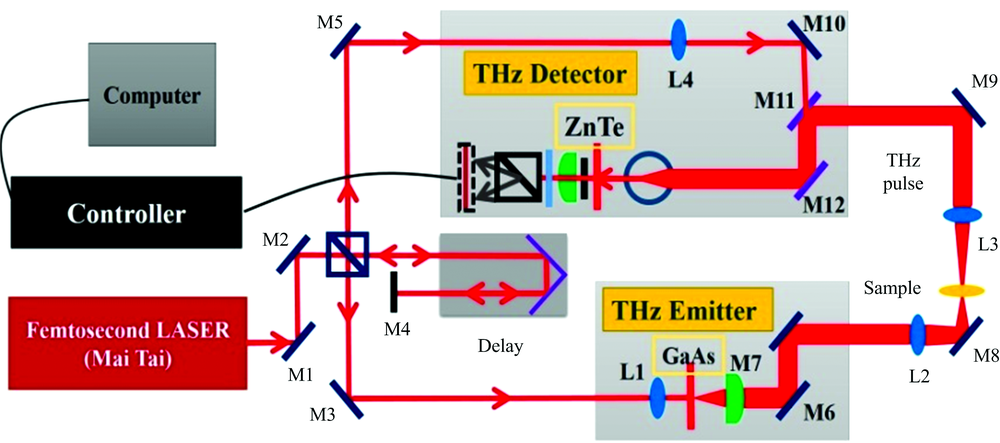 | Fig.1 Experimental setup of THz-TDS measurement |
In this study, fourteen alfalfa forages are prepared for the analysis. Samples are supplied by grassland seed station, Inner Mongolia, China. These forage seeds are representatives of the main production areas in that every seed is mixtures with different components and complex structures, and provides different chemical and physical properties. The protein content is measured by the chemical analysis method, shown in Table 1. The forage samples can be transformed to more stable form during the storage and manufacture process, such as grinding and compaction. In order to form thin and circular samples, forage samples are ground into the fine powder, and then the sieved powder is pressed into pellets with a thickness of 1.19~1.21 mm and a radius of 30 mm under a pressure of 20 MPa for 5 min. The samples are mixed with polyethylene powder, which enables the terahertz wave to transmit well, and it has good adhesion so it will not have a negative effect on the spectrum of the sample. In order to ensure the same density for all samples, the mass ratio is 0.8 grams of forages seed powder with 0.1 grams of polyethylene in these samples. And all samples preparation processes are enforced at room temperature.
| Table 1 The protein content of fourteen kinds of Alfalfa forage |
To analyze tiny difference between fourteen alfalfa forage seeds with extremely similar shapes, two statistical methods are adopted based on the THz spectrum. The cluster analysis (CA), a multivariate statistical method, is used to classify objects into several classes, which are not given in advance and its structures are not assumed but only determined by the characteristics of the data. Objects of the same class tend to resemble each other, but objects of the different classes are almost not similar. Since the process of classification is not given in advance, CA is an exploratory analysis. It can simplify the complex data of the samples by making a logistic calculation to establish a simple model and extract the significant information which cannot be reflected directly in the original data or spectra[11]. The principal component analysis (PCA) is usually used to decrease the dimensionality of variables by projecting the n-dimensional data into a smaller number of linearly uncorrelated variables, namely, principal components (PCs). PCs are orthogonal and ordered such that the kth PC has the kth maximum variation between all PCs. That is to say, the first principal component (PC1) which is orthogonal with the second principal component (PC2) contains the maximum variations. By plotting the scores of PCA, we can view interrelationships between the samples, and detect and explain sample patterns, classifications, differences or similarities[12]. For example, by plotting the scores of the early PCs against each other, samples which are closely related to each other will cluster together in a two-dimensional or three-dimensional space, or obtain the most similar scores by comparing all the PC1 scores. Thus qualitative identification can be achieved[13]. Furthermore, the relationship between the Alfalfa forages can be shown more intuitively by using cluster analysis (CA) and PCA methods[14].
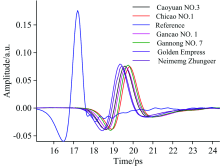
The time domain spectra of reference and fourteen alfalfa samples can be directly measured, and the selected samples are shown in Fig.2. In order to remove the random error and increase the signal-to-noise ratio (SNR), each sample is measured three times; the sample spectrum is the average of three scanning spectra in the range of 0.2~1.5 THz, and the reference is measured every three samples. Not only the amplitude but the peak time indicates that THz technique can give the amplitude and phase information of forage samples simultaneously. The THz frequency-domain spectra (THz-FDS) are calculated using Fast Fourier Transform (FFT). Due to the strong absorption of water, the effective frequency range is reduced to 0.2~1.5 THz, and the sample spectra have narrow bandwidths. Although there is a minor difference in the shift between the samples, there is a remarkable shift between the samples and the reference, which indicates that the refractive index og the samples is different. Moreover, the amplitude changes of the samples indicate that the sample absorption coefficients differ.
 | Fig.2 Time-domain THz spectra of the selected samples in the range of 0.1~1.5 THz |
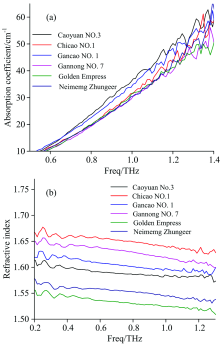
In addition, the refractive index and the absorption coefficients of the selected Alfalfa forage samples are calculated in Fig.3. The difference in the refractive index between the 14 samples is obvious and shows the degrees of dispersion of the 14 samples to THz wave are different, which indicates that composition and structure of the alfalfa forage samples maybe have a significantly difference.
 | Fig.3 (a) The absorption coefficient of selected samples in the range of 0.1~1.5 THz; (b) The refractive index of selected forages samples in the range of 0.1~1.5 THz |
Because of complex biology element of alfalfa forage seeds, there are no obvious absorption peaks in the!spectra from Fig.3(a); On account of the similar components in the samples, optical parameters measured in the paper are very similar. To reveal the variation in measurement effectively, the average absorption coefficients of fourteen forage samples are shown in Fig.4. According to the order from left to right, the average absorption coefficients of the samples are 27.00 (Caoyuan No.2), 26.32 (Caoyuan No.3), 23.55 (Chicao No.1), 22.53 (Zhaodong), 24.55 (Gancao No.1), 26.83 (Gannong No.3), 23.97 (Gannong No.4), 21.84 (Gannong No.7), 21.04 (Gannong No.8), 22.97 (Gongnong), 22.12 (Golden Empress), 24.91 (Longmu), 24.36 (Zhongcao No.3), 24.16(Neimeng Zhungeer), respectively.
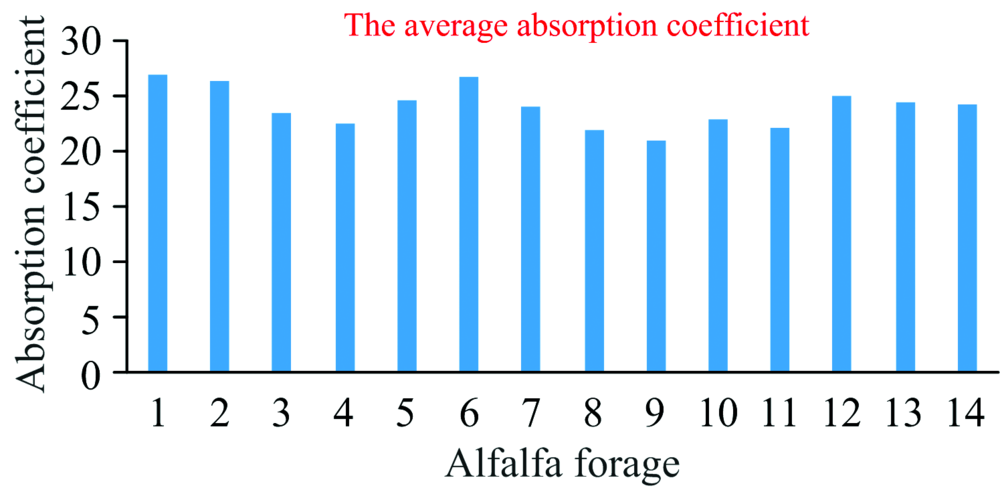 | Fig.4 The average absorption coefficient of fourteen alfalfa forages |
Furthermore, to build a more precise model between forage and THz spectra and realize the determination of forage from different varieties efficaciously, CA and PCA are used to analyze and display the classification of forage, which will be discussed in the next section.
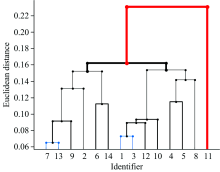
Cluster analysis, a kind of CA method, is used to classify Alfalfa forage from a different variety. Every sample is set as a class at the beginning of calculation and then two classes withminimum Euclidean distance, a variable for measuring the similitude between samples, will be classified as a new one. All samples are calculated based on the distances between them and finally clustered as one class. In order to make a qualitative analysis of the similarity between the 14 kinds of alfalfa forage samples and the influence of its components on the terahertz parameters, the spectral data of the whole spectrum is used as an input set to classify the samples by cluster analysis method. 14 samples are clustered and analyzed, obtaining a dendrogram which characterizes the similarities and differences between 14 kinds of forage species by 13-step stepwise clustering. In this study, both the absorption spectra and the refractive spectra of forage samples from 0.2 to 1.5 THz are applied to obtain the best model. Then, the models are employed to predict the fourteen varieties of samples. The Fig.5 shows the dendrogram of refractive index spectra with input variables. The results indicate that 14 species can be divided into two categories, Golden Empress as the first category, and the remaining 13 samples for the second category. The Golden Empress Euclidean distance of the first class is 0.23, greater than the second class in the two samples. In the second category, which is classified into Gannong No.3 and Zhongcao No.4, Zhongcao No.4 has the minimum distance, and the Euclidean distance of new classes they compose with Gannong No.8 is smaller. This shows that the refractive indexs of the three kinds of samples in the terahertz are similar. Analogously, there is a small Euclidean distance between the Caoyuan 2 and the Chicao No.1, and the new class is also kept as semblable refractive index with Gongnong and Longmu.
 | Fig.5 The Euclidean distance dendrogram with the input of refractive index spectra from 0.1 to 1.5 THz |
In the two categories of the refractive index dendrogram, the Golden Empress of the first class is the varieties introduced from abroad and the remaining samples of the second category are domestic varieties, the difference of which is more affected by the geographical environment and the composition of the component. Fig.5 shows that the Euclidean distance similarity of Zhaodong, Gancao No.1, Gannong No.3 and Neimeng Zhungeer indicates the similar protein content (Zhaodong and Gancao No.1, Gannong No.3 was 36.3%, Neimeng Zhungeer was 36.2%); the Euclidean distance of Gongnong and Longmu is close to each other and their protein contents are also similar (37.4% and 37.6%, respectively). There is a certain corresponding relationship between the relative value of protein content and the refractive index difference of each sample. The Euclidean distances of Caoyuan No.2 and Chicao No.1 are small, but the protein contents are quite different, which indicates that the close refraction index is the result of the comprehensive function of the physical parameters. Therefore, the refractive index of forage in the terahertz frequency range is determined by the comprehensive physical properties, in which the protein content is a very important factor.
Similar to the calculation process of Fig.5, all the absorption data in the 0.1 to 1.5 THz band are used as the input variables of cluster analysis, and the cluster tree diagram based on the absorption coefficient spectrum can be calculated, as shown in Fig.6. From Fig.4, we can see that the Caoyuan No.2 has the largest absorption coefficient in the terahertz band, corresponding to the tree diagram of Fig.6, and the Caoyuan No.2 is a class and has a larger Euclidean distance. In the 14 kinds of forage samples, Zhaodong and Gannong No.7 have the minimum Euclidean distance and highest similarity, and Zhaodong and Gannong No.7 consisting of the new class with Gold Empress have the second Euclidean distance, followed by Chicao No.1 and Zhongcao No.3. Similarly, Caoyuan No.3 and Gannong No. 3 are classified as a class, owing to the fact that they are larger and closer to the absorption coefficient. Because the absorption coefficient of the sample is relatively larger, the maximum Euclidean distance (35) of the absorption coefficient is much larger than the maximum distance of the refractive index (0.23). Forage seed is a kind of mixture and material composition, which is very complicated. All of the material composition content of forage (such as oils and carbohydrates) is unknown and needs to be measured, so the impact of the components of forage on terahertz absorption coefficient needs a further research and analysis.
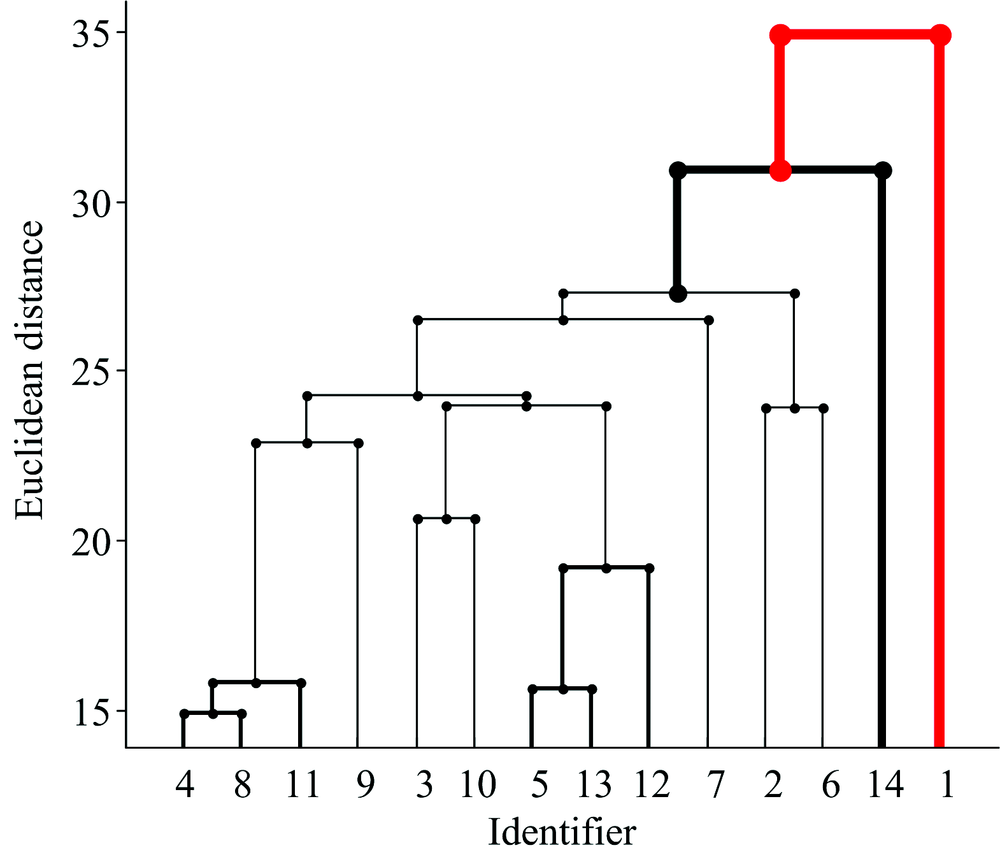 | Fig.6 The Euclidean distance dendrogram with the input of absorption coefficient spectra from 0.1 to 1.5 THz |
PCA is used to reduce the dimensionality of THz spectroscopic data and investigate qualitative differences between 14 kinds of forage alfalfa samples. A dataset of 42 forage alfalfa samples is used to perform PCA. By performing PCA, the eigenvalues of the first two eigenvectors (PCs) extracted from the THz refractive index spectra of these 42 samples are 98.95% and 0.54%, respectively. The first two PCs, which account for more than 95% variance in the data set, describe the most spectral variations related to the origin and are used to make differentiation clearer. Fig.7 gives the two-dimensional (2D) principal component scores scatter plot of forage alfalfa samples using the first two PCs (PC1, PC2) and demonstrates how the two PCs can divide the samples. It can be seen from Fig.7 that all forage alfalfa samples can be separated clearly into two categories by using the first two PCs as features. In the two-dimensional system, the varieties introduced from abroad are located at the left, while the domestic varieties are at the right and the central locations. Consequently, PC 1 versus PC 2 system can directly distinguish the classification of forage.
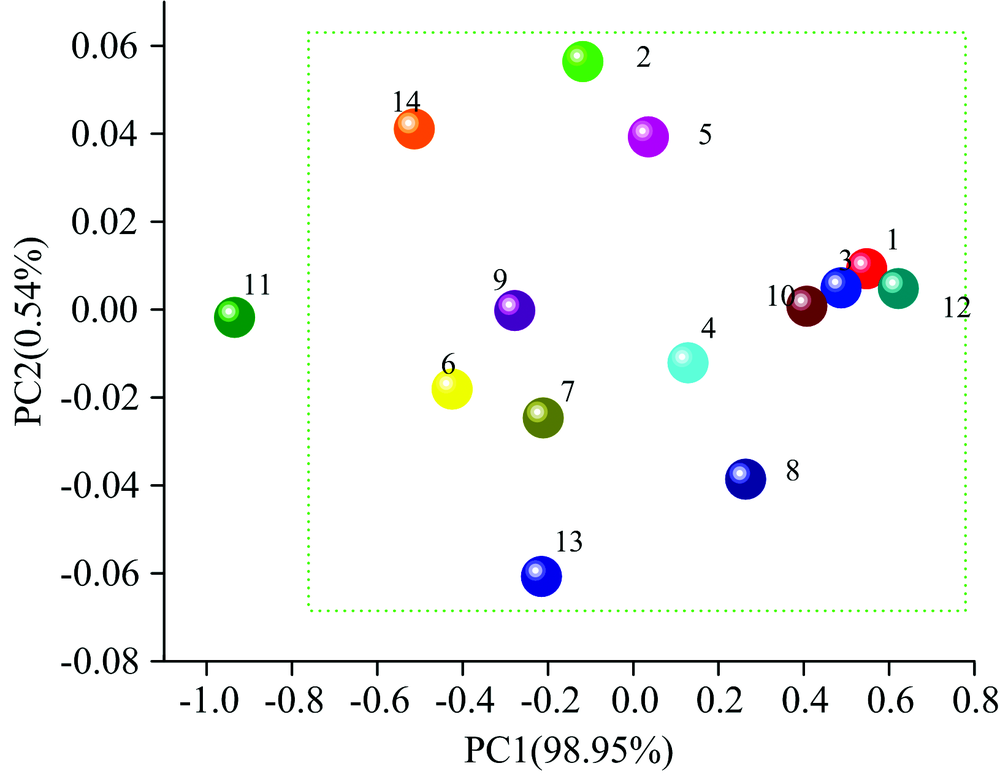 | Fig.7 PC 1 VS PC 2 in the two-dimensional PCA system. PC 1 and PC 2 indicate 98.95% and 0.54% information of oils, respectively |
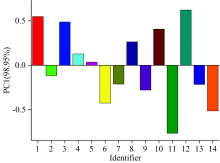
The importance of PCs is described by corresponding contribution rate. The larger contribution rate is, the more information PC will reflect (T Chen, Z Li, X Yin., F Hu, C Hu. 2016). According to the great differences between dispersion and absorption effects shown in Fig.3, the next calculation with CA and PCA methods is obtained with the data of refractive index, and the absorption coefficient in the range of 0.2~1.5 THz, respectively. As shown in Fig.8, the refractive index spectra are firstly calculated with PCA methods obtaining the PC1 score histogram. It can be seen from Fig.5 that all the samples are clustered into one class with thirteen steps. The first PC-PC1 of the data set is found to describe 98.95% of the variances within the data. The more similar PC1 scores of any two samples are, the more similarity they’ ll have. On the contrary, the larger PC1 scores deviation of samples is, the more differences they’ ll have. The results show that Golden Empress is the most special forage shown in both CA dendrogram and PCA histogram. The distance and deviation between Golden Empress forage and others are the largest. In contrast with this, the distance between Gannong No.4 and Zhongcao No.3 is the smallest in Fig.5, which is consistent with the deviation of corresponding PC1 scores. Forage from other varieties in this research are clustered, reflecting similarities between them.
 | Fig.8 PC1 score histogram calculated with refractive index data |
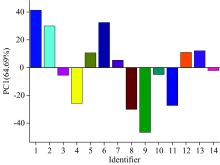
The results calculated by PCA methods with the input of absorption coefficient spectra data are depicted in Fig.9. Comparing the Fig.6 with the Fig.9, Caoyuan No.2 forage reflects a great particularity both in CA and PCA calculation progress. The distance between Caoyuan No.2 forage and others reaches a maximum, and its PC1 score is in the lead compared to other forages. From Fig.9, we infer that Zhaodong and Gongnong No.7 forage have some similarities because of the small distance and analogous PC1 scores. A similar phenomenon is found between the forages from Gancao No.1 and Zhongcao No.3. These are in accord with preceding results calculated with refractive index data.
 | Fig.9 PC1 score histogram calculated with absorption coefficient data |
Different responses in the THz range are observed concerning fourteen representative kinds of Alfalfa forages from different varieties. CA and PCA methods are used to classify the similarity between forages and results show that the distances and PC1 scores match well with certain properties of different forages. In spite of existing differences in refractive index and absorption coefficient spectra of Alfalfa forages, the use of multivariate statistical methods greatly improves the identification effect and provides a more direct and effective display way to identify different forages. The more Alfalfa forages are used to analyze; the more abundant models can be obtained. Based on the results above, more and more Alfalfa forages can be measured by THz-TDS and clustered with CA and PCA to build an abundant database, which acts as the identification standard of Alfalfa forages from different regions. Consequently, THz-TDS is a method for rapid identification of Alfalfa forages and can be used as a supplementary mean of traditional methods in Alfalfa forages varieties identification fields.
In conclusion, the THz spectra as a new, potential and non-destructive technology for Alfalfa forages has been demonstrated. First, the refractive index spectrum and absorption coefficient spectrum of forage samples are calculated and analyzed separately in the paper; there exist obvious differences between all kinds of seeds both in refractive index and absorption coefficient spectra in THz range of 0.1 to 1.5 THz. Then, two multivariate statistical methods, CA, and PCA, are used to build qualitative models between forages and their THz spectra. The results show that the smaller the Euclidean distance is, the greater the refractive index will be, and the protein content is a very important factor affecting the refractive index of forage. Furthermore, the Euclidean distances in CA dendrogram and PC1 scores in PCA histogram directly display the similarity or differences between any two forages from different varieties. As a result, the THz spectroscopy associated with statistical methods show useful measurement and identification of alfalfa forage varieties. However, further study should be considered to develop for more alfalfa forage varieties and other forage varieties for quick test and batch identification.
The authors thank the Department of Science and Technology of Inner Mongolia for funding this research. The authors also thank the following people and unions for their valuable contribution to this research: Dr. Kun Zhao for suggestions to improve the quality of manuscript and the Grassland Workstation of Inner Mongolia for providing the forage seeds of the work.
The authors have declared that no competing interests exist.
| [1] |
|
| [2] |
|
| [3] |
|
| [4] |
|
| [5] |
|
| [6] |
|
| [7] |
|
| [8] |
|
| [9] |
|
| [10] |
|
| [11] |
|
| [12] |
|
| [13] |
|
| [14] |
|