引用本文
[J]. 光谱学与光谱分析, 2018,38(11): 3622-3630.
Omar B. Ibrahim, El-Sayed A. Manaaa, M.M. AL-Majthoub, Ahmed M. Fallatah, Abdel Majid A. Adam, Mha M. Alatibi, Jehan Y. Al-Humaidi, Moamen S. Refat. Estimation of Metformin Drug for the Diabetes Patients by Simple, Quick and Cheap Techniques within the Formation of Colored Charge Transfer Complexes[J]. Spectroscopy and Spectral Analysis, 2018,38(11): 3622-3630.
Doi:10.3964/j.issn.1000-0593(2018)11-3622-09
Permissions
Omar B. Ibrahim, El-Sayed A. Manaaa, M.M. AL-Majthoub, Ahmed M. Fallatah, Abdel Majid A. Adam, Mha M. Alatibi, Jehan Y. Al-Humaidi, Moamen S. Refat. Estimation of Metformin Drug for the Diabetes Patients by Simple, Quick and Cheap Techniques within the Formation of Colored Charge Transfer Complexes[J]. Spectroscopy and Spectral Analysis, 2018,38(11): 3622-3630.
Doi:10.3964/j.issn.1000-0593(2018)11-3622-09
Copyright©2018, 《光谱学与光谱分析》期刊社
《光谱学与光谱分析》期刊社 所有
Estimation of Metformin Drug for the Diabetes Patients by Simple, Quick and Cheap Techniques within the Formation of Colored Charge Transfer Complexes
Omar B. Ibrahim1 , El-Sayed A. Manaaa2, 3 , M.M. AL-Majthoub1 , Ahmed M. Fallatah1 , Abdel Majid A. Adam1 , Mha M. Alatibi1 , Jehan Y. Al-Humaidi4 , Moamen S. Refat1, 5, * 
Abstract
Metformin (Met) is a drug developed for the treatment of patients with type Ⅱ diabetes. Recently, Met estimation in pharmaceutical formulations and human fluids has gained a growing interest. To extend requisite data that can be used to assessment of Met quantitatively based on charge-transfer (CT) complexation, the present study describes the synthesis and characterization of CT complexes that formed between drug Met and the organic π-acceptors picric acid (PA), chloranilic acid (CLA), chloranil (CHL), 7,7’,8,8’-tetracyanoquinodimethane (TCNQ), and dichlorodicyanobenzoquinone (DDQ). The properties of the formed CT complexes were investigated by elemental, spectral (UV-visible, IR, and Raman spectroscopies), thermal (TG) and morphological (SEM) studies. IR results indicated that the complexation of Met with either PA or CLA acceptors occurs through proton transfer interaction, whereas its complexation with CHL, TCNQ, or DDQ acceptors occurs through n→ π* interaction.
Keyword:
Metformin; Anti-diabetic drug; Charge-transfer complex; Acceptor; Solution study


Introduction
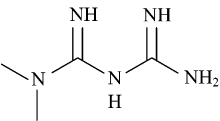
Metformin (Met; Figure 1) is the oldest commonly prescribed agent and one of the most effective oral treatments of type Ⅱ diabetes. It is an oral hypoglycemic agent and has been in clinical use over half a century[1, 2, 3]. It is the first line drug of choice to treat NIDDM patients; non-insulin dependent diabetes mellitus. Met enhances insulin sensitivity and is not effective in the absence of insulin. It induces multiple beneficial effects such as (1) reducing blood glucose levels, (2) lowering blood lipid, (3) reducing weight gain, (4) does not increase the risk for hypoglycemia[1, 4]. Met lowers blood glucose level in type Ⅱ diabetes patients by suppressing hepatic glucose output and enhancing peripheral glucose uptake[5]. Met is a moderately strong base of pKa1=11.51 and pKa2=2.8 at 25 ℃, and can be administered in the form of one of its pharmaceutically acceptable salts of various organic and inorganic acids, such as the benzoate, acetate, hydrochloride, etc. The complexation data on Met with metals are important in pharmaceutical and medical applications. Some of these metal complexes exhibited a significant increase in hypoglycemic activity compared to pure Met. Metal complexes of Met with several transitional metal ions, and some lanthanide metal ions have been investigated and reported in the literature. Examples of these metal ions are: Rh(Ⅲ )[6], Ir(Ⅲ )[7], Os (Ⅱ )[8], Os(Ⅲ )[8], Pd(Ⅱ )[9], Te(Ⅴ )[10], Rh(Ⅴ )[10], Cu(Ⅱ )[11], Ni(Ⅱ )[11], Zn (Ⅱ )[12], Cr (Ⅲ )[13], V(Ⅳ )[13], Co(Ⅱ )[14], Pt(Ⅱ )[14], Tc(Ⅴ )[15], Re(Ⅴ )[15], Au(Ⅲ )[16], Fe(Ⅲ )[16], Cd(Ⅱ )[16], La(Ⅲ ), Ce(Ⅲ )[17], Sm(Ⅲ )[17], and Y(Ⅲ )[17].
 | Fig.1 Chemical structure of drug metformin (Met) |
The chemistry of proton-transfer (PT), charge-transfer (CT), or H-bonding interactions between organic or inorganic molecular acceptors with either drugs or biological compounds in the solution state or solid has attracted significant interest and growing area of research in recent years for the following reasons:
(1) Useful in studying and understanding drug-receptor binding and the drug’ s mechanism of action[18, 19, 20].
(2) Obtains quantitative estimates of drugs in pure form or in pharmaceutical preparations that are more straightforward, cheaper, rapid and accurate[21, 22, 23].
(3) Removes and utilizes discarded medications from environments[24].
(4) Significant physical and chemical properties of the obtained complexes[25, 26, 27, 28].
(5) Plays crucial roles in many biological fields such as antibacterial, antifungal, DNA-binding, and insecticidal[29, 30, 31, 32, 33, 34, 35].
Recently, Met assessment in human fluids and pharmaceutical formulations has gained a growing interest. To extend requisite data that can be used to assessment of Met quantitatively based on CT complexation, the present study highlighted the structural chemistry of CT complexes formed from the intermolecular interactions of Met with the organic π -acceptors (i.e., picric acid (PA), chloranilic acid (CLA), chloranil (CHL), 7, 7’ , 8, 8’ -tetracyanoquinodimethane (TCNQ), dichlorodicyanobenzoquinone (DDQ)). Firstly, the CT complexes of Met with PA, CLA, CHL, TCNQ, and DDQ acceptors were obtained. Then, the formed complexes were stoichiometrically, structurally, thermally, and morphologically characterized by elemental, spectral, thermal, and microscopic data (UV-visible, IR, Raman, TG, and SEM).
1 Experimental Section
1.1 Chemicals
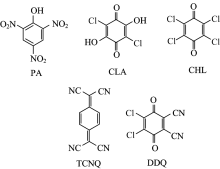
All of the chemicals used were of high reagent grade and were obtained from Aldrich and Merck Chemical Companies. All the chemicals were directly used for the synthesis with-out further purification. Metformin; IUPAC name N, N-dimethyl-imido-dicarbonimidic diamide (Met; C4H11N5; 129.16) (Figure 1) was supplied by Sigma(Aldrich Chemical Co (USA). The organic acceptors picric acid (PA; C6H3N3O7; 229.10), chloranilic acid (CLA; C6H2Cl2O4; 208.98), chloranil (CHL; C6Cl4O2; 245.88), 7, 7’ , 8, 8’ -tetracyanoquinodimethane (TCNQ; C12H4N4; 204.19), and 2, 3-dichloro-5, 6-dicyano-1, 4-benzoquinone (DDQ; C8Cl2N2O2; 227) (Figure 2) were purchased from Merck (Darmstadt, Germany) and used without modification. HPLC-grade methanol was also purchased from Merck (Darmstadt, Germany).
 | Fig.2 Chemical structure of the organic acceptors used in the study |
1.2 Characterizations methods
The microanalytical analyses of %C, %H, and %N percentages were calculated using a Perkin-Elmer 2400 series CHN microanalyzer. The IR spectra with KBr discs were measured using a Bruker FT-IR Spectrophotometer (4 000~400 cm-1), while the Raman laser spectra were measured on the Bruker FT-Raman spectrophotometer equipped with a 50-mW laser (4 000~50 cm-1). The electronic absorption spectra were recorded in methanol solvent within 200~800 nm using a UV2-Unicam UV/Vis Spectrophotometer with a 1.0-cm quartz cell. Thermogravimetric (TG) analysis was performed using a Shimadzu TGA-50H thermal analyzer with standard platinum TG pans. The measurements were conducted at a constant heating rate of 10 ℃· min-1 over the temperature range of 25~800 ℃ under air atmosphere using alumina powder as the reference material. The SEM images were obtained using a Jeol Jem-1200 EX Ⅱ electron microscope at an acceleration voltage of 25 kV.
1.3 Synthesis of the CT complexes
A methanolic solution (25 ml) of each acceptor (2 mmol) (either PA, CLA, CHL, TCNQ, or DDQ) was stirred with a methanolic solution (25 mL) of drug Met (2 mmol) for ca. 30 min on a magnetic stirrer at room temperature. Then the solution was reduced to one-half by evaporation on a water bath. The formed complexes were isolated as a yellow canary, purple, green, greenish-brown, and brown for Met-PA, Met-CLA, Met-CHL, Met-TCNQ, and Met-DDQ, respectively. The solid products were filtered off and washed thoroughly with pure-grade methanol. Then, the products were collected and dried in vacuo for 48 h. The products were characterized by spectroscopy (UV-Vis, IR, and Raman) as well as elemental and thermal analyses[36, 37, 38, 39, 40].
2 Results and discussion
2.1 Stoichiometry of the CT interactions
The stoichiometry of the Met-acceptor interaction in the solid-state in methanol solvent was determined using CHN elemental analyses. The microanalytical data obtained are listed in Table 1. From this table, it can be seen that the experimental values are in good agreement with the calculated values of C, H, and N which indicate that the synthesized CT complexes between the Met and each acceptor (PA, CLA, CHL, TCNQ, and DDQ) were free of impurities. The elemental analysis results indicate that the stoichiometry of all five CT interactions (Met-PA, Met-CLA, Met-CHL, Met-TCNQ, and Met-DDQ) is 1∶ 1.
| Table 1 Microanalytical data of the synthesized complexes of Met with the organic acceptors PA, CLA, CHL, TCNQ, and DDQ |
2.2 IR spectroscopy
2.2.1 Free Met
The IR spectra bands of the free Met and its CT complexes with the acceptors are shown in Figure 3, whereas the peak assignments for the important peaks are reported in Table 2. The most significant bands of the free Met can be classified into three groups: (1) N— H vibrational bands of primary (— NH2), secondary (— NH) and imino (— C=NH) groups; (2) C— N and C=N vibrational bands; and (3) C— H vibrations of the two methyl groups. The free Met shows the following characteristic vibrations on its IR spectrum: (1) N— H vibrations: the strong bands observed at 3 369~3 295 and 3 153 cm-1were assigned to N— H asymmetric and symmetric stretching vibrations, respectively. The very strong band observed at approximately 1 556 cm-1 was attributed to the δ (N— H) vibrations; (2) C— H vibrations: the bands observed in the range of 3 088 and 2 815 cm-1 were assigned to the ν as(C— H) and ν s(C— H) of the aliphatic methyl group. The presence of nitrogen near the methyl group reduces the symmetric CH3 stretching vibration to 2 815 cm-1. The bands observed at 1 463 cm-1 can be attributed to the C— H bending deformation vibrations. The sharp band at ~933 cm-1 was assigned to δ rock(C— H) vibrations; (3) C=N vibrations: the band centered at 1 624 cm-1 was assigned to the v(C=N) vibrations; (4) C— N vibrations: the medium intensity bands observed at 1 271 and 1 168 cm-1 were assigned to C— N asymmetric and symmetric stretching vibrations, respectively.
| Table 2 IR spectral assignments of the synthesized complexes of Met with the organic acceptors PA, CLA, CHL, TCNQ, and DDQ |
 | Fig.3 IR spectra of the free Met and its CT complex with the acceptors (PA, CLA, CHL, TCNQ, and DDQ) |
2.2.2 PA and CLA complexes
The characteristic bands of the free Met observed at 3 369~3 295 and 3 153 cm-1, which are assigned to N— H asymmetric and symmetric stretching vibrations, respectively, shifted and reduced in intensity after complexation with PA and CLA acceptor. The ν (O— H) vibration of the free PA and free CLA acceptor are observed as a strong broae band at 3 416 and 3 230 cm-1, respectively. These strong broad band were not observed in the spectrum of their complex with Met. Additionally, the IR spectrum of Met-PA complex is characterized by a broad medium band that appear at 2 777 cm-1. This broadened band is attributed to the stretching vibration of the stretching vibration of the intermolecular hydrogen bond. All these observation suggesting that the — NH2 group in the Met and the OH group in the PA or CLA acceptor participate in the complexation process, and confirms the proton transfer from the OH group of the PA or CLA acceptor to the nitrogen atom of the — NH2 to form an intermolecular H-bonded ion pair (+N— H…O-)[41, 42, 43, 44, 45, 46, 47, 48, 49, 50]. As a result of complexation with PA acceptor, the vibrational frequencies of nitro group of the free PA acceptor— ν as(NO2), ν s(NO2), δ sciss.(NO2), ω (NO2), and δ rock(NO2)— appearing at 1 608, 1 343, 781, 703, and 522 cm-1, respectively, were shifted and observed in the CT complex at 1 615, 1 329, 790, 710, and 514 cm-1, respectively.
2.2.3 CHL, TCNQ and DDQ complexes
The characteristic bands observed at 3 369~3 295 and 3 153 cm-1 that results from the ν as(N— H) and ν s(N— H) vibrations, respectively, of the free Met shifted and reduced in intensity after complexation with CHL, TCNQ or DDQ acceptor. The observed shift in the N— H asymmetric and symmetric stretching vibrations upon complexation suggests that this group participated directly in the complexation. The — C=O and — Cl groups in the CHL acceptor, the — CN groups in the TCNQ acceptor, and the — C=O, — Cl and — CN groups in the DDQ acceptor are electron withdrawing groups, removing electron density from the aromatic ring and thereby causing these acceptors to become an electron-accepting moiety. Thus, because of the electron-withdrawing effect of the CHL, TCNQ, and DDQ acceptor and the good electron-donating ability of the — NH2 group of Met, the interaction mode between the Met and these acceptors can occur through n→ π * charge migration via the lone pair of electrons on the nitrogen (— NH2) and the aromatic ring of the acceptors[51, 52, 53, 54, 55, 56]. The band of v(C=C) of the free acceptors appeared at 1 487, 1 540, and 1 451 cm-1 for CHL, TCNQ and DDQ, respectively. Once these acceptors interact with the Met those bands shift in the corresponding CT complex to 1 404, 1 493, and 1 411 cm-1, respectively. The bands that results from the v(C≡ N) vibration of the free TCNQ and free DDQ acceptor were changed in frequencies and decrease in intensities upon CT compexation. Free TCNQ shows v(C≡ N) vibration at 2 220 cm-1, while in its complex with Met it occur at 2 211 cm-1, while free DDQ shows v(C≡ N) vibration at 2 250 and 2 331 cm-1, while in its complex with Met it occur at 2 240 cm-1.
2.3 Laser Raman spectroscopy
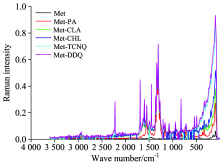
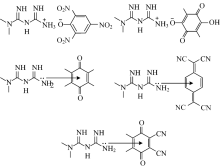
Figure 4 shows the representative laser Raman spectra of the synthesized CT complexes. In the Laser Raman spectrum of the free Met, the N— H asymmetric stretching vibration band was located around 3 309 cm-1, and that of the symmetric stretching vibration around 3 191 cm-1. The asymmetric C— H stretching band appeared at 2 939 cm-1, while that of the symmetric stretching band appeared at 2 817 cm-1. The absorption around 1 649 cm-1 is due to the C=N stretching vibrations. The C— H deformation mode was observed at 1 455 cm-1, while the sharp and very strong band located at 740 cm-1 is due to the δ rock(C— H) vibrations. The laser Raman spectrum of the PA complex shows a very strong band at 1 310 cm-1 is due to the symmetric stretching vibrations of NO2. Bands observed at 1 624, 1 351 and 1 276 cm-1in the Raman spectrum of the CLA complex were assigned to vs(C=O), δ def.(C— H) , and ν (C— O), respectively. The CHL complex exhibits a sharp and very strong band at 1 686 cm-1, which clearly correspond to the asymmetric vibrational modes of v(C=O), while the symmetric vibrational modes of v(C=O) was observed as a medium band at 1 611 cm-1. The Raman spectrum of the TCNQ complex was characterized by two sharp and very strong bands at 2 228, 1 600, and 1 457 cm-1 due to the v(C≡ N), δ (N— H), and v(C=C) vibrations, respectively. The v(C≡ N) vibrational band of the DDQ complex appears at 2 253 cm-1 in the Raman spectrum of this complex. Based on the IR and Raman results, the proposed structures of the synthesized CT complexes is illustrated in Figure 5.
 | Fig.4 Laser Raman spectra of the free Met and its CT complex with the acceptors (PA, CLA, CHL, TCNQ, and DDQ) |
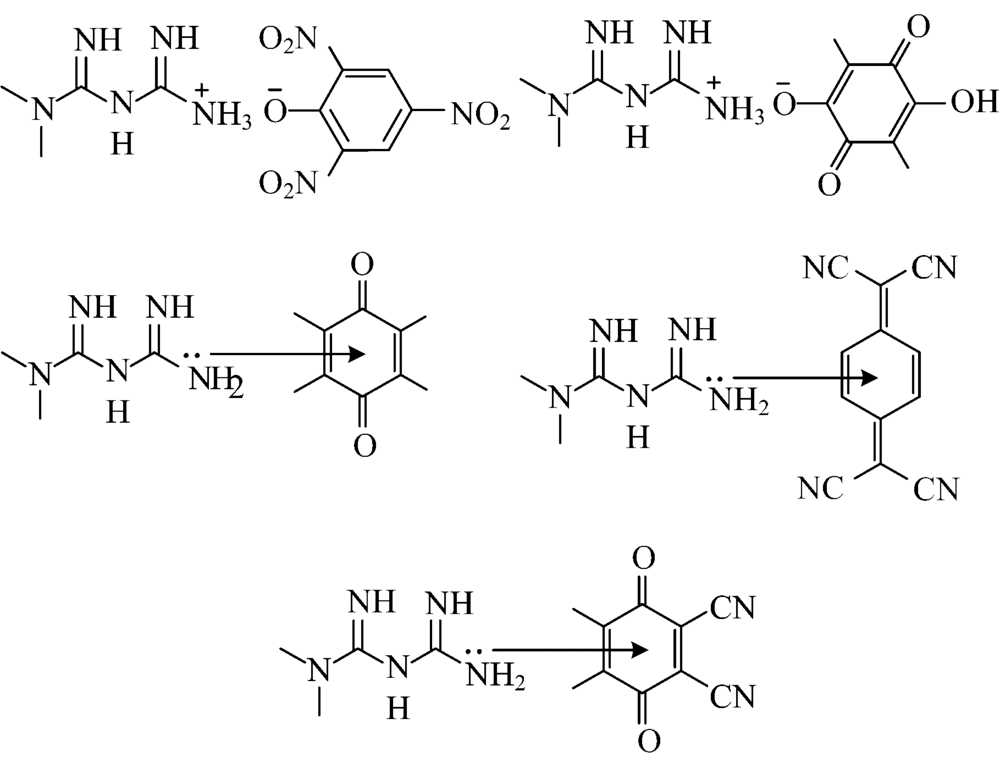 | Fig.5 The proposed structure of the Met-acceptor complexes |
2.4 Electronic spectra
A solution of Met (5.0× 10⁻⁴ mol· L-1) was mixed with each acceptor solution (PA, CLA, CHL, TCNQ, and DDQ) (5.0× 10⁻⁴ mol· L-1) in methanol solvent, and the reaction was allowed to proceed at room temperature. The electronic spectrum of each Met-acceptor reaction mixture was then recorded against a reagent blank solution. A change in the color of the solutions was observed as the Met and acceptor solutions were mixed. These changes provide strong evidence of CT interactions between the Met and each acceptor. The electronic spectrum of free Met has an absorption bands within the ultraviolet region at 228, 262, and 284 nm and within the visible region at 375 nm[13, 17]. The absorption spectrum of the free PA, CLA, CHL, TCNQ, and DDQ acceptor has a λ max at 351, 303, 295, 330, and 280 nm, respectively[24, 57, 58]. Upon the addition of each acceptor to Met, the characteristic absorption band of the acceptor was batho- or hyp-sochromic shifts, and increase in the intensity. These change in the intensities and shift in the wavelengths are attributed to the CT interactions. Figure 6 displays the electronic absorption spectra of the resulting CT complexes in methanol in the region of 320~800 nm. These spectra revealed an absorption bands that are attributed to the CT interactions. These bands are observed at 353, 343, 355, 395 and 350 nm for Met-PA, Met-CLA, Met-CHL, Met-TCNQ, and Met-DDQ, respectively.
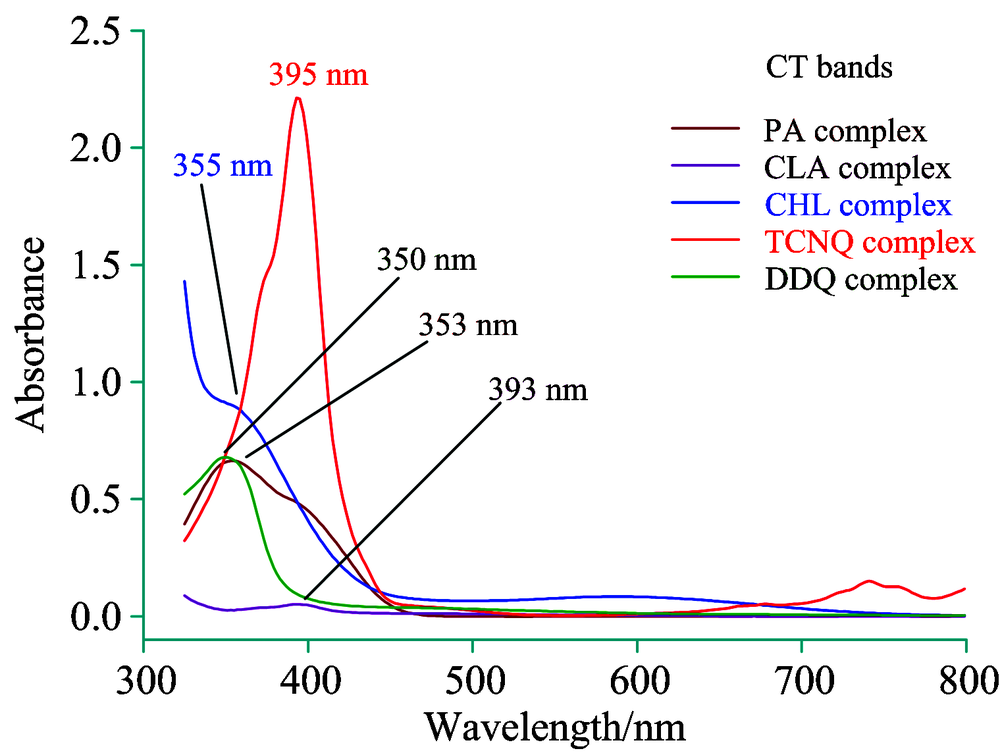 | Fig.6 Electronic absorption spectra of the synthesized CT complexes in methanol solvent at room temperature2.5 Thermal characterization |
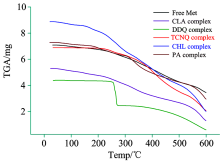
The thermal decomposition and stability of the free Met and its CT complexes with the organic acceptors PA, CLA, CHL, TCNQ, and DDQ were investigated by the TG analysis. The possible thermal degradation patterns for synthesized CT complexes are collected in Table 3, and their representative TG thermograms are depicted in Figure 7. The analysis of the obtained thermograms provided the following observations:
 | Fig.7 TGA curves of the synthesized CT complexes |
| Table 3 Thermal decomposition data for the free Met and its CT complexes with the organic acceptors PA, CLA, CHL, TCNQ, and DDQ |
(1) The observed weight losses in each decomposition step were in good agreement with the calculated weight losses.
(2) The Met-DDQ and Met-TCNQ complex exhibited good thermal stability up to 250 and 210 ℃, respectively.
(3) The complexes are stable up to ~60, 250, 210, 140 and 160 ℃ for the Met-CLA, Met-DDQ, Met-TCNQ, Met-CHL, and Met-PA complex, respectively. Thus, these CT complexes are stable in the solid state at room temperature, and can be stored for several months without degradation.
(4) All the CT complexes exhibit a two-stage degradation process, except the PA complex which was thermally decomposed in approximately three decomposition steps.
(5) The decomposition of the CT complexes is almost complete with the formation of the solid carbon nitride (C3N4) as the final decomposition products.
From the TG curve of free Met, it appears that the Met decomposes in two definite stages over the temperature range of 25~600 ℃. The decomposition occurs with a mass loss of 13.15%, and 51.07% of the mass remains as a thermal residual product; the residue was assigned to carbon nitride (C3N4). The thermal analysis curve of the CLA complex shows that decomposition takes places in two stages within the temperature range of 25~600 ℃ at DTGmax peaks of 210 and 400 ℃ corresponding to a weight loss (found; 21.69, calc.; 21.74%) and (found; 50.97, calc.; 51.04%), respectively. The thermogram of the DDQ complex indicates that it is thermally stable up to 250 ℃. Its thermal decomposition proceeds via two degradation steps. The first degradation step takes place in the temperature range of 25~300 ℃, accompanied by a DTGmax peak at 306 ℃ with an observed weight loss of 37.37%. The second step occurs within the temperature range of 300~600 ℃, accompanied by a DTGmax peak at 450 ℃ with a weight loss of 49.69%, leaving C3N4 as the final products. The thermal degradation of the Met-TCNQ complex proceeds in two main stages. The first degradation step takes place in the temperature range of 25~380 ℃, accompanied by a DTGmax peak at 310 ℃ with an observed weight loss of 10.90%. The second step occurs within the temperature range of 380~600 ℃, accompanied by a DTGmax peak at 445 ℃ with a weight loss of 61.22%.The C3N4 is the final product, free of any residual carbon. The thermal degradation of the CHL complex exhibited two continuous steps at temperature ranges of 25~325, and 325~600 ℃ with DTGmax of 283, and 500 ℃, corresponding with weight losses of 28.30, and 46.98%, respectively. The final product formed at 600 ℃ is assigned to carbon nitride (C3N4). The thermogram of the PA complex exhibited three steps, and its thermal decomposition began at 160 ℃. The first degradation step occurred within a temperature range of 25~240 ℃ at DTGmax of 200 ℃, corresponding to weight loss of 12.81%. The second step occurred within the 240~400 ℃ temperature range (obs.=25.67, cal.=25.70%) accompanied by a DTGmax at 308 ℃. The final step occurred within the 400~600 ℃ temperature range (obs.=25.70, cal.=25.69%) accompanied by a DTGmax at 557 ℃. Carbon nitride was the final product with some residual carbon.
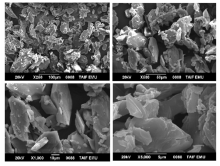
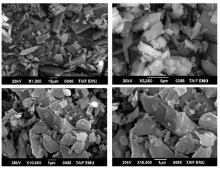
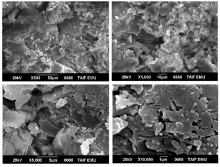
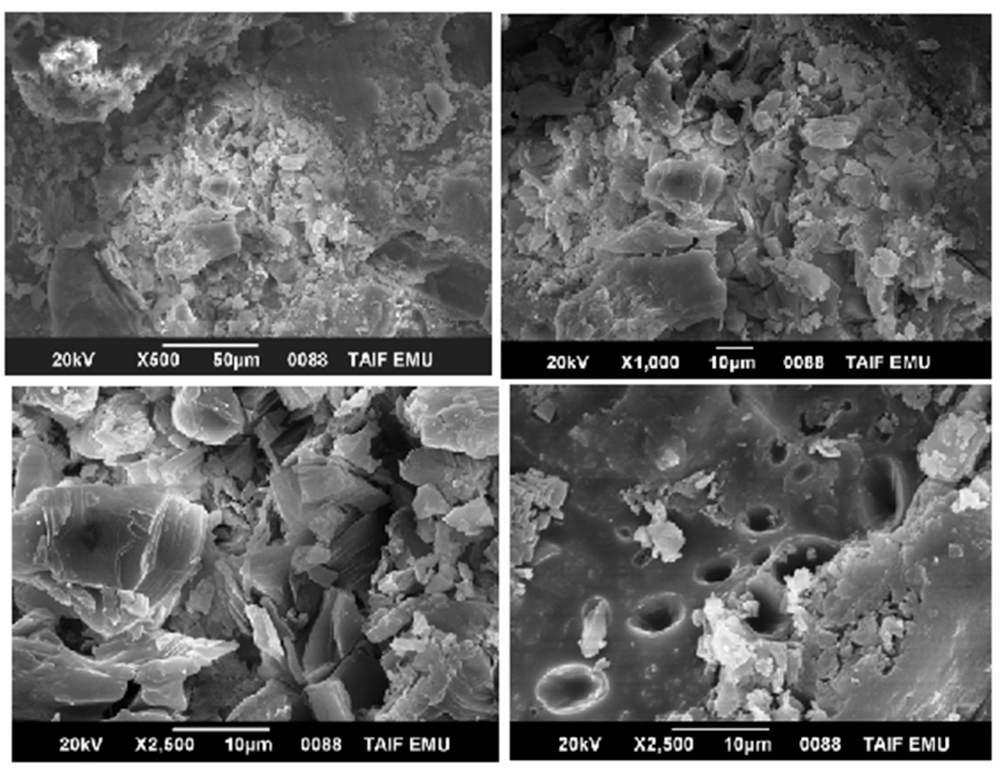
2.6 SEM characterization
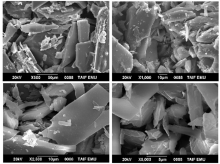
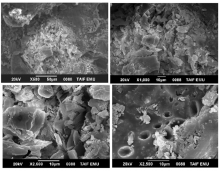
The surface morphology and structural features of the synthesized CT complexes were visualized using SEM technique. Figures 8, 9, 10, 11 and 12 present multiple SEM micrographs of the outer surfaces of the Met-PA, Met-CLA, Met-CHL, Met-TCNQ, and Met-DDQ complex, respectively, at different levels of magnification (i.e., × 250, × 500, × 1 000, × 5 000, × 10 000, × 15 000). Generally, the SEM micrographs of the outer surfaces of the complexes revealed that these complexes have a well-defined shape, uniform matrix, and distinct size and morphology with homogeneously dispersed nanoparticles, indicating the formation of homogeneous materials. A clearly visible morphological change was observed between the synthesized CT complexes indicating that they are quite different in microstructure. The particles of the PA and CLA complexes exhibit different sizes and shapes. The surface of these complexes had mixed of rectangular and polygonal pieces. Morphology of the CHL had a rough surface. This complex shows a higher degree of homogeneity than the other complexes, as indicated by the uniformity and similarity of the particles. A smooth plate-like shape is observed for the TCNQ complexes. The surface of this complex is flat and smooth, and it is smoother than the surface of the other complexes. Such a microstructure offers a large surface area. A crushed flake-like shape is observed for the CHL complex. The particles of this complex appear as agglomerates and display different granule size and shape.
 | Fig.8 SEM micrographs of the Met-PA complex |
 | Fig.9 SEM micrographs of the Met-CLA complex |
 | Fig.10 SEM micrographs of the Met-CHL complex |
 | Fig.11 SEM micrographs of the Met-TCNQ complex |
 | Fig.12 SEM micrographs of the Met-DDQ complex |
3 Conclusion
The current study addresses the CT complexation of a vital drug; metformin (Met). Drug Met was complexed with five organic acceptors; PA, CLA, CHL, TCNQ, and DDQ in methanol solvent at room temperature. The isolated CT complexes were characterized by a range of physicochemical methods; IR, Raman, and electronic spectroscopies. Their chemical composition and stoichiometry were verified by CHN elemental analysis. Thermal stability and surface morphology of the complexes were also investigated using TG and SEM techniques, respectively. The results indicate that all complexes are formed based on a 1∶ 1 stoichiometric ratio. The complexes containing DDQ and TCNQ acceptor exhibited good thermal stability (> 200 ℃). This study suggests that the complexation of Met with either PA or CLA acceptors leads to a proton transfer interaction, whereas the Met and molecules of CHL, TCNQ, or DDQ are linked by a direct n→ π * transition.
The authors have declared that no competing interests exist.
参考文献
| [1] |
|
| [2] |
|
| [3] |
|
| [4] |
|
| [5] |
|
| [6] |
|
| [7] |
|
| [8] |
|
| [9] |
|
| [10] |
|
| [11] |
|
| [12] |
|
| [13] |
|
| [14] |
|
| [15] |
|
| [16] |
|
| [17] |
|
| [18] |
|
| [19] |
|
| [20] |
|
| [21] |
|
| [22] |
|
| [23] |
|
| [24] |
|
| [25] |
|
| [26] |
|
| [27] |
|
| [28] |
|
| [29] |
|
| [30] |
|
| [31] |
|
| [32] |
|
| [33] |
|
| [34] |
|
| [35] |
|
| [36] |
|
| [37] |
|
| [38] |
|
| [39] |
|
| [40] |
|
| [41] |
|
| [42] |
|
| [43] |
|
| [44] |
|
| [45] |
|
| [46] |
|
| [47] |
|
| [48] |
|
| [49] |
|
| [50] |
|
| [51] |
|
| [52] |
|
| [53] |
|
| [54] |
|
| [55] |
|
| [56] |
|
| [57] |
|
| [58] |
|