氮气对电晕放电等离子体降解甲基蓝的影响
李苗1,2, 董发勤2,*, 霍婷婷2,3, 周磊2,3, 李刚2,3, 周世平3,4, 王彬2,3, 何平1
1. 西南科技大学材料科学与工程学院, 四川 绵阳 621010
2. 固体废物处理与资源化教育部重点实验室, 四川 绵阳 621010
3. 西南科技大学环境与资源学院, 四川 绵阳 621010
4. 国家城市污水处理及资源化工程技术研究中心, 四川 绵阳 621000
*通讯联系人 e-mail: fqdong@swust.edu.cn

作者简介: 李 苗, 1992年生, 西南科技大学材料科学与工程学院硕士研究生 e-mail: 13890105912@163.com

摘要

电晕放电等离子体技术是近年发展起来的一种新型高级氧化工艺, 因其处理效果好、 操作简单、 占地面积小的特点在印染废水处理领域得到了广泛应用。 目前因大部分有机污染物的降解机理不详, 该技术尚处于探索阶段。 因此, 为了尽早将电晕放电等离子体技术应用于工业印染废水的处理, 不同污染物降解机理的研究对该技术的工业化和产业化应用具有重要意义。 至今, 电晕放电等离子体技术对研究较多的染料的降解效果均较好, 然而, 是否适合所有染料的降解有待进一步研究。 采用电晕放电等离子体技术处理三苯甲烷类染料甲基蓝, 研究了溶液的初始浓度对甲基蓝紫外-可见光谱中芳香环的降解率、 发色基团吸光度变化的影响, 测定了溶液的浓度、 总有机碳(TOC)、 总氮(TN)、 pH值等指标随着放电时间的变化, 并对其相关性进行了分析。 结合紫外-可见光谱(UV-Vis)、 三维荧光光谱(3D-fluorescence)和傅里叶变换红外光谱(FTIR)三种光谱学手段分析了电晕放电降解甲基蓝过程溶液的颜色、 荧光物质和官能团变化, 分析了电晕放电降解甲基蓝30 min后生成的中间产物。 结果表明: 电晕放电等离子体降解甲基蓝过程, 溶液的浓度随着放电时间的延长逐渐减小, 表明该技术对甲基蓝溶液有一定的降解能力; 降解过程高压电极放电击穿含有大量氮气的空气产生N, NO·,N2+等含氮高活性粒子, 这些粒子通过扩散作用迁移至液相, 使得溶液中TN含量在整个降解过程逐渐升高; 另有部分含氮高活性粒子与钨钢针电极溶出的C元素键合生成发色的C=N双键, 使得溶液中的总有机碳在放电5 min时有所升高。 延长反应时间产生的高活性粒子与溶液中的有机物(甲基蓝及中间产物)继续作用, 部分有机物矿化生成CO2, 引起溶液中TOC含量的下降。 电晕放电相同时间内产生的活性粒子数量相当, 增大甲基蓝浓度, 未被降解的甲基蓝分子越多, 导致甲基蓝降解率的减小。 电晕放电过程甲基蓝分子之间的聚合与发色C=N双键的生成共同促使甲基蓝发色基团吸光度在放电5 min时达到最大; 且甲基蓝溶液的初始浓度越高, 吸光度( A5- A0)升高的越多。 概括来说, 甲基蓝结构中发色C=N双键的存在是电晕放电等离子体降解甲基蓝过程溶液颜色加深再变浅的主要原因。 反应过程羟基自由基的消耗导致放电5 min时溶液的pH值升高; 随着反应的进行溶液中生成的硝酸及小分子酸增强了溶液的酸性, 导致pH值降低。 三维荧光光谱结果表明, 甲基蓝降解过程出现了三类明显的荧光峰, 位于EX/EM=310320/430450, EX/EM=240250/320340和EX/EM=280/340, 分别代表腐殖酸类物质、 芳香族蛋白质和溶解性微生物代谢副产物。 甲基蓝溶液降解前的荧光物质主要为腐殖酸类, 随着降解时间的延长, 腐殖酸类物质首先降解生成了芳香族蛋白质, 进一步降解产生可溶性微生物代谢副产物。 比较电晕放电前后甲基蓝溶液的红外光谱图和红外分峰图发现, 甲基蓝结构中N—H键3 432.8 cm-1处不对称伸缩振动峰红移了0.3 cm-1, 烯烃和苯环上C—H键2 975.9 cm-1处的伸缩振动峰向高波数偏移了0.5 cm-1, 1 638.7 cm-1处RCH=CHR的双键伸缩振动位置蓝移了3.2 cm-1, 芳仲胺的C—N伸缩振动峰1 341.6 cm-1向高波数偏移了1.3 cm-1, 磺酸基S=O的伸缩振动峰1 121.1和1 034.3 cm-1分别红移了3.8和13 cm-1, 甲基蓝结构中的环外C=C双键与C=O双键吸收峰消失, 在1 692.4和1 400.4 cm-1处分别出现了C=O和N=O的伸缩振动吸收峰, 产生了2,5-环己二烯-1,4-二酮、 对硝基苯磺酸钠和芳香酮类等中间产物。 该结果对于利用电晕放电等离子体技术处理甲基蓝废水具有重要的理论意义和实用价值。

关键词: 电晕放电等离子体; 甲基蓝; 含氮自由基; 红外光谱; 红外分峰; 三维荧光光谱
中图分类号:X661.1 文献标志码:A
Effects of Nitrogen on the Degradation of Methyl Blue by Corona Discharge Plasma
LI Miao1,2, DONG Fa-qin2,*, HUO Ting-ting2,3, ZHOU Lei2,3, LI Gang2,3, ZHOU Shi-ping3,4, WANG Bin2,3, HE Ping1
1. School of Materials Science and Engineer, Southwest University of Science and Technology, Mianyang 621010, China
2. Key Laboratory of Solid Waste Treatment and Resource Recycle, Ministry of Education, Mianyang 621010, China
3. School of Environment and Resource, Southwest University of Science and Technology, Mianyang 621010, China
4. National Engineering Research Center for Municipal Wastewater Treatment and Reuse, Mianyang 621000, China
Abstract

The corona discharge plasma technology is a new type of advanced oxidation processes (AOPs) which has developed in recent years. Corona discharge plasma technology, which has characteristics such as high degradation efficiency, simple operation and less occupied area, has been widely used in the field of printing and dyeing wastewater treatment. At present, little is known about most of the organic pollutants degradation mechanism, hence this technology in the field of printing and dyeing wastewater treatment is still in the exploratory stage. Therefore, in order to apply the corona discharge plasma technology to the treatment of industry printing and dyeing wastewater as soon as possible, the exploration of different pollutants degradation mechanism is of great significance to the industrialization and industrial application of this technology. Up to now, corona discharge plasma technology has good degradation efficiency on the dyes which had been studied. However, the suitability of this technique for the degradation of all dyes remains to be further researched. In this paper, choosing methyl blue which is of triphenylmethane dye as a target contaminant, corona discharge plasma technology was used to degrade it. The impact of the initial concentration of methyl blue solution on the degradation rate of aromatic ring (314 nm) and the change of chromophore group (603 nm) absorbance in the ultraviolet visible spectra (UV-Vis) were investigated. The changes of the solution concentration, total organic carbon (TOC), total nitrogen (TN) and the pH values of the methyl blue solution were measured with the discharge time increased, and the correlation between them were analyzed. In this paper, three kinds of spectroscopy methods, based on ultraviolet visible spectra (UV-Vis), three dimensional fluorescence spectrum (3-D fluorescence) and Fourier transform infrared spectroscopy (FTIR), were used to analyze the changes of color, varieties of fluorescent substance and functional groups of methyl blue solution during the degradation process by corona discharge plasma. And the intermediate products generated after the methyl blue was degraded by corona discharge for 30 minutes were analyzed. The experimental results showed that the concentration of methyl blue in the solution decreased gradually with the increase of discharge time in the degradation process of methyl blue by corona discharge plasma, which indicated that the technology has a certain ability in the degradation of methyl blue solution. In the degradation process of the methyl blue solution by corona discharge plasma technology, turn on the high-voltage power supply, and the high voltage electrodes penetrate the air containing a large amount of nitrogen between the high voltage electrode and liquid surface to produce N, NO·,N2+ and other nitrogen-containing high activity particles, these particles migrate to the liquid phase through diffusion, which leads to the TN content in the solution to gradually increase throughout the degradation process. In addition, another part of the nitrogen-containing high-activity particles and the C element dissolved from tungsten needle electrode bonding to generate C=O double bound, which is of chromophore group in organic matter, so that total organic carbon in the solution increased at the discharge time of 5 minutes. More highly active particles generated by extending the discharge time reacted with the residual organic matter (methyl blue and intermediate products) in the solution, and some organisms were mineralized to form CO2 with the discharge time increasing, which caused a drop in the TOC content of the solution. The parameters of the corona discharge plasma reactor without any change throughout the degradation process, hence the number of active species generated within the same time frame was identical in the degradation process of methyl blue by corona discharge. Increasing the initial concentration of methyl blue solution is, the more methyl blue molecules are not degraded, which induces the reduction of the degradation rate of methyl blue. The chromophoric group absorbance got the maximum value when the discharge time was 5 minutes, which resulted from the polymerization between methyl blue molecules in the process of corona discharge and the formation of chromophore group of C=N double bonds. In addition, the higher the initial concentration of methyl blue solution, the more the absorbance increases between the discharge time of 5 minutes and 0 minutes ( A5- A0). It can also be observed from the experimental phenomenon that the methyl blue sample in discharge time of 5 minutes had the deepest color in all the samples and then gradually became lighter, further confirming the formation of the C=N bound during the discharging process. In general, nitrogen in the air has an important effect on the degradation of methyl blue by corona discharge plasma, which is mainly attributed to the C=N chromophore group in chemical structure of methyl blue, and the main reason of the solution color deepens and then lighter in the degradation process of methyl blue by corona discharge is that the existence of C=N chromophore group. Moreover, the consumption of the hydroxyl free radicals, which is a kind of active species, generated hydroxyl ions, resulting in the increase of the pH value at the discharge time of 5 minutes. With the progress of the degradation reaction, nitric acid and small molecule acids generated in the solution enhance the acidity of the solution, resulting in a decrease in pH value of the methyl blue solution. It can be seen from the three-dimensional fluorescence spectrum of dissolved organic compounds (DOM) that there exists three kinds of obvious fluorescence peaks in degradation process of methyl blue solution at different times by corona discharge plasma technology. These fluorescence peaks, which are located at EX/EM=310320/430450, EX/EM=240250/320340 and EX/EM=280/340, representing humic acid, aromatic proteins and soluble microbial metabolites, respectively. Three-dimensional fluorescence spectrum results showed that the fluorescent substances in methyl blue solution before degradation are mainly humic acids, with the prolongation of the degradation time, the humic acid was first degraded to aromatic protein, which could further degrade to the soluble microbial metabolic by-product. After the corona discharge time of 30 minutes, compared the infrared spectra and the fitting curves of infrared spectra (1 7501 540 cm-1) of the methyl blue solution before and after corona discharge, the FTIR Spectra of the degraded samples changed obviously. The asymmetric stretching vibration peak at 3 432.8 cm-1 of N—H bond is red-shifted by 0.3 cm-1. The stretching vibration peak at 2 975.9 cm-1 of C—H bond on the olefin and benzene ring is shifted by 0.5 cm-1, the stretching vibration of the double bond of RCH=CHR at 1 638.7 cm-1 shifts blue-shifted by 3.2 cm-1. The C—N stretching vibration peak of aromatic amine 1 341.6 cm-1 shifts to 1.3 cm-1. The stretching vibration peaks at 1 121.1 and 1 034.3 cm-1 of S=O are red shifted by 3.8 and 13 cm-1, respectively. Furthermore, the absorption peaks situate at 1 657.9 and 1 676.9 cm-1 of C=C and the C=N outside the ring in the chemical structure of methyl blue all disappear after the corona discharge for 30 minutes. It showed that the corona discharge plasma discharge effectively destroys these two bonds, and stretching vibration absorption peaks of C=O and N=O appear at 1 692.4 and 1 400.4 cm-1, respectively. Additionally, its degradation products might be 2,5-cyclohexadiene-1,4-diketone, sodium p-nitrobenzene sulfonate and ketones and other intermediates. The results showed that the research has important theoretical significance and practical value in Methyl Blue treatment by Corona discharge plasma technology.

Keyword: Corona discharge plasma; Methyl Blue; Nitrogen free radicals; FTIR; FTIR fitting; Three-dimensional fluorescence
引 言

印染废水是我国排放量较大的工业废水之一, 具有水量大、 浓度高、 颜色深、 污染物成分复杂、 水质波动大等特点[1]。 结合印染废水及印染产品的分类, 染色废水在印染废水中所占比重最大[2]。 传统的印染废水处理方法包括物化法、 化学法和生物法等, 存在处理时间长、 工艺复杂、 易造成二次污染增加处理难度等问题, 无法有效应用于共轭稳定性极高的难降解染料废水处理。 与上述方法相比, 电晕放电等离子体技术富集了强氧化性的高活性粒子(自由基及激发态的原子、 分子等)、 紫外光解、 臭氧氧化等物理化学效应[3, 4], 对印染废水的处理效果优于各方法单独使用, 在印染废水处理领域得到了广泛研究[5]。 目前因大部分污染物的降解机理不详、 降解所需能耗和成本较高的缺点, 该技术尚处于探索阶段。 因此机理的研究和反应器结构的优化对其工业化和产业化应用具有重要意义。

电晕放电等离子体技术对不同染料降解机理的研究是当前印染废水处理研究的热点之一[6]。 国内外已有大量科研工作者采用该技术研究了多种因素对不同结构类型染料废水的矿化、 脱色、 降解效果及能耗的影响, 分析了多种染料废水的降解机理[7, 8]。 有关载气类型对染料废水的降解, 更多研究关注降解效果而对机理的研究较少[9, 10]

本研究以空气为载气, 采用电晕放电等离子体技术处理三苯甲烷类染料甲基蓝, 研究溶液初始浓度对其紫外-可见光谱中特有基团的降解率或吸光度变化的影响; 测定了溶液的浓度与TOC, TN和pH值随电晕放电时间的变化; 分析各指标之间的相互影响关系; 并结合紫外光谱(UV-Vis)、 三维荧光光谱(3D-fluorescence)和红外光谱(FTIR)及peakfit分峰软件, 分析电晕放电等离子体降解甲基蓝过程荧光物质种类及官能团的变化, 分析了降解过程的中间产物。

1 实验部分
1.1 仪器与材料

电晕放电等离子体(重庆大学电气工程学院研制); 紫外-可见分光光度计(Evolution 300, 美国Thermo公司); 傅里叶变换红外光谱仪(Frontier, PerkinElmer股份有限公司); 荧光分光光度计(F-7000, 日本HITACHI); pH计(pHs-3C, 上海雷磁); 总有机碳分析仪(liqui TOC II, 德国Elementar)。

甲基蓝(Methyl Blue, MB), 购自上海阿拉丁试剂有限公司。 甲基蓝的分子式为C37H27N3Na2O9S3, 相对分子质量为799.8, 紫外-可见光谱最大吸收波长在314 nm处。

1.2 方法

1.2.1 降解实验

首先配置一定浓度的甲基蓝溶液于200 mL容量瓶中待用。 其次用蒸馏水、 待处理甲基蓝溶液清洗反应器。 最后向反应器中加入180 mL甲基蓝溶液, 接通高压电极(开始计时), 高压电极击穿溶液上方的空气形成电晕放电, 产生气相等离子体, 迁移至液相, 降解甲基蓝。 整个实验过程时长30 min, 取样间隔5 min, 反应器的操作参数在整个实验中不作任何调整。

1.2.2 分析与表征

甲基蓝结构中芳香环的降解率Y采用式(1)计算

Y=A0-AtA0×100%(1)

式中: Y为甲基蓝结构中芳香环的降解率(%), A0为甲基蓝未降解时的吸光度值, At为甲基蓝降解过程t min的吸光度值。

降解过程甲基蓝溶液的酸碱度、 总有机碳、 总氮、 吸光度、 官能团和荧光物质种类的变化, 分别采用pH, TOC, TN, UV-Vis, FTIR和三维荧光来测试与表征。

2 结果与讨论
2.1 甲基蓝降解过程溶液的TOC, TN, 浓度和pH变化及其相关性分析

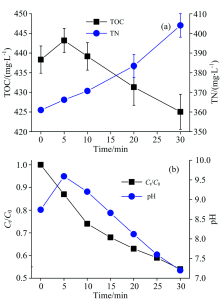
图1所示为电晕放电等离子体降解甲基蓝过程溶液的TOC, TN, 浓度及pH随放电时间的变化。 如图1(a)所示, 随着放电时间的延长, 溶液中的TN含量逐渐升高, 这是因为电晕放电过程高压电极击穿含有大量氮气的空气生成N, N2+, NO· 等含氮高活性粒子, 通过扩散作用迁移至液相与有机物作用, 导致溶液中TN含量的增加[11, 12]。 电晕放电5 min时, 溶液中TOC含量有所升高, 是因为钨钢针电极损耗溶出的C元素与含氮活性粒子键合生成发色的碳氮双键, 导致溶液的TOC含量升高; 进而随着放电时间增加, 电晕放电产生的活性粒子含量更多, 而溶液中有机物浓度越来越少, 导致部分甲基蓝被矿化生成CO2, 引起TOC含量的下降。

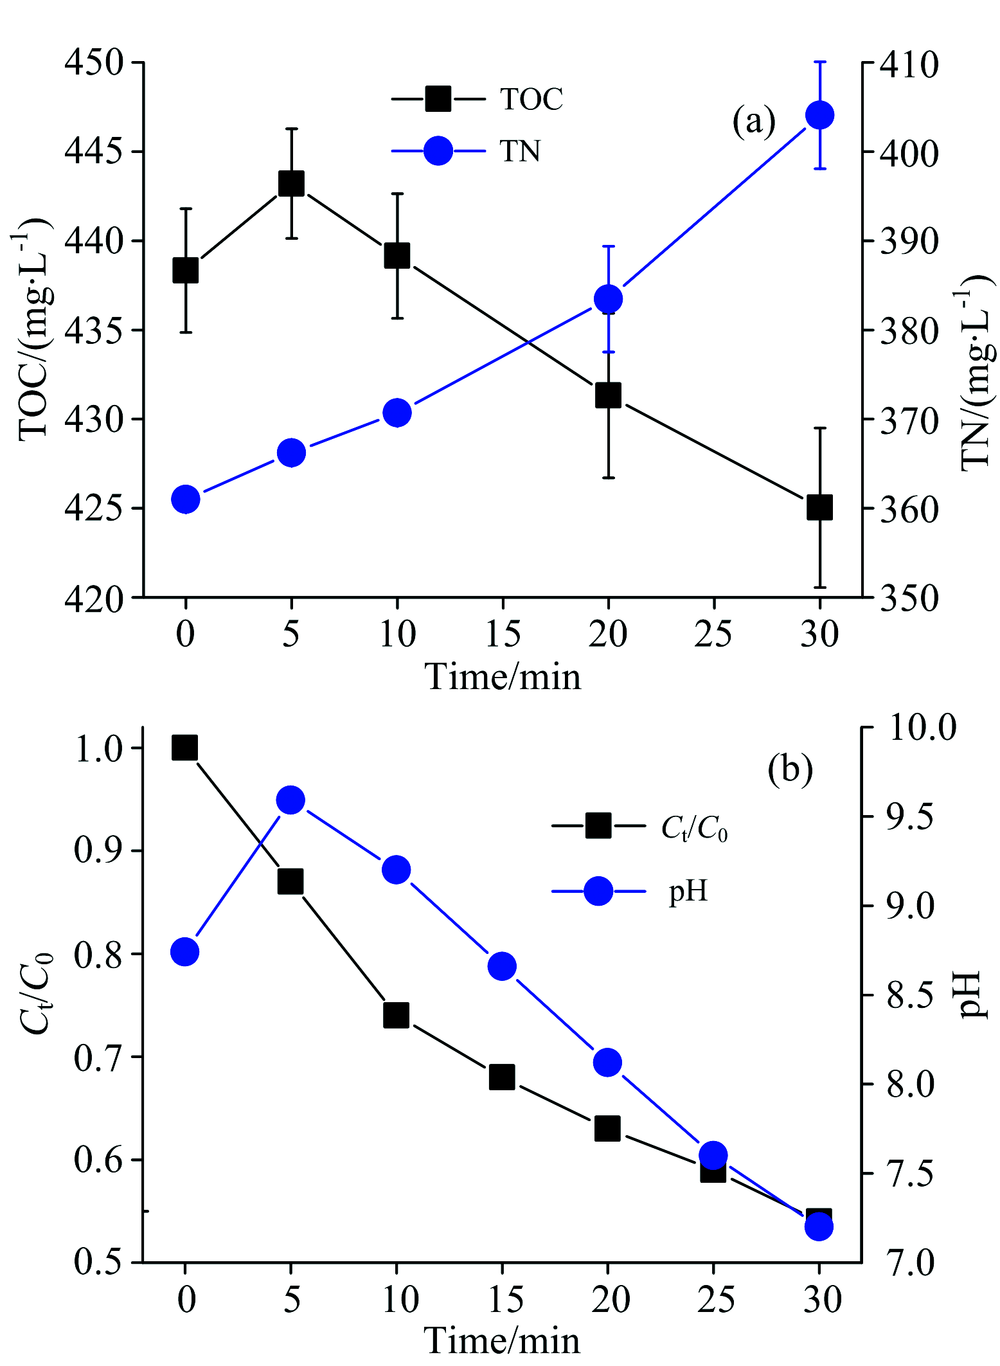
图1 甲基蓝溶液降解过程的(a)TOC和TN变化; (b)浓度与pH变化Fig.1 Changes of (a) TOC and TN; (b) concentration and pH in the degradation process of Methyl blue

如图1(b)所示, 电晕放电等离子体降解甲基蓝过程中, 随着放电时间的增加, 甲基蓝浓度逐渐降低; 溶液pH在放电5 min时有所升高, 后随着放电时间的增加, pH又逐渐降低, 这是因为电晕放电产生的羟自由基参与反应生成氢氧根, 使得溶液的pH升高; 随后溶液pH下降的原因有以下两种: (1)空气中的氮被高能电子碰撞生成含氮自由基, 进入溶液反应生成硝酸; (2)甲基蓝降解过程有小分子酸性物质生成。

由此, 电晕放电等离子体降解甲基蓝过程中, 溶液的浓度与TOC, TN及pH间存在一定的相关性。 在整个降解过程中, 随着甲基蓝浓度的降低, 溶液的pH与TOC均逐步降低, 说明甲基蓝浓度与溶液的pH和TOC间存在一定的正相关性; 而TN含量逐渐升高, 说明甲基蓝浓度与TN之间有一定的负相关性。

2.2 电晕放电降解甲基蓝溶液过程的UV-Vis分析

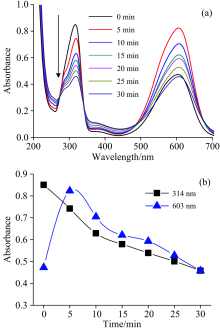
甲基蓝溶液降解过程的紫外-可见光谱如图2(a)所示, 原溶液的紫外-可见光谱在314及603 nm处各存在一个吸收峰, 前者是由甲基蓝结构中的芳香环产生, 而603 nm处的吸收峰是由甲基蓝结构中的C=C, C=N及整个共轭体系发色产生[13, 14]。 降解过程中, 两吸收峰的强度随着处理时间的延长均有所变化, 说明电晕放电等离子体产生的活性物种对甲基蓝溶液产生了一定影响。

图2 甲基蓝溶液降解过程
(a): UV-Vis光谱图; (b): 各峰吸光度变化
Fig.2 Degradation of methyl blue by corona discharge
(a): UV-Vis spectra; (b): Changes in absorbance of different groups

图2(b)所示为甲基蓝溶液两吸收峰的吸光度随放电时间的变化图。 芳香环的吸收峰(314 nm)强度随着处理时间的延长逐渐减弱, 溶液中芳香环浓度减小, 说明溶液中部分甲基蓝分子结构已被破坏。 发色基团的吸收峰(603 nm)强度先增强后又减弱, 这是因为反应初期生成的C=N, 随反应延长时间浓度逐渐减小, 是因为活性粒子可有效降解溶液中的有机物。 从溶液的表观颜色可以观察到, 放电5 min的甲基蓝样品在所有样品中颜色最深, 后又逐渐变浅, 进一步印证了放电过程C=N键的生成。

2.3 甲基蓝溶液初始浓度对其紫外-可见谱各吸收峰的影响

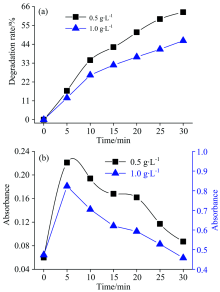
保持其他反应条件不变, 改变甲基蓝溶液的初始浓度, 考察甲基蓝溶液紫外-可见谱两吸收峰强度的影响。 如图3(a)所示, 放电时间相同甲基蓝溶液的初始浓度越高, 溶液中芳香环的降解率越低。 这主要是因为, 相同的放电情况下, 系统产生的活性粒子数量相同。 甲基蓝分子与活性粒子的碰撞几率取决于活性粒子的数量。 甲基蓝初始浓度较高, 电晕放电更多的甲基蓝分子因没有机会与活性粒子碰撞而未被降解。

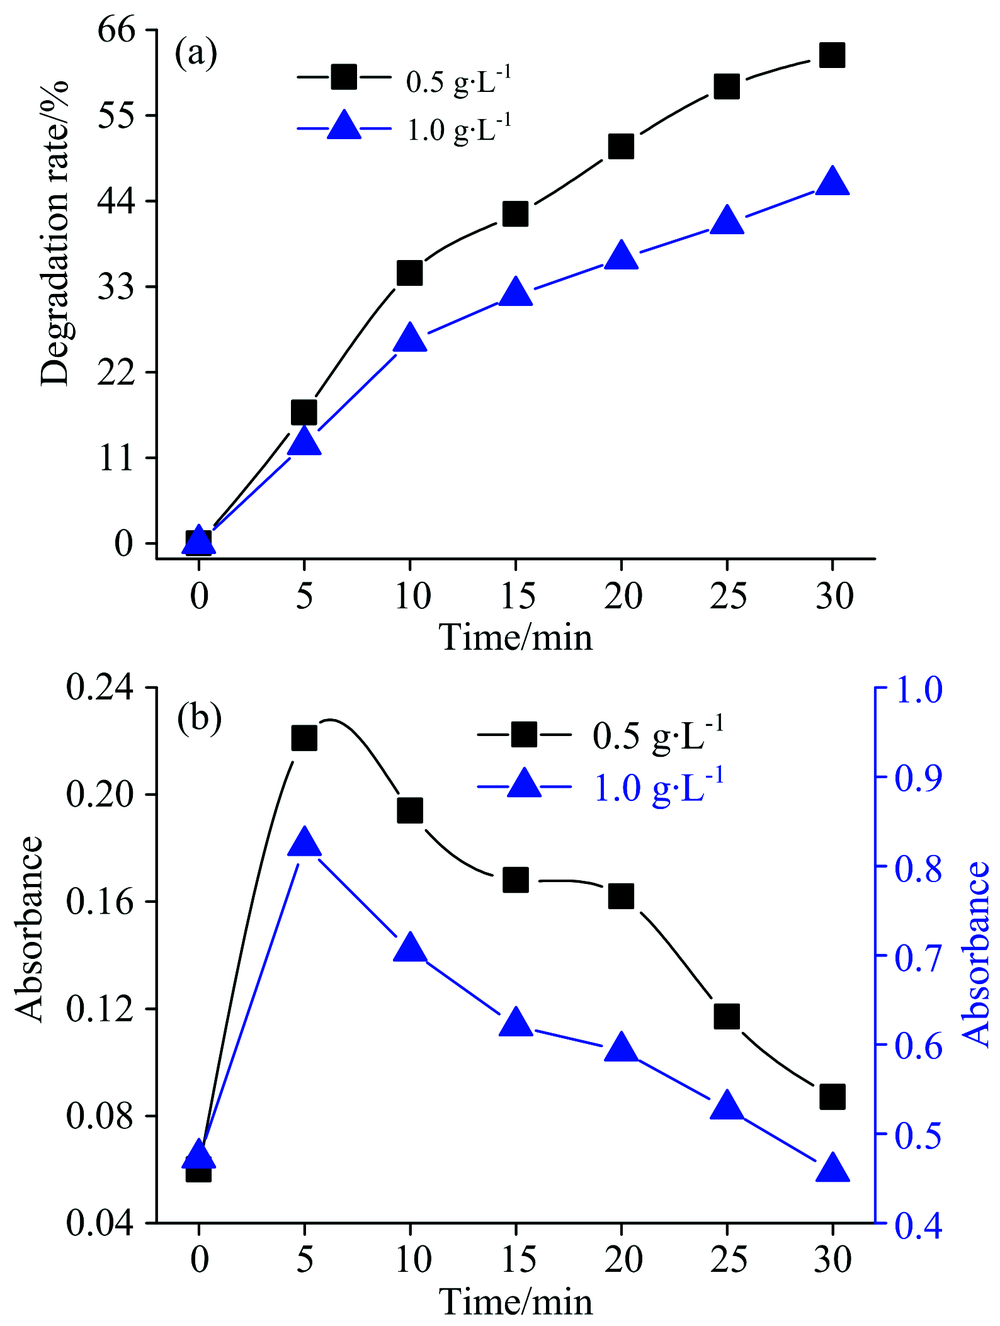
图3 溶液初始浓度对甲基蓝(a)芳香环降解率(b)发色基团吸光度的影响Fig.3 Effect of the initial concentration of Methyl blue on (a) degradation rate of aromatic rings; (b) absorbance of chromophore group

观察图3(b)发现, 甲基蓝溶液的初始浓度越高, 其吸光度差值Δ A(A5-A0)越大。 这可能是因为溶液初始浓度越高, 相同时间内未被降解的甲基蓝浓度越高, 分子间的聚合越明显, 使得溶液发色基团浓度增加的越多。

2.4 甲基蓝溶液降解过程的三维荧光光谱分析

如图4所示, 降解甲基蓝不同时间水样中溶解性有机物(DOM)的三维荧光图谱中, 出现了三类明显的荧光峰, 位于EX/EM=310320/430450, EX/EM=240250/320340和EX/EM=280/340, 分别代表腐殖酸类物质、 芳香族蛋白质和溶解性微生物代谢副产物[15, 16]

图4 电晕放电降解甲基蓝不同时间的三维荧光谱图
(a): 0 min; (b): 5 min; (c): 10 min; (d): 20 min; (e): 30 min
Fig.4 EEM fluorescence spectra of methyl blue at different degradation times
(a): 0 min; (b): 5 min; (c): 10 min; (d): 20 min; (e): 30 min

将每个样品三维荧光图谱出峰的荧光强度和位置进行比较, 结果如表1所示。

表1 甲基蓝溶液放电不同时刻的三维荧光图谱出峰对照表 Table 1 Effect of discharge time on three-dimension fluorescence of methyl blue soluuion

甲基蓝原溶液的三维荧光图谱中只存在腐殖酸类物质的荧光峰。 随着放电时间的增加, 溶液中荧光峰的强度、 位置与数量均发生了变化, 如表1所示。 整个放电过程, 腐殖酸类物质的荧光强度随着放电时间的增加普遍降低, 说明电晕放电有效降解或转化了部分腐殖酸类物质。 放电5 min时, 溶液中产生了芳香族蛋白质的荧光峰。 随着放电时间增加到20 min, 溶液中芳香族蛋白质的荧光峰强度普遍升高, 而腐殖酸类物质的荧光强度逐渐下降, 说明部分腐殖酸类物质降解或转化形成了芳香族蛋白质。 与放电20 min相比, 放电30 min的溶液中腐殖酸类物质减少, 芳香族蛋白质也减少, 新产生了溶解性微生物代谢副产物的荧光峰, 说明电晕放电同样可有效降解或转化芳香族蛋白质同时产生溶解性微生物代谢副产物。

综上所述, 甲基蓝原溶液中的主要荧光物质为腐殖酸类。 电晕放电等离子体有效降解或转化了部分腐殖酸类物质, 形成了芳香族蛋白质和溶解性微生物代谢副产物。 在整个降解过程中, 首先由腐殖酸类物质转化成了芳香族蛋白质, 再进一步转化产生溶解性微生物代谢副产物。

2.5 电晕放电前后甲基蓝溶液FTIR分析

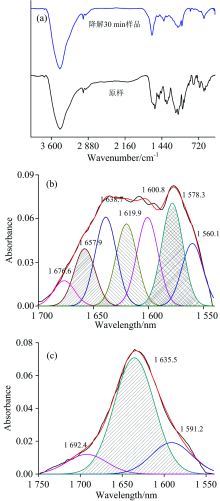
甲基蓝降解前后的红外光谱示于图5(a)。 为了更好地分析电晕放电对甲基蓝结构的影响, 利用peakfit软件对甲基蓝结构中主要官能团区(1 7501 540 cm-1)进行分峰处理, 结果如图5(b)和(c)所示。 参照文献及红外光谱手册[17, 18], 对其进行了解析, 将各官能团和键的特征振动频率列于表2

表2 甲基蓝溶液降解前后红外官能团对照表 Table 2 Comparison of FTIR functional groups of methyl blue before and after degradation

图5 甲基蓝溶液降解前后的FTIR图
(a): 红外光谱图(4 000400 cm-1); (b), (c): 红外分峰图(1 7501 540 cm-1)
Fig.5 FTIR spectra of Methyl Blue before and after degradation
(a): FTIR spectra (4 000400 cm-1); (b), (c) Fitting curves of FTIR spectra (1 7501 540 cm-1)

结合图5(a)— (c)及表2可以看出, 相比甲基蓝的原谱图, 降解后的样品谱图发生了明显变化。 电晕放电降解30 min后, 甲基蓝结构中N— H键3 432.8 cm-1处不对称伸缩振动峰红移了0.3 cm-1, 烯烃和苯环上C— H键2 975.9 cm-1处的伸缩振动峰向高波数偏移了0.5 cm-1, 1 638.7 cm-1处RCH=CHR的双键伸缩振动位置蓝移了3.2 cm-1, 芳仲胺的C— N伸缩振动峰1 341.6 cm-1向高波数偏移了1.3 cm-1, 磺酸基S=O的伸缩振动峰1 121.1和1 034.3 cm-1分别红移了3.8和13 cm-1; C=N与R2C=CR2键的吸收峰在降解后的样品中未出现, 说明电晕放电有效打断了这两个键。 此外, 在1 692.4和1 400.4 cm-1处各出现了一个新峰, 分别是C=O和N=O的吸收峰, 说明降解后的中间产物有2, 5-环己二烯-1, 4-二酮、 对硝基苯磺酸钠和芳香酮类中间物质生成。

3 结 论

(1)电晕放电等离子体降解甲基蓝过程中, 溶液初始浓度对芳香环的降解率有显著影响, 整个降解过程溶液的TN含量逐渐升高, TOC与pH值均在放电5 min时最高, 后随着放电的进行又逐渐降低。

(2)电晕放电等离子体降解甲基蓝过程, 首先高压电子击穿空气产生OH· , H· , HO2· , N, N2+和NO· 等高活性粒子, 部分含氮高活性粒子与钨钢针电极在高压轰击下损耗溶出的C键合生成发色的C=N双键, 导致放电5 min时溶液的TOC含量有所上升, C=N双键的生成及甲基蓝分子之间的聚合作用共同导致放电5 min时溶液颜色的加深; 另有一些高活性粒子通过扩散迁移进入液相与甲基蓝作用, 使得溶液的TN含量一直增加。 进入溶液的高活性粒子破坏甲基蓝结构中不稳定的环外C=C及C=N, 在1 692.4和1 400.4 cm-1处分别产生了C=O及N=O吸收峰, 生成了2, 5-环己二烯-1, 4-二酮、 对硝基苯磺酸钠和芳香酮类中间物质, 表明电晕放电等离子体技术可有效降解甲基蓝溶液。

The authors have declared that no competing interests exist.

参考文献
[1] Ha J S, Park H W, Kim S W, et al. Journal of Korean Society on Water Environment, 2008, 24(5): 537. [本文引用:1]
[2] XI Dan-li, MA Chun-yan(奚旦立, 马春燕). Dyes(印染), 2010, 36(14): 51. [本文引用:1]
[3] Yang L, Yi R, Yi C, et al. Acta Scientiae Circumstantiae(环境科学学报(英文版)), 2017, 53(3): 238. [本文引用:1]
[4] Xue J, Chen L, Wang H. Chemical Engineering Journal, 2008, 138(13): 120. [本文引用:1]
[5] Sugai T, Nguyen P T, Maruyama T, et al. IEEE Transactions on Plasma Science, 2016, 44(10): 2204. [本文引用:1]
[6] El-Tayeb A, El-Shazly A, Elkady M. Energies, 2016, 9(11): 874. [本文引用:1]
[7] Magureanu M, Bradu C, Piroi D, et al. Plasma Chemistry and Plasma Processing, 2013, 33(1): 51. [本文引用:1]
[8] Attri P, Yusupov M, Park J H, et al. Scientific Reports. 2016, 6: 34419. [本文引用:1]
[9] García M C, Mora M, Esquivel D, et al. Chemosphere, 2017, 180: 239. [本文引用:1]
[10] Pankaj S K, Wan Z, Colonna W, et al. Water Science & Technology, 2017, 76(3): 567. [本文引用:1]
[11] Cadorin B M, Tralli V D, Ceriani E, et al. Journal of Hazardous Materials, 2015, 300: 754. [本文引用:1]
[12] Hunger K, Gregory P, Miederer P, et al. Industrial Dyes: Chemistry, Properties, Applications. Wiley VCH Verlag GmbH & Co. KGaA, 2004. 13. [本文引用:1]
[13] Samide A, Tutunaru B, Tigae C, et al. Environment Protection Engineering. 2014, 40(4): 93. [本文引用:1]
[14] WANG Shuo, BAO Jian-guo, KE Xiong-feng(王硕, 鲍建国, 柯雄峰). Environmental Science and Management(环境科学与管理), 2011, 36(10): 110. [本文引用:1]
[15] Ahmad S R, Reynolds D M. Water Research, 1999, 33(9): 2069. [本文引用:1]
[16] Hudson N, Baker A, Ward D, et al. Science of the Total Environment, 2008, 391(1): 149. [本文引用:1]
[17] Yuan Y, Li H, Lai B, et al. Engineering Chemistry Research, 2016, 53(7): 2605. [本文引用:1]
[18] LIU Hong-min(刘宏民). Practical Organic Spectroscopy Analysis(实用有机光谱解析). Zhengzhou: Zhengzhou University Press(郑州: 郑州大学出版社), 2015. [本文引用:1]