


利用一种偏振方法减小由强反射或弱反射强度引起的植被反演误差
[赵守江1  , 杨彬
, 杨彬1 , 焦健楠2 , 杨鹏1 , 吴太夏3, * , 王雪琪1 , 晏磊1, * ]
, 杨彬, 王雪琪]
|
|


无论是多角度遥感的发展、 还是偏振、 高光谱遥感的发展, 它们有一个相同的目的, 即利用电磁波的种种特性、 以及空间特性来对地球表面的一切地物进行精确的识别。 任何单一的方法和手段不可能完整地描述和反映地物的所有特征。 偏振测量是目标测量识别技术中不可缺少的技术之一, 并且成为近年来全世界目标识别领域中的研究热点。 由于定量遥感的反射强度对植被遥感的影响不可忽视, 反射辐射信号呈现饱和或过弱都不能被检测到。 而偏振是植被定量遥感的重要手段, 因而有必要开发一种克服由反射强度强弱引起的植被反演误差的方法, 这也是我们目前的研究目标。 如果反射的辐射信号太强或太弱, 都会影响遥感的准确性, 而来自植被的偏振光可以提供有用的信息, 特别是当反射的辐射信号饱和时, 使得传感器不能获得足够有用的非偏振信息。 本研究采用基于地面的偏振成像光谱仪系统, 开发了一种偏振方法来克服反射强度过强过弱引起的植被反演误差。 利用FISS-P偏振成像光谱仪系统研究了反射强度对遥感植被NDVI和DoLP效用的影响, 实验地点在北京市中国科学院奥林匹克科技园。 在对目标采样时对反射率强, 反射率弱以及反射率适中的植被分别测量, 同时对目标植被的不同波段(470, 555, 670, 864 nm)的DoLP进行计算与分析。 地基成像光谱仪系统(FISS-P)提供了具有偏振信息的高空间分辨率图像, 我们可以确定在阴影和强反射区域中单个像素的光谱偏振特性。 在成像光谱信息的基础上, 利用光的偏振性来对地物的物理特性进行分析。 本文使用斯托克斯分量来表征反射光的各个偏振分量, 使用线偏振度(DoLP)表征反射光偏振程度。 信号饱和度和阴影效应导致归一化植被指数(NDVI)植被密集程度非常低, 造成严重的反演误差, 然而强反射对线偏振度(DoLP)的影响不大。 研究结果表明, 反射辐射信号饱和时, 偏振效应可以通过适当的频带提高植被的反演精度, 平均NDVI的相对误差为33.8%, 而DoLP(670 nm)的相对误差仅为6.3%, 而其他波段的DoLP(555 nm, 864 nm)的相对误差要大很多。 这项研究结果表明, 在植被识别时可以忽略强反射, 然而, 阴影(弱反射)效应是不容忽视的。 FISS-P偏振成像光谱仪是用于计算具有不同反射强度的样品类型的偏振和非偏振参数的有效工具, 同时发现在识别植被时, 强烈的反射可以忽略不计, 但是植被的阴影(弱反射)效应不容忽视。 与非偏振方法相比, 偏振效应可以提高反射辐射信号饱和时的植被反演精度。 这项研究分析了使用偏振法强弱反射强度引起的误差减少。 为了进一步揭示植被的阴影(弱反射)效应与DoLP之间的关系, 还有一些问题需要解决。
Biography: ZHAO Shou-jiang, (1996—), Ph. D. student, the School of Earth and Space Sciences, Peking University,e-mail: 1601110606@pku.edu.cn
Whether the development of multi angle remote sensing, or the development of polarization and hyperspectral remote sensing all have the same purpose. They use the characteristics and spatial characteristics of electromagnetic waves to accurately identify all the surface of the earth’s object. Any single method and means cannot fully describe and reflect all the features of the ground. Polarization measurement is one of the indispensable technologies in target recognition and recognition technology, and has become a research hotspot in the field of target recognition in the world in recent years. Since the effects of strong and weak reflection intensity on vegetation remote sensing cannot be ignored in quantitative remote sensing inversion, which renders the reflected radiant signal as either saturated or too weak to be detected. Polarization is an important method for the quantitative remote sensing of vegetation. Consequently, it is necessary to develop a method to overcome the vegetation inversion error caused by strong and weak reflection intensities, which is the goal of our present research. If the reflected radiant signal is either too strong or too weak, it will affect the accuracy of remote sensing. Polarized light from vegetation can provide useful information, especially when the reflected radiant signal is saturated so that the sensor cannot obtain enough useful non-polarization information. This study developed a polarization method to overcome the vegetation inversion error caused by strong or weak reflection intensity using a ground-based polarized field imaging spectrometer system. The FISS-P polarization imaging spectrometer system was used to study the effect of reflection intensity on the utility of remote sensing vegetation NDVI and DoLP. The experiment was conducted at the Olympic Science and Technology Park of Chinese Academy of Sciences in Beijing. When targets are sampled, the vegetation with strong reflectivity, low reflectivity and moderate reflectivity is measured respectively. Meanwhile, the DoLP of target vegetation’s different bands (470, 555, 670, 864 nm) are calculated and analyzed. The degree of vegetation density (NDVI) is very low due to signal saturation and shadow effect, resulting in severe inversion error. However, strong reflection has little effect on DoLP. As the ground-based field imaging spectrometer system (FISS-P) provides high-spatial-resolution images with polarization information, we can determine the spectrum-polarization characteristics of single pixels in shaded and strong reflection areas. On the basis of the imaging spectral information, the physical properties of the ground objects are analyzed by using the polarization of light. In this paper, the Stokes component is used to characterize the polarization components of the reflected light, and the degree of polarization of the reflected light is characterized by linear polarization (DoLP). Signal saturation and shadow effects result in very low values for dense vegetation on the Normalized Difference Vegetation Index (NDVI), causing serious inversion error. However, strong reflection has few effects on the degree of linear polarization (DoLP). This study showed that polarization can improve vegetation inversion accuracy by using the appropriate band when the reflected radiant signal is saturated, and the relative error of the average NDVI is 33.8%, while that of DoLP (670 nm) is only 6.3%,the relative errors of DoLP (555, 864 nm) in other bands are much larger. The results of this study show that strong reflection can be ignored when identifying vegetation, however, the shadow (weak reflection) effects could not be ignored. FISS-P images are an effective tool for calculating polarization and non-polarization parameters for sample types with different reflection intensities. In conclusion, the polarization effect can improve the vegetation inversion accuracy when the reflected radiant signal is saturated compared with non-polarization methods. This study analyzed the reduction in error caused by strong and weak reflection intensities using a polarization method. And there are still some problems need to be solved in order to further reveal the relationship between the shadow (weak reflection) effects and DoLP of vegetation.
Hyperspectral remote sensing has been used widely for Earth observation, and provides both spectrum and space information[1]. The use of hyperspectral remote sensing technology for monitoring vegetation is increasing rapidly, hyperspectral and relative vegetation indices are used to monitor grain rally as well as the biochemical properties, carbon and nitrogen content of crops[2]. The Earth Observation Land Data Assimilation System, and many models such as PROSAIL, use hyperspectral remote sensing technology to study plant canopy spectral and directional vegetation biophysical properties in the solar domain[3, 4]. Therefore, it is necessary to study the effects of strong and weak reflection intensities on hyperspectral remote sensing and try to overcome them.
Radiation scattered by objects generates partial polarization, which can add a new dimension to the information associated with target detection and Earth observation[5]. Theresearch scanning polarimeter, Polarization and Directionality of the Earth Reflectance system, use unique properties to investigate the directional and polarization properties of surface reflectance[6]. Empirically, polarization from vegetation accounts for 2%~23% of the reflected radiation and it is difficult for it to become saturated[7]. Some remote sensing models include polarization features and usually employ Stokes parameters to represent polarization[8]. Moreover, spectrum-polarization imaging combines the benefits of polarization and hyperspectral characteristics[9] can provide not only the spectral intensity of vegetation, but also extra polarization information of vegetation, which improves the method and accuracy of the inversion of vegetation characteristics[11].
Inversion errors caused by strong and weak reflection intensities in vegetated areas are major contributors to the reflected signal of vegetation, which has seldom been incorporated explicitly into spectrum-polarization remote sensing due to the low spatial resolution[12].
A Stokes vector is used to representa polarized beam, and describe the electromagnetic wave in terms of intensity and polarization[10]. Stokes vector representation is easily measured and is the commonest way to represent thepropagation of a beam along a complex path during remote sensing, E stands for a simple set of measurements of the irradiance transmitted through a conceptual set of filters. Let the polarizer rotate successively by 0° , 60° , and 120° ; then, we can get the irradiances E0, E60, and E120 transmitted through the corresponding filters. The Stokes vector is calculated as:
In addition, the degree of linear polarization (DoLP) of the incident light can be calculated as
In the experiment, data were collected using a ground-based FISS-P that provides high-spatial resolution and high-spectral resolution polarization information, as is shown in Fig.1. Table 1 summarizes the main technical parameters of the FISS-P[2].
 | Fig.1 Photograph of polarized field imaging spectrometer system (FISS-P) |
| Table 1 Units for Magnetic Properties Main Parameters of the FISS-P |
The polarized hyperspectral data were collected at the Olympic Science and Technology Park of the Chinese Academy of Sciences, Beijing, China over a Sedum spectable Boreau field on July 2nd 2012, when the weather was sunny and calm.we sampled the area of typical vegetation, vegetation with strong reflection, and vegetation in shadow (weak reflection). Here, vegetation with moderate reflection equates to typical vegetation. A diffuse reflectance standard white plate, which is an isotropic material with a reflectance of 1, was used to correct the measurement accuracy of the polarized imaging spectrometer.
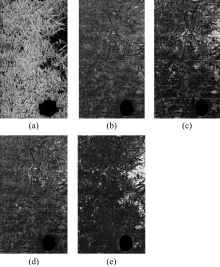
Fig.2 shows images based on the Normalized Difference Vegetation Index (NDVI) and degree of linear polarization (DoLP) in the visible and near-infrared bands. Vegetation has a higher NDVI value than soil, which has an NDVI value close to zero. By contrast, the DoLP values of the different bands show an opposing trend, with high values for soil and low values for vegetation. For both the NDVI and DoLP, the diffuse reflectance standard white plate has a value of 0.
 | Fig.2 Observed images of different parameters (a): Image of NDVI; (b): Image of DoLP at 470 nm; (c): Image of DoLP at 555 nm; (d): Image of DoLP at 670 nm; (e): Image of DoLP at 864 nm. Typical vegetation; middle, vegetation with strong reflectance; bottom, vegetation in shadow |
This study found that the NDVI values for vegetated areas with strong and weak reflection were much lower than for typical vegetation areas, although the vegetation samples chosen for comparison had similar features, as is shown in Fig.2.
In the histogram of NDVI, the value for typical vegetation ranged from 0.55 to 0.7, indicating dense vegetation. For the vegetation area in the shadow, the NDVI was much lower (between 0.25 and 0.4), making it difficult to identify vegetation using the NDVI. Strong reflection has a greater effect on the NDVI of dense vegetation, resulting in values between 0.25 and 0.7. Moreover, there was a peak between 0 and 0.05, which incorrectly implies that these areas are not vegetated. Consequently, the effects of strong and weak reflection cannot be ignored when using vegetation indexes like the NDVI for remote sensing vegetation.
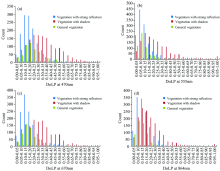
In the histogram of DoLP for the visible and near-infrared bands, the DoLP values of typical vegetation and vegetation with strong reflection are similar, as shown in Fig.4. The DoLP values are low and range mainly from 0 to 0.35. Compared with NDVI in Fig.3, strong reflection has less effect on the polarization reflectance features of vegetation, so strong reflection effects can be ignored when DoLP is used to identify vegetation. In contrast, there is a small right shift in the histogram distribution of DoLP for shaded vegetation areas, with peak shifts of 0.05, 0.05, 0.10, and 0.05 at 470, 555, 670, and 864 nm, respectively.
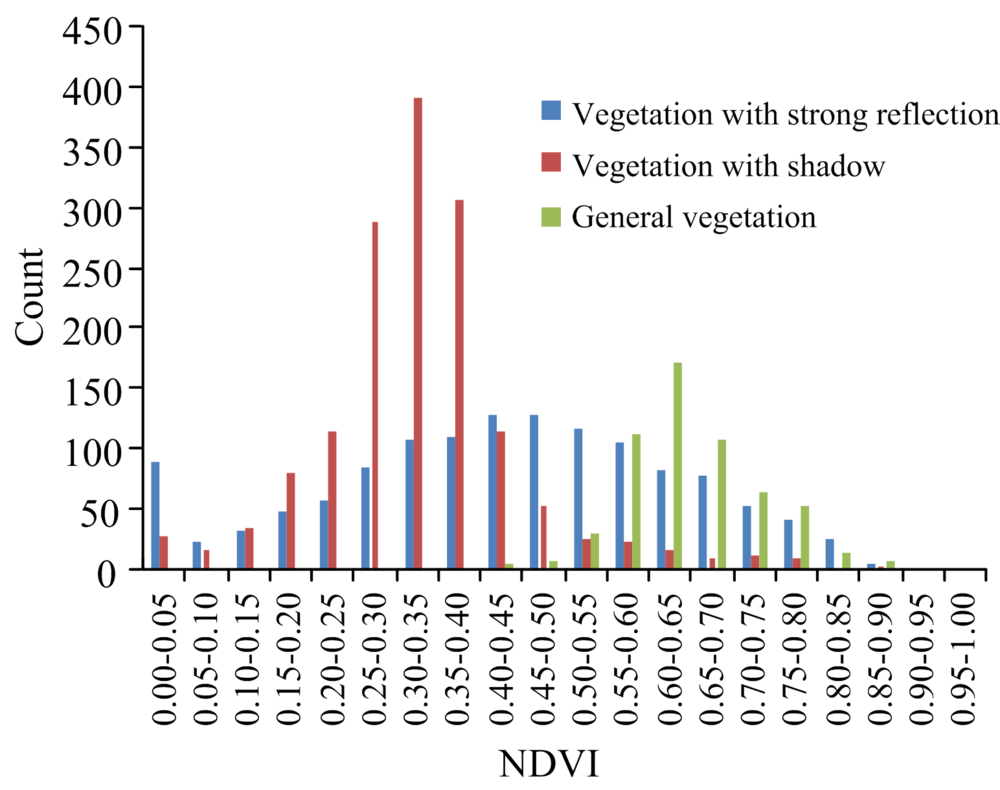 | Fig.3 Histogram of NDVI under different reflection intensity |
 | Fig.4 Histogram of DoLP at visible and near infrared bands |
The polarization and non-polarization results show that it is necessary to consider the effects of reflection intensity on vegetation remote sensing. The average NDVI values for typical vegetation and vegetation with strong reflection are 0.65 and 0.43, respectively, which can cause marked errors when identifying vegetation (Table 2). In comparison, the difference in DoLP between these two sample types is quite small. For typical vegetation, the average DoLP values were 0.21, 0.10, 0.16, and 0.11 at 470, 555, 670, and 864 nm, respectively, versus 0.19, 0.13, 0.17, and 0.14 for vegetation with strong reflection. The relative error of the average NDVI value for strong reflection is 33.8%, while the relative error of the average DoLP values at the different bands were 9.5, 30, 6.3, and 27.3%, respectively. Comparing typical vegetation and vegetation in shadow, both the NDVI and DoLP are affected so that shadow cannot be ignored when using the DoLP and vegetation indexes such as the NDVI to remote sense vegetation. Fig.5 shows that both the mean and median values of DoLP are similar between typical vegetation and vegetation with strong reflection, while values for shaded vegetation are quite different. By contrast, the NDVI values all differ markedly between typical vegetation, strong reflectance, and shadow. The DoLP is useful for reducing the inversion error caused by strong reflection.
| Table 2 Statistical Data for Different Parameters of Different Kinds of Samples |
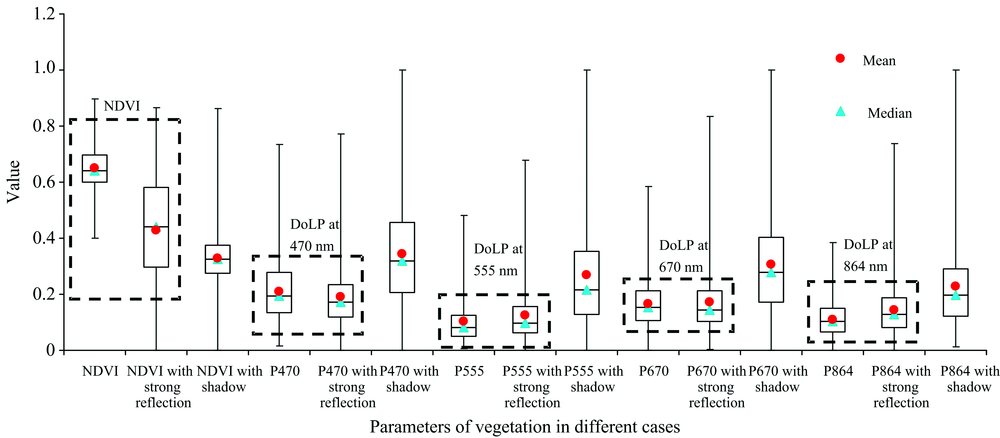 | Fig.5 Boxplot of NDVI and DoLP at visible and near infrared bands for different kinds of samples |
Our conclusions were as follows: (1) FISS-P is an effective tool for calculating polarization and non-polarization parameters for sample types with different reflection intensitieson the utility of NDVI and DoLP for remote sensing vegetation. (2) Reflection intensity has different effects on the non-polarization and polarization parameters of vegetation; strong reflection has little effect on DoLP at some bands, while the shadow (weak reflection) effects cannot be ignored when identifying vegetation. (3) Polarization can improve vegetation inversion accuracy when the reflected radiant signal is saturated compared with non-polarization methods such as the NDVI.
The authors have declared that no competing interests exist.
| [1] |
|
| [2] |
|
| [3] |
|
| [4] |
|
| [5] |
|
| [6] |
|
| [7] |
|
| [8] |
|
| [9] |
|
| [10] |
|
| [11] |
|
| [12] |
|